Discrimination and prediction of the origin of
Chinese and Korean soybeans using Fourier
transform infrared spectrometry (FT-IR) with
multivariate statistical analysis
Byeong-Ju Lee1, Yaoyao Zhou1, Jae Soung Lee1, Byeung Kon Shin2, Jeong-Ah Seo3, Doyup Lee4, Young-Suk Kim5, Hyung-Kyoon Choi1
*
1 College of Pharmacy, Chung-Ang University, Seoul, Republic of Korea, 2 National Agricultural Products
Quality Management Service, Gimcheon, Republic of Korea, 3 School of Systems Biomedical Science, Soongsil University, Seoul, Republic of Korea, 4 Department of Bio and Fermentation Convergence Technology, Kookmin University, Seoul, Republic of Korea, 5 Department of Food Science and Engineering, Ewha Womans University, Seoul, Republic of Korea
Abstract
The ability to determine the origin of soybeans is an important issue following the inclusion of this information in the labeling of agricultural food products becoming mandatory in South Korea in 2017. This study was carried out to construct a prediction model for discriminating Chinese and Korean soybeans using Fourier-transform infrared (FT-IR) spectroscopy and multivariate statistical analysis. The optimal prediction models for discriminating soybean samples were obtained by selecting appropriate scaling methods, normalization methods, variable influence on projection (VIP) cutoff values, and wave-number regions. The factors for constructing the optimal partial-least-squares regression (PLSR) prediction model were using second derivatives, vector normalization, unit variance scaling, and the 4000–400 cm–1region (excluding water vapor and carbon dioxide). The PLSR model for discriminating Chinese and Korean soybean samples had the best predictability when a VIP cutoff value was not applied. When Chinese soybean samples were identified, a PLSR model that has the lowest root-mean-square error of the prediction value was obtained using a VIP cutoff value of 1.5. The optimal PLSR prediction model for discriminating Korean soybean sam-ples was also obtained using a VIP cutoff value of 1.5. This is the first study that has com-bined FT-IR spectroscopy with normalization methods, VIP cutoff values, and selected wave-number regions for discriminating Chinese and Korean soybeans.
Introduction
The soybean (Glycine max) is a useful plant crop with high lipid and protein contents [1]. Soy-beans can be used to produce soybean oil, as a protein source, or as a good source of nutrients. They are also pharmacologically active, with these effects originating from their constituent
a1111111111 a1111111111 a1111111111 a1111111111 a1111111111 OPEN ACCESS
Citation: Lee B-J, Zhou Y, Lee JS, Shin BK, Seo
J-A, Lee D, et al. (2018) Discrimination and prediction of the origin of Chinese and Korean soybeans using Fourier transform infrared spectrometry (FT-IR) with multivariate statistical analysis. PLoS ONE 13(4): e0196315.https://doi. org/10.1371/journal.pone.0196315
Editor: David A. Lightfoot, College of Agricultural
Sciences, UNITED STATES
Received: December 27, 2017 Accepted: April 10, 2018 Published: April 24, 2018
Copyright:© 2018 Lee et al. This is an open access article distributed under the terms of theCreative Commons Attribution License, which permits unrestricted use, distribution, and reproduction in any medium, provided the original author and source are credited.
Data Availability Statement: All relevant data are
within the paper.
Funding: This work was supported by Korea
Institute of Planning and Evaluation for Technology in Food, Agriculture, Forestry and Fisheries(IPET) through Advanced Production Technology Development Program funded by Ministry of Agriculture, Food and Rural Affairs (MAFRA) (316081-04 awarded to HKC). This work was also funded by the National Research Foundation of
isoflavones [2]. The beneficial health effects of soybean isoflavones include reducing the risks of cardiovascular problems [3,4], cancer [5–7], and osteoporosis [8,9].
In Korea, soybeans are cooked and used to prepare foodstuffs such as doenjang (fermented soybean paste), cheonggukjang (fast-fermented soybean paste), and gochujang (fermented red pepper paste) [10]. Soybeans are frequently used in Korean cuisine. However, there are many cases where the country of origin of the beans is unclear, and relatively inexpensive foreign soybeans are often imported and labeled as Korean soybeans. The National Agricultural Prod-ucts Quality Management Service introduced an agricultural food country-of-origin labeling system in 1991 to protect domestic agricultural producers and consumers [11]. Soybeans have been included in that system since 2017, and merchants must now indicate the origin of any soybeans that they advertise for sale [12]. This situation means that technology for discriminat-ing Chinese and Korean soybean is needed.
The quality of soybeans depends on several factors such as their variety and where they were cultivated, and these factors must be considered when determining where particular soy-beans originate from. However, it is difficult to consider all soybean varieties because there are hundreds of varieties spread over a vast area [13]. We assumed that soybeans cultivated for thousands of years within a particular region would have become well adapted to the local environmental conditions, and hence that the soybeans could be discriminated based on geo-graphical factors rather than varietal differences.
Metabolomics can be used to discriminate genetic and environmental differences based on the comprehensive profiling and analysis of plant metabolites [14]. This can be implemented using established tools such as gas chromatography/mass spectrometry, nuclear magnetic reso-nance (NMR) spectroscopy, liquid chromatography/mass spectrometry, Fourier-transform infrared (FT-IR) spectroscopy, and direct-infusion mass spectrometry [15]. These tools can be used to discriminate the geographical origin of plants. For example, a method employing a so-called electronic nose and combined gas chromatography/mass spectrometry/olfactometry with principal-components analysis has been used to discriminate the geographical origin of chrysanthemum flower teas [16].1H-NMR spectroscopy has been combined with statistical analysis to discriminate the geographical origin of Chinese, Indian, and Korean sesame oils [17]. Four different geographical origins ofLycium barbarum fruit (China, Mongolia, and two locations in Tibet) were discriminated using liquid chromatography coupled with quadrupole time-of-flight mass spectrometry for metabolite profiling [18]. Near-infrared reflectance (NIR) spectroscopy has been used to discriminate Korean soybeans from soybeans of various origins [19].
We chose FT-IR spectroscopy for the present study because it is a fast, convenient, and non-destructive analytical tool. These characteristics make FT-IR spectroscopy suitable for the rapid identification of foods and agricultural products [20]. However, the physical characteris-tics of samples (particle size and thickness) affect the obtained FT-IR spectra [21,22], and so the obtained raw data need to be normalized. Four normalization methods can be applied to FT-IR spectral data: area normalization, amide normalization, minimum-maximum (min-max) normalization, and vector normalization. Constructing more-precise prediction models for the discrimination of Chinese and Korean soybeans requires suitable normalization and scaling methods to be determined, and then a prediction model selected by comparing the pre-dictive power of each cutoff for the variable influence on projection (VIP).
NMR spectroscopy has previously been used to discriminate between soybeans originating from China and Korea [23], while NIR spectroscopy was used to discriminate Korean soy-beans and soysoy-beans of various origins [19]. However, the present study is the first to investi-gate a prediction model that can discriminate between Chinese and Korean soybeans using Korea (NRF-2015R1A5A1008958 awarded to
HKC). The funders had no role in study design, data collection and analysis, decision to publish, or preparation of the manuscript.
Competing interests: The authors have declared
FT-IR spectroscopy combined with scaling methods, optimal normalization methods, the selection of an appropriate wave-number region, and a VIP cutoff value.
Materials and methods
Soybean materials and sample preparation
As shown inFig 1, 21 soybean samples collected from Korea (8 samples) and China (13 sam-ples) were prepared for analysis by FT-IR spectroscopy. Korean soybeans were obtained from the National Agricultural Products Quality Management Service (Fig 2,S1 Table), and Chinese soybeans were obtained from a Chinese market (Fig 3,S1 Table). The 8 Korean soybean sam-ples had been cultivated in Gyeonggi-do Anseong, Gangwon-do Yeongwol, Chungcheong-buk-do Eumseong, Chungcheongnam-do Cheonan, JeollaChungcheong-buk-do Imsil, Jeollanam-do Yeonggwang, Gyeongsangbuk-do Uiseong, and Gyeongsangnam-do Geochang. The 13 Chi-nese soybean samples were obtained from Neimenggu, Heilongjiang, Jilin, Liaoning, Hebei, Shandong, Anhui, Hubei, Zhejiang, Jiangxi, Fujian, Guangdong, and Guangxi. The provinces, cities, and geographic coordinates of soybean samples were listed inS1 Table. Ten individual soybeans were randomly selected for each region, frozen rapidly in liquid nitrogen, ground into a fine powder using a mixer, and stored at−80˚C before further analysis.
FT-IR spectroscopy analysis and spectral data preprocessing
Soybean powder was loaded onto an FT-IR spectrometer (NICOLET iS50, Thermo Fisher Sci-entific, Kyoto, Japan) equipped with an attenuated total reflection (ATR) accessory for
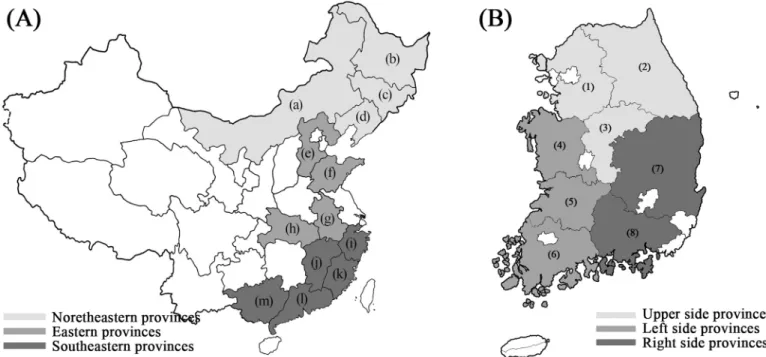
Fig 1. Map showing the origin of the Chinese and Korean soybeans used in the experiments. (A) Map of China. The Chinese provinces were divided into three
regions: northeastern, eastern, and southeastern. The northeastern region comprises four provinces: (a) Neimenggu, (b) Heilongjiang, (c) Jilin, and (d) Liaoning. The eastern region comprises four provinces: (e) Hebei, (f) Shandong, (g) Anhui, and (h) Hubei. The southeastern region comprises five provinces: (i) Zhejiang, (j) Jiangxi, (k) Fujian, (l) Guangdong, and (m) Guangxi. (B) Map of South Korea. The South Korean provinces were divided into three regions: upper, left side, and right side. The upper region comprises three provinces: (1) Gyeonggi-do, (2) Gangwon-do, and (3) Chungcheongbuk-do. The left-side region comprises three provinces: (4) Chungcheongnam-do, (5) Jeollabuk-do, (6) and Jeollanam-do. The right-side region comprises two provinces: (7) Gyeongsangbuk-do and (8) Gyeongsangnam-do.
recording the FT-IR spectra. The OMNIC program (version 8.2.0.387, Thermo Scientific, Wal-tham, Massachusetts, USA) was used to obtain all of the FT-IR spectra. Sixty-four scans were recorded in order to obtain average analytical results and enhance the signal-to-noise ratio. Each spectrum was scanned between 4000 and 400 cm–1and had a spectral resolution of 4 cm–1.
The following four normalization methods that are widely used in FT-IR spectroscopy anal-ysis were used to process the FT-IR spectra: area normalization, min-max normalization, amide normalization, and vector normalization. In vector normalization, all spectra are con-verted from transmittance to absorbance, and the FT-IR absorbance spectra were concon-verted into first and second derivatives using the Savitzky-Golay derivative with nine smoothing points in OMNIC. For vector normalization, the absorbance values of FT-IR spectral data were divided by the Euclidean norm to calculate the vector normalization value. For the other normalization processes, all spectra were converted from transmittance to absorbance, and then ATR correction was applied using OMNIC. For area normalization, each absorbance value at a specific wave number was divided by the total (integrated) absorbance area of the spectrum. For min-max normalization, each absorbance value was divided by the difference between the highest and lowest absorbance values. For amide normalization, each absorbance value was divided by the difference between the highest amide band and the lowest absorbance value.
Multivariate statistical analysis
After the FT-IR spectral data had been normalized, we used the SIMCA-P+ software (version 13.0, Umetrics, Umeå, Sweden) to carry out multivariate statistical analysis. Partial-least-squares discriminant analysis (PLS-DA), partial-least-Partial-least-squares regression (PLSR), and hierar-chical cluster analysis (HCA) were conducted using SIMCA-P+. Both the single linkage method and Ward’s clustering method were employed to carry out HCA. Cross-validation and permutation tests were applied to the PLS-DA and PLSR models. Cross-validation was performed to evaluate the predictability of the models and to prevent overfitting. The models were evaluated using the R2Y and Q2Y parameters as obtained by cross-validation. Permuta-tion tests were conducted 20 times using SIMCA-P+. PermutaPermuta-tion test parameters such as the R2Y and Q2Y intercepts were obtained to evaluate the statistical significance of the models.
Results and discussion
Band assignment of the FT-IR spectra
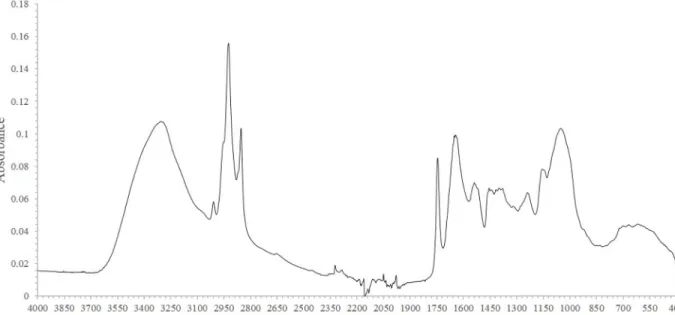
FT-IR spectral data were obtained for each soybean sample. A representative FT-IR spectrum —from the sample from Inner Mongolia Autonomous Region province in China—is shown in Fig 4, which contained 12 noticeable bands that could be assigned as follows (Table 1): 1. One at 3304 cm–1due to N-H protein stretching [24].
2. One at 3009 cm–1due to C = H stretching of unsaturated lipids [25]. 3. One at 2925 cm–1due to asymmetric C-H stretching of lipids [26]. 4. One at 2854 cm–1due to symmetric C-H stretching of lipids [26]. 5. One at 1745 cm–1due to C = O stretching of lipids [27].
6. One at 1645 cm–1due to C-O and C-N protein stretching [24]. This is known as the amide I band and is the main amide band.
7. One at 1538 cm–1due to C-N stretching and N-H bending modes of protein. This is known as the amide II band [24].
8. One at 1456 cm–1due to CH2bending of lipids [26].
9. One at 1398 cm–1due to CH3bending of protein and COO−symmetric stretching of fatty
acids and amino acids [25,28].
10. One at 1239 cm–1, which is the amide III band that contains contributions from PO2– asymmetric stretching [28].
11. One at 1155 cm–1due to CO-O-C asymmetric stretching of cholesterol ester and C-O stretching of oligosaccharides and triacylglycerols [25,29].
12. One at 1051 cm–1due to C-O stretching of starch [30].
In addition to the bands arising from soybean components, three bands arising from the environment were detected. The tiny band between 4000 and 3500 cm–1is attributable to water-vapor O-H stretching, and the other two bands correspond to carbon dioxide: O-C-O stretching at 2442–2208 cm–1and O-C-O bending at 914–400 cm–1[31]. As listed inTable 1 and shown inFig 1, the peaks associated with lipids (2925, 2854, 1745, and 1456 cm–1) and proteins (3304, 1645, 1538, and 1239 cm–1) could be clearly discriminated.
Fig 2. Morphological characteristics of the eight Korean soybean samples. (1) Gyeonggi-do Anseong, (2) Gangwon-do
Yeongwol, (3) Chungcheongbuk-do Eumseong, (4) Chungcheongnam-do Cheonan, (5) Jeollabuk-do Imsil, (6) Jeollanam-do Yeonggwang, (7) Gyeongsangbuk-do Uiseong, and (8) Gyeongsangnam-do Geochang. https://doi.org/10.1371/journal.pone.0196315.g002
Determination of normalization and scaling methods
To determine the optimal normalization and scaling methods, permutation tests were carried out using two components. The normalization methods used were area normalization, amide normalization, min-max normalization, and vector normalization. Two types of scaling meth-ods were employed: unit variance (UV) and Pareto scaling.
Fig 3. Morphological characteristics of the 13 Chinese soybean samples.
https://doi.org/10.1371/journal.pone.0196315.g003
Fig 4. Representative FT-IR spectral data of soybeans from Neimenggu province.
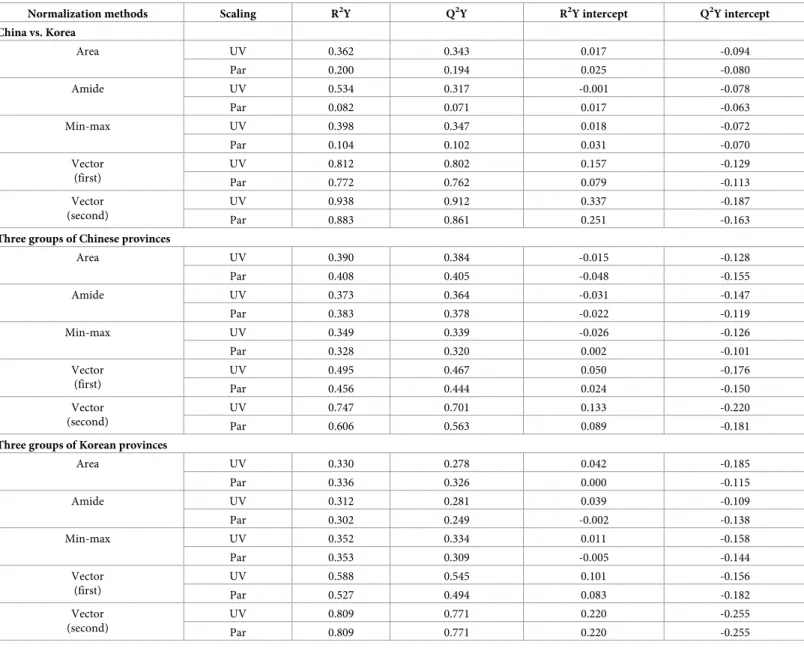
The permutation parameters of the PLS-DA models are listed inTable 2. The R2Y and Q2Y values, which indicate the model fit and predictability, respectively, range between 0 and 1.0. A PLS-DA model with a high R2Y value is regarded as providing a good fit to the data. A Q2Y value from 0.5 to 0.9 indicates good predictability, while one greater than 0.9 is considered to indicate excellent predictability. Permutation tests were performed to obtain the R2Y and Q2Y intercepts. The models were regarded as valid when the R2Y and Q2Y intercepts were less than 0.4 and 0.05, respectively [32].
The optimal PLS-DA models were selected after comparing the R2Y and Q2Y values. The optimal normalization and scaling methods for the model involved applying vector normaliza-tion after the second differentianormaliza-tion and UV scaling methods. The results are presented in Table 2, which indicates that this procedure yielded highest R2Y and Q2Y values of 0.938 and 0.912, respectively, for the comparison between Chinese and Korean soybean samples, of 0.747 and 0.701 for the comparison of Chinese soybean samples, and of 0.809 and 0.771 for the com-parison of Korean soybean samples.
Table 2indicates that both the R2Y and Q2Y values were highest when using the vector nor-malization method, which is possibly due to the derivative process used in vector normaliza-tion revealing minute differences between similar spectra [33]. This hypothesis is supported by the use of second derivatives allowing better discrimination of the minute differences in the FT-IR spectra compared to using first derivatives.
Development of a PLSR model for determining the origin of soybeans
using appropriate wave-number selection
PLSR can be employed to construct a prediction model for the origin of soybeans. Soybean-origin PLSR models were developed by applying suitable vector normalization after a second differentiation and UV scaling, and using two components. Apart from normalization, scaling
Table 1. FT-IR spectrum band assignments of soybeans cultivated in Neimenggu province. Wavenumber
(cm-1)
Vibration Suggested biomolecular assignment Reference
4000–3500 O-H stretching H2O [31]
3304 N-H stretching Amide A (protein) [24]
N-H and O-H stretching Polysaccharides, proteins [26]
3009 C = H stretching Unsaturated lipids [25]
2925 C-H stretching (asym) Lipids (mainly), proteins, carbohydrates [26] 2854 C-H stretching (sym) Lipids (mainly), proteins, carbohydrates [26]
2442–2208 O-C-O stretching CO2 [31]
1745 C = O stretching Lipids [27]
1645 C-O, C-N stretching Amide I (protein) [24]
1538 C-N stretching, N-H bending Amide II (protein) [24]
1456 CH2bending Lipids [26]
1398 CH3bending Proteins [28]
COO-stretching (sym) Fatty acids, amino acids [25]
1239 PO2-stretching (asym) Amide III [28]
1155 CO-O-C stretching (asym) Cholesterol ester [25]
C-O stretching Oligosaccharides, triacylglycerols [29]
1051 PO2-stretching (sym) Nucleic acids [28]
C-O stretching Starch [30]
914–600 O-C-O bending CO2 [31]
methods, and the number of components, the VIP cutoff value was used to establish the most-precise prediction model. Training sets (six replicates) and a test set (one replicate) were pre-pared to construct the PLSR models. Both sets were used to obtain root-mean-square error (RMSE) values, including the mean-square error of estimation (RMSEE) and the root-mean-square error of prediction (RMSEP). RMSEE can be obtained from training sets, and its value is used to evaluate the accuracy of a PLSR model. RMSEP, which can be obtained from the test set, is employed to assess the predictability of PLSR models. These RMSE values range from 0 to 1, with smaller values indicating higher model accuracy and predictability.
Because FT-IR spectra may be affected by environmental factors such as water vapor and carbon dioxide, PLSR models constructed using different wave-number regions were
Table 2. Selection of PLS-DA models according to various normalization and scaling methods for the differentiation of soybean samples.
Normalization methods Scaling R2Y Q2Y R2Y intercept Q2Y intercept
China vs. Korea Area UV 0.362 0.343 0.017 -0.094 Par 0.200 0.194 0.025 -0.080 Amide UV 0.534 0.317 -0.001 -0.078 Par 0.082 0.071 0.017 -0.063 Min-max UV 0.398 0.347 0.018 -0.072 Par 0.104 0.102 0.031 -0.070 Vector (first) UV 0.812 0.802 0.157 -0.129 Par 0.772 0.762 0.079 -0.113 Vector (second) UV 0.938 0.912 0.337 -0.187 Par 0.883 0.861 0.251 -0.163
Three groups of Chinese provinces
Area UV 0.390 0.384 -0.015 -0.128 Par 0.408 0.405 -0.048 -0.155 Amide UV 0.373 0.364 -0.031 -0.147 Par 0.383 0.378 -0.022 -0.119 Min-max UV 0.349 0.339 -0.026 -0.126 Par 0.328 0.320 0.002 -0.101 Vector (first) UV 0.495 0.467 0.050 -0.176 Par 0.456 0.444 0.024 -0.150 Vector (second) UV 0.747 0.701 0.133 -0.220 Par 0.606 0.563 0.089 -0.181
Three groups of Korean provinces
Area UV 0.330 0.278 0.042 -0.185 Par 0.336 0.326 0.000 -0.115 Amide UV 0.312 0.281 0.039 -0.109 Par 0.302 0.249 -0.002 -0.138 Min-max UV 0.352 0.334 0.011 -0.158 Par 0.353 0.309 -0.005 -0.144 Vector (first) UV 0.588 0.545 0.101 -0.156 Par 0.527 0.494 0.083 -0.182 Vector (second) UV 0.809 0.771 0.220 -0.255 Par 0.809 0.771 0.220 -0.255
Two components were used to analyze in all PLS-DA models. The Chinese provinces are the northeastern, eastern, and southeastern regions. Korean provinces are the upper, left-side, and right-side regions. PLS-DA: partial least square discrimination analysis, UV: unit variance, and Par: Pareto.
compared to identify the best prediction model. Three wave-number regions were used to obtain prediction models: 4000–400 cm–1, 4000–400 cm–1excluding the water vapor and car-bon dioxide regions, and 2000–400 cm–1.
As listed in Tables3–5, numerous VIP cutoff values were used to select better prediction models based on the RMSEP values. The permutation parameters of the PLSR models for com-paring Chinese and Korean soybeans are listed inTable 3, while those for comparisons of Chi-nese soybeans and of Korean soybeans are listed in Tables4and5, respectively.
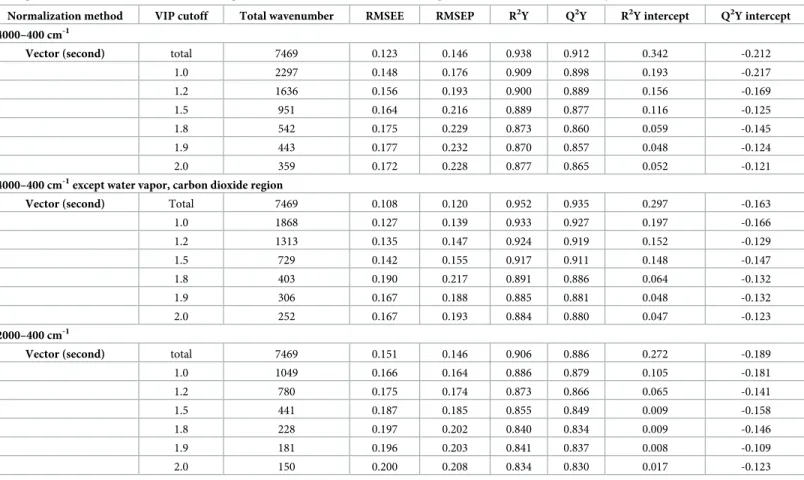
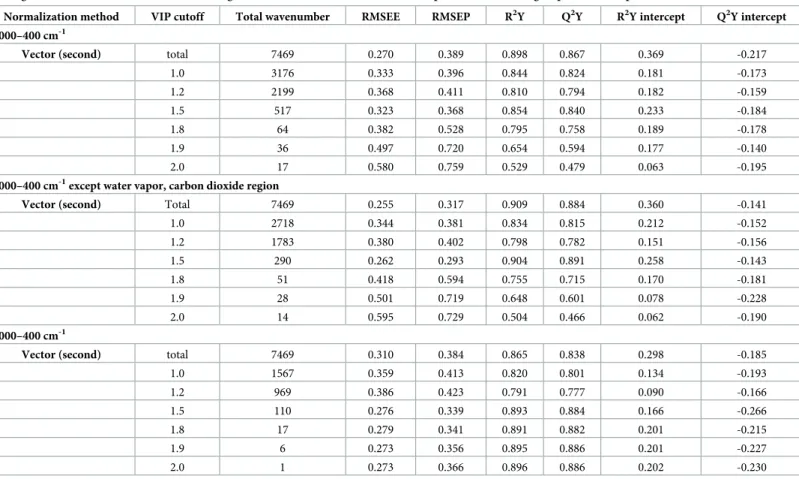
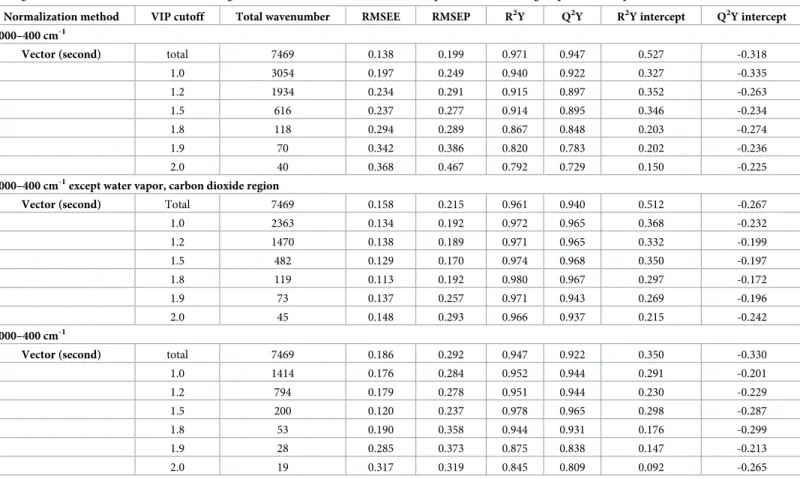
The PLSR models were compared to identify the PLSR models that satisfied the R2Y and Q2Y intercepts and had the lowest RMSEP values. The FT-IR spectral region between 4000 and 400 cm–1that excluded the water vapor and carbon dioxide regions was the best. The PLSR model that did not apply a VIP cutoff value was selected for the prediction model pre-sented inTable 3for discriminating Chinese and Korean soybeans because it had the smallest RMSEP value (= 0.120).Table 4indicates that the PLSR model with a VIP cutoff value of 1.5 was the optimal prediction model for discriminating Chinese soybeans, having an RMSEP value of 0.293, whileTable 5indicates that the PLSR model for discriminating Korean soy-beans had the lowest RMSEP value of 0.170 for a VIP cutoff value of 1.5.
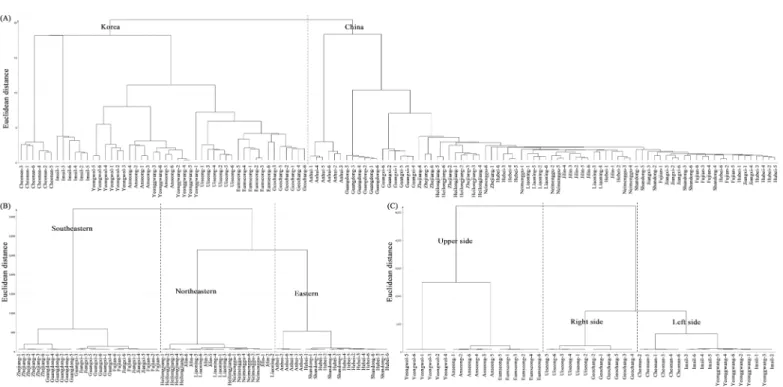
HCA dendrograms were constructed to evaluate the similarity of the samples using the optimal PLSR models for discriminating the soybean samples. As shown inFig 5A, the Chi-nese and Korean soybean samples could be clearly discriminated using the single linkage
Table 3. List of permutation parameters of the PLSR models obtained using variables selected by vector normalization applied after the second differentiation, UV scaling, and with various VIP cutoff values using different wavenumber areas for the comparison of Chinese and Korean soybeans.
Normalization method VIP cutoff Total wavenumber RMSEE RMSEP R2Y Q2Y R2Y intercept Q2Y intercept 4000–400 cm-1
Vector (second) total 7469 0.123 0.146 0.938 0.912 0.342 -0.212
1.0 2297 0.148 0.176 0.909 0.898 0.193 -0.217 1.2 1636 0.156 0.193 0.900 0.889 0.156 -0.169 1.5 951 0.164 0.216 0.889 0.877 0.116 -0.125 1.8 542 0.175 0.229 0.873 0.860 0.059 -0.145 1.9 443 0.177 0.232 0.870 0.857 0.048 -0.124 2.0 359 0.172 0.228 0.877 0.865 0.052 -0.121
4000–400 cm-1except water vapor, carbon dioxide region
Vector (second) Total 7469 0.108 0.120 0.952 0.935 0.297 -0.163
1.0 1868 0.127 0.139 0.933 0.927 0.197 -0.166 1.2 1313 0.135 0.147 0.924 0.919 0.152 -0.129 1.5 729 0.142 0.155 0.917 0.911 0.148 -0.147 1.8 403 0.190 0.217 0.891 0.886 0.064 -0.132 1.9 306 0.167 0.188 0.885 0.881 0.048 -0.132 2.0 252 0.167 0.193 0.884 0.880 0.047 -0.123 2000–400 cm-1
Vector (second) total 7469 0.151 0.146 0.906 0.886 0.272 -0.189
1.0 1049 0.166 0.164 0.886 0.879 0.105 -0.181 1.2 780 0.175 0.174 0.873 0.866 0.065 -0.141 1.5 441 0.187 0.185 0.855 0.849 0.009 -0.158 1.8 228 0.197 0.202 0.840 0.834 0.009 -0.146 1.9 181 0.196 0.203 0.841 0.837 0.008 -0.109 2.0 150 0.200 0.208 0.834 0.830 0.017 -0.123
Two components were used to analyze in all PLSR models. VIP: variable influence on projection. UV: unit variance. https://doi.org/10.1371/journal.pone.0196315.t003
method.Fig 5Bshows that the soybean samples from the northeastern and eastern provinces of Chinese were clustered in the same clade using Ward’s method, whereas those from the southeastern provinces comprised the other clade. As shown inFig 5C, three regions (upper, right side, and left side) were clustered using Ward’s method. Because the soybeans from the right- and left-side provinces appeared to be similar, the Korean provinces could be simply divided into upper and lower provinces. This result suggests that Chinese and Korean soybean samples can be discriminated by latitude-dependent climatic factors without consideration of the plant variety.
Practical application of the PLSR model for predicting the origin of
soybeans
The results presented in Tables3–5indicate that it is not only possible to discriminate between Chinese and Korean soybeans but also to identify the region in which soybeans have been cul-tivated. There is a wide diversity of soybean varieties used in China and Korea, but the present results indicate that it is possible to determine the origin of soybeans without considering their variety.
Our results indicate that it is possible to discriminate where soybeans originate from because they reflect regional characteristics. The soybean samples from China could be divided
Table 4. List of permutation parameters of the PLSR models obtained using variables selected by vector normalization applied after the second differentiation, UV scaling, and with various VIP cutoff values using different wavenumber areas for the comparison of the three groups of Chinese provinces.
Normalization method VIP cutoff Total wavenumber RMSEE RMSEP R2Y Q2Y R2Y intercept Q2Y intercept 4000–400 cm-1
Vector (second) total 7469 0.270 0.389 0.898 0.867 0.369 -0.217
1.0 3176 0.333 0.396 0.844 0.824 0.181 -0.173 1.2 2199 0.368 0.411 0.810 0.794 0.182 -0.159 1.5 517 0.323 0.368 0.854 0.840 0.233 -0.184 1.8 64 0.382 0.528 0.795 0.758 0.189 -0.178 1.9 36 0.497 0.720 0.654 0.594 0.177 -0.140 2.0 17 0.580 0.759 0.529 0.479 0.063 -0.195
4000–400 cm-1except water vapor, carbon dioxide region
Vector (second) Total 7469 0.255 0.317 0.909 0.884 0.360 -0.141
1.0 2718 0.344 0.381 0.834 0.815 0.212 -0.152 1.2 1783 0.380 0.402 0.798 0.782 0.151 -0.156 1.5 290 0.262 0.293 0.904 0.891 0.258 -0.143 1.8 51 0.418 0.594 0.755 0.715 0.170 -0.181 1.9 28 0.501 0.719 0.648 0.601 0.078 -0.228 2.0 14 0.595 0.729 0.504 0.466 0.062 -0.190 2000–400 cm-1
Vector (second) total 7469 0.310 0.384 0.865 0.838 0.298 -0.185
1.0 1567 0.359 0.413 0.820 0.801 0.134 -0.193 1.2 969 0.386 0.423 0.791 0.777 0.090 -0.166 1.5 110 0.276 0.339 0.893 0.884 0.166 -0.266 1.8 17 0.279 0.341 0.891 0.882 0.201 -0.215 1.9 6 0.273 0.356 0.895 0.886 0.201 -0.227 2.0 1 0.273 0.366 0.896 0.886 0.202 -0.230
Two components were used to analyze in all PLSR models. The Chinese provinces are grouped into northeastern, eastern, and southeastern regions. VIP: variable influence on projection. UV: unit variance.
into those from the northeastern provinces (Neimenggu, Heilongjiang, Jilin, and Liaoning), Huang-Huai-Hai (Hebei, Shandong, and Anhui), Yangtze River (Hubei), and the southeastern provinces (Zhejiang, Jiangxi, Fujian, Guangdong, and Guangxi). If Huang-Huai-Hai and the Yangtze River region are considered to be the same province (due to their geographical prox-imity), the separations of the Chinese provinces are highly consistent with the predictions based on dividing the soybean regions into the northeastern, eastern, and southeastern prov-inces. The samples from South Korea were divided into those from the central provinces (Gyeonggi-do, Gangwon-do, Chungcheongbuk-do, and Chungcheongnam-do), Honam prov-inces (Jeollabuk-do and Jeollanam-do), and Youngnam provprov-inces (Gyeongsangbuk-do and Gyeongsangnam-do). The results inTable 5indicate that it was possible to separate three prov-inces (upper, left side, and right side) if Chungcheongnam-do (a central province) was
grouped with Honam province.
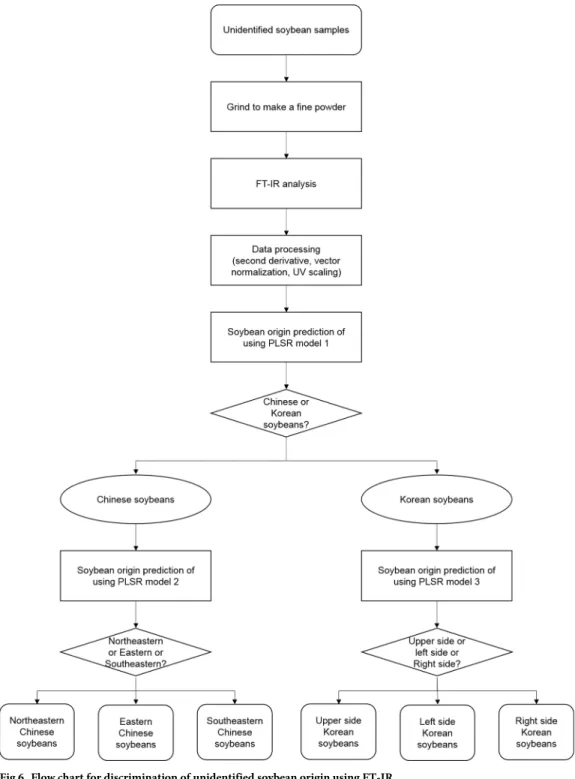
The flow chart inFig 6shows a method for discriminating the country of origin using pre-diction models when identifying unknown soybean samples. It is unclear where some of the soybeans available in Korean markets originate from, often because they are substituted by cheaper Chinese soybeans. The present results indicate that the flow chart inFig 6can be used to verify the origin of any suspect soybeans. Moreover, in addition to discriminating between Chinese and Korean soybeans, it is possible to discriminate between various production
Table 5. List of permutation parameters of the PLSR models obtained using variables selected by vector normalization applied after the second differentiation, UV scaling, and with various VIP cutoff values using different wavenumber areas for the comparison of the three groups of Korean provinces.
Normalization method VIP cutoff Total wavenumber RMSEE RMSEP R2Y Q2Y R2Y intercept Q2Y intercept 4000–400 cm-1
Vector (second) total 7469 0.138 0.199 0.971 0.947 0.527 -0.318
1.0 3054 0.197 0.249 0.940 0.922 0.327 -0.335 1.2 1934 0.234 0.291 0.915 0.897 0.352 -0.263 1.5 616 0.237 0.277 0.914 0.895 0.346 -0.234 1.8 118 0.294 0.289 0.867 0.848 0.203 -0.274 1.9 70 0.342 0.386 0.820 0.783 0.202 -0.236 2.0 40 0.368 0.467 0.792 0.729 0.150 -0.225
4000–400 cm-1except water vapor, carbon dioxide region
Vector (second) Total 7469 0.158 0.215 0.961 0.940 0.512 -0.267
1.0 2363 0.134 0.192 0.972 0.965 0.368 -0.232 1.2 1470 0.138 0.189 0.971 0.965 0.332 -0.199 1.5 482 0.129 0.170 0.974 0.968 0.350 -0.197 1.8 119 0.113 0.192 0.980 0.967 0.297 -0.172 1.9 73 0.137 0.257 0.971 0.943 0.269 -0.196 2.0 45 0.148 0.293 0.966 0.937 0.215 -0.242 2000–400 cm-1
Vector (second) total 7469 0.186 0.292 0.947 0.922 0.350 -0.330
1.0 1414 0.176 0.284 0.952 0.944 0.291 -0.201 1.2 794 0.179 0.278 0.951 0.944 0.230 -0.229 1.5 200 0.120 0.237 0.978 0.965 0.298 -0.287 1.8 53 0.190 0.358 0.944 0.931 0.176 -0.299 1.9 28 0.285 0.373 0.875 0.838 0.147 -0.213 2.0 19 0.317 0.319 0.845 0.809 0.092 -0.265
Two components were used to analyze in all PLSR models. The Korean provinces are grouped into upper, left-side, right-side regions. VIP: variable influence on projection. UV: unit variance.
regions in a single country. Our flow chart can be applied to identify the original location of cultivation and detect the adulteration of the cultivation origin of soybeans.
Conclusion
In this study we investigated whether FT-IR spectroscopy analysis can be combined with mul-tivariate statistical analysis to predict the country of origin of soybean samples. This is the first study to discriminate the origin of soybeans using various factors including scaling methods, normalization methods, VIP cutoff, and wave-number region. These particular factors were selected since they allow the origin of soybeans to be determined easily and precisely. Our experimental results showed that this method could discriminate not only the country of ori-gin but also the region of production within a country. The best PLSR prediction models for discriminating the origins employed UV scaling, vector normalization (second derivative), and the wave-number region from 4000 to 400 cm–1excluding the water vapor and carbon dioxide regions. The PLSR prediction model for discriminating the country of origin (Chinese vs. Korean soybeans) was more precise when a VIP cutoff was not used. When the PLSR pre-diction models were constructed using a VIP cutoff within a single country, a VIP cutoff value of 1.5 was found to be optimal for discriminating the origin of soybeans.
Various soybean varieties and landraces are provided and grown worldwide according to the demands of both growers and consumers. Soybean cultivars reportedly have a short market life; for example, 54% of the cultivars submitted to the Varietal Information Program for Soy-beans (the program supported by the Illinois Soybean Association of the US) are new [34]. In addition, various types of soybean seed are utilized in the production of products such as meal, tofu, soymilk, and edamame, and these seeds can exhibit various differences such as in their texture, color, and hilum characteristics. It is also thought that soybean germ plasm has been exchanged internationally. Therefore, PLSR models for predicting or differentiating soybean
Fig 5. Hierarchical cluster analysis derived from the most suitable prediction models for the discrimination of soybean samples. (A) Chinese vs. Korean
soybean samples (single linkage), (B) discrimination of Chinese soybean samples (Ward), and (C) discrimination of Korean soybean samples (Ward). https://doi.org/10.1371/journal.pone.0196315.g005
samples should be updated regularly (at least every 4–5 years) by sampling and analyzing the available samples using FT-IR spectroscopy. We suggest the application of additional objective criteria for the differentiation of various soybean seeds (varieties and landraces), such as the basic and novel protocols for differentiation and prediction as used in this study based on the optimization of preprocessing methods using FT-IR spectroscopy.
Fig 6. Flow chart for discrimination of unidentified soybean origin using FT-IR.
The practical application of these methods will require further studies using soybean sam-ples from other countries. Once soybeans from many countries have been investigated, it might be possible to discriminate the countries of origin of unidentified soybean samples by using FT-IR spectroscopy combined with multivariate statistical analysis.
Supporting information
S1 Table. The provinces, cities, and geographic coordinates of soybean samples harvested in 2016 from Republic of Korea and China.
(DOCX)
Author Contributions
Conceptualization: Hyung-Kyoon Choi. Data curation: Byeong-Ju Lee.
Formal analysis: Byeong-Ju Lee.
Funding acquisition: Hyung-Kyoon Choi.
Investigation: Byeong-Ju Lee, Yaoyao Zhou, Jae Soung Lee. Methodology: Byeong-Ju Lee.
Project administration: Hyung-Kyoon Choi. Resources: Byeong-Ju Lee, Byeung Kon Shin. Software: Byeong-Ju Lee.
Supervision: Hyung-Kyoon Choi.
Validation: Jeong-Ah Seo, Doyup Lee, Young-Suk Kim. Visualization: Byeong-Ju Lee.
Writing – original draft: Byeong-Ju Lee, Hyung-Kyoon Choi. Writing – review & editing: Hyung-Kyoon Choi.
References
1. Mateos-Aparicio I, Redondo Cuenca A, Villanueva-Sua´rez MJ, Zapata-Revilla MA. Soybean, a promis-ing health source. Nutr Hosp. 2008; 23: 305–312. PMID:18604315
2. Albulescu M, Popovici M. Isoflavones-biochemistry, pharmacology and therapeutic use. Rev Roum Chim. 2007; 52: 537–550.
3. Anthony MS, Clarkson TB, Hughes CL Jr, Morgan TM, Burke GL. Soybean isoflavones improve cardio-vascular risk factors without affecting the reproductive system of peripubertal rhesus monkeys. J Nutr. 1996; 126: 43–50.https://doi.org/10.1093/jn/126.1.43PMID:8558324
4. Anderson JW, Smith BM, Washnock CS. Cardiovascular and renal benefits of dry bean and soybean intake. Am J Clin Nutr. 1999; 70: 464s–474s. PMID:10479219
5. Ravindranath MH, Muthugounder S, Presser N, Viswanathan S. Anticancer therapeutic potential of soy isoflavone, genistein. Adv Exp Med Biol. 2004; 546: 121–165. PMID:15584372
6. Rayaprolu SJ, Hettiarachchy NS, Horax R, Phillips GK, Mahendran M, Chen P. Soybean peptide frac-tions inhibit human blood, breast and prostate cancer cell proliferation. J Food Sci Technol. 2017; 54: 38–44.https://doi.org/10.1007/s13197-016-2426-2PMID:28242901
7. Sarkar FH, Li Y. Mechanisms of cancer chemoprevention by soy isoflavone genistein. Cancer Metasta-sis Rev. 2002; 21: 265–280. PMID:12549765
8. Mori M, Aizawa T, Tokoro M, Miki T, Yamori Y. Soy isoflavone tablets reduce osteoporosis risk factors and obesity in middle-aged Japanese women. Clin Exp Pharmacol Physiol. 2004; 31: S44–S46.https:// doi.org/10.1111/j.1440-1681.2004.04118.xPMID:15649287
9. Taku K, Melby MK, Nishi N, Omori T, Kurzer MS. Soy isoflavones for osteoporosis: an evidence-based approach. Maturitas. 2011; 70: 333–338.https://doi.org/10.1016/j.maturitas.2011.09.001PMID:
21958941
10. Lee SW. The historical review of traditional Korea fermented foods. J Korean Soc Food Cult. 1988; 3: 331–339.
11. National agricultural products quality management service [Internet].http://www.naqs.go.kr/eng/ contents/COOL/COOL/A_01.naqs, 2017.
12. National agricultural products quality management service [Internet].http://www.naqs.go.kr/eng/ contents/COOL/COOL/A_02.naqs, 2017.
13. Li R, Dong W, He H, Yan H, Jiang X, Gong J. Isolation, characterization and phase transformation of new ginsenoside compound k hydrate and methanol solvates. Cryst Res Technol. 2012; 47: 377–384.
14. Fiehn O. Metabolomics—the link between genotypes and phenotypes. Plant Mol Biol. 2002; 48: 155– 171. PMID:11860207
15. Dunn WB, Ellis DI. Metabolomics: current analytical platforms and methodologies. Trends Anal Chem. 2005; 24: 285–294.
16. Luo D, Chen J, Gao L, Liu Y, Wu J. Geographical origin identification and quality control of Chinese chrysanthemum flower teas using gas chromatography–mass spectrometry and olfactometry and elec-tronic nose combined with principal component analysis. Int J Food Sci Technol. 2017; 52: 714–723.
17. Jin G, Kim J, Lee Y, Kim J, Akoh CC, Chun HS, et al. A nuclear magnetic resonance spectroscopy approach to discriminate the geographic origin of roasted Asian sesame oils. J Oleo Sci. 2017; 66: 337– 344.https://doi.org/10.5650/jos.ess16154PMID:28239058
18. Bondia-Pons I, Savolainen O, To¨rro¨nen R, Martinez JA, Poutanen K, Hanhineva K. Metabolic profiling of Goji berry extracts for discrimination of geographical origin by non-targeted liquid chromatography coupled to quadrupole time-of-flight mass spectrometry. Food Res Int. 2014; 63: 132–138.
19. Ahn HG, Kim YH. Discrimination of Korean domestic and foreign soybeans using near infrared reflec-tance spectroscopy. Korean J Crop Sci. 2012; 57: 296–300.
20. Van de Voort FR. Fourier transform infrared spectroscopy applied to food analysis. Food Res Int. 1992; 25: 397–403.
21. Zhao X, Zhu H, Chen J, Ao Q. FTIR, XRD and SEM analysis of ginger powders with different size. J Food Process Preserv. 2015; 39: 2017–2026.
22. Filik J, Frogley MD, Pijanka JK, Wehbe K, Cinque G. Electric field standing wave artefacts in FTIR micro-spectroscopy of biological materials. Analyst. 2012; 137: 853–861.https://doi.org/10.1039/ c2an15995cPMID:22231204
23. Kim MH, Rho JH, Lee CH. The geographical discrimination of Korean and Chinese soybeans (Glycine max (L.) merrill) using NMR relaxation methods. Korean J Food Sci Technol. 2009; 41: 292–295. 24. Kong J, Yu S. Fourier transform infrared spectroscopic analysis of protein secondary structures. Acta
Biochim Biophys Sin (Shanghai). 2007; 39: 549–559.
25. Staniszewska-Slezak E, Fedorowicz A, Kramkowski K, Leszczynska A, Chlopicki S, Baranska M, et al. Plasma biomarkers of pulmonary hypertension identified by fourier transform infrared spectroscopy and principal component analysis. Analyst. 2015; 140: 2273–2279.https://doi.org/10.1039/c4an01864h
PMID:25599976
26. Garip S, Gozen AC, Severcan F. Use of fourier transform infrared spectroscopy for rapid comparative analysis of Bacillus and Micrococcus isolates. Food Chem. 2009; 113: 1301–1307.
27. Liu J, Mukherjee J, Hawkes JJ, Wilkinson SJ. Optimization of lipid production for algal biodiesel in nitro-gen stressed cells of Dunaliella salina using FTIR analysis. J Chem Technol Biotechnol. 2013; 88: 1807–1814.
28. Li SY, Zou DH, Luo YW, Sun QR, Deng KF, Chen YJ, et al. Characteristics of electrically injured skin from human hand tissue samples using fourier transform infrared microspectroscopy. Sci Justice. 2014; 54: 98–104.https://doi.org/10.1016/j.scijus.2013.07.005PMID:24438785
29. Ordoudi SA, de los Mozos Pascual M, Tsimidou MZ. On the quality control of traded saffron by means of transmission fourier-transform mid-infrared (FT-MIR) spectroscopy and chemometrics. Food Chem. 2014; 150: 414–421.https://doi.org/10.1016/j.foodchem.2013.11.014PMID:24360470
30. Lammers K, Arbuckle-Keil G, Dighton J. FT-IR study of the changes in carbohydrate chemistry of three New Jersey pine barrens leaf litters during simulated control burning. Soil Biol Biochem. 2009; 41: 340– 347.
31. Bruun SW, Kohler A, Adt I, Sockalingum GD, Manfait M, Martens H. Correcting attenuated total reflec-tion–fourier transform infrared spectra for water vapor and carbon dioxide. Appl Spectrosc. 2006; 60: 1029–1039.https://doi.org/10.1366/000370206778397371PMID:17002829
32. Eriksson L, Byrne T, Johansson E, Trygg J, Vikstro¨m C. Multi-and megavariate data analysis basic prin-ciples and applications. 3rd ed. Umetrics Academy; 2013.
33. Owen AJ. Uses of derivative spectroscopy. Agilent Technologies. 1995.
34. Chawla S, Bowen CR, Slaminko TL, Hobbs HA, Hartman GL. A public program to evaluate commercial soybean cultivars for pathogen and pest resistance. Plant Disease 2013; 97: 568–578.

![Table 2 indicates that both the R 2 Y and Q 2 Y values were highest when using the vector nor- nor-malization method, which is possibly due to the derivative process used in vector normaliza-tion revealing minute differences between similar spectra [ 33 ]](https://thumb-ap.123doks.com/thumbv2/123dokinfo/5081617.74596/7.918.54.874.132.524/indicates-malization-possibly-derivative-normaliza-revealing-differences-spectra.webp)