ARTICLE www.msletters.org | Mass Spectrometry Letters
Correlation between the Content and Pharmacokinetics of Ginsenosides from
Four Different Preparation of Panax Ginseng C.A. Meyer in Rats
Ji-Hyeon Jeon
1, Jaehyeok Lee
1, Chul Haeng Lee
2, Min-Koo Choi
2*,
and Im-Sook Song
1*
1BK21 FOUR Community-Based Intelligent Novel Drug Discovery Education Unit, Vessel-Organ Interaction Research Center (VOICE), Research Institute of Pharmaceutical Sciences, College of Pharmacy, Kyungpook National University, Daegu, 41566, Korea
2College of Pharmacy, Dankook University, Cheon-an, 31116, Korea
Received Feburary 25, 2021; Revised March 17, 2021; Accepted March 22, 2021 First published on the web March 31, 2021; DOI: 10.5478/MSL.2021.12.1.16
Abstract : We aimed to compare the content of ginsenosides and the pharmacokinetics after the oral administration of four dif-ferent ginseng products at a dose of 1 g/kg in rats. The four difdif-ferent ginseng products were fresh ginseng extract, red ginseng extract, white ginseng extract, and saponin enriched white ginseng extract prepared from the radix of Panax ginseng C.A. Meyer. The ginsenoside concentrations in the ginseng product and the rat plasma samples were determined using a liquid chromatogra-phy-tandem mass spectrometry (LC-MS/MS). Eight or nine ginsenosides of the 15 tested ginsenosides were detected; however, the content and total ginsenosides varied depending on the preparation method. Moreover, the content of triglycosylated ginse-nosides was higher than that of diglycosylated ginseginse-nosides, and deglycosylated ginseginse-nosides were not present in any prepara-tion. After the single oral administrations of four different ginseng products in rats, only four ginsenosides, such as 20(S)-ginsenosides Rb1 (GRb1), GRb2, GRc, and GRd, were detected in the rat plasma samples among the 15 20(S)-ginsenosides tested. The plasma concentrations of GRb1, GRb2, GRc, and GRd were different depends on the preparation method but pharmacoki-netic features of the four ginseng products were similar. In conclusion, a good correlation between the area under the concentra-tion curve and the content of GRb1, GRb2, and GRc, but not GRd, in the ginseng products was identified and it might be the result of their higher content and intestinal biotransformation of the ginseng product.
Keywords : ginseng product preparation, LC-MS/MS, ginsenoside content, pharmacokinetics
Introduction
Ginseng, Panax ginseng C.A. Meyer (Araliaceae), has been one of the most popular herbal medicines in the world for > 2000 years; it is especially popular in East Asian countries, including Korea, China, and Japan.1,2 Ginsenosides, also called steroid-like saponins, are considered as the major active pharmacological constituents of ginseng.1,3 Ginseng and its associated ginsenosides are reported to exert antineoplastic, antihypertensive, antidiabetic, inflammatory, anti-oxidative, anti-allergic, neuroprotective, hepatoprotective, and immunologic effects.3-6 In addition to their therapeutic
effects, ginseng products are frequently administered as health supplements with therapeutic drugs, such as anticancer drugs and anti-diabetes drugs, and for fatigue and physical performance.7
Therefore, the market for ginseng products has rapidly grown, and ginseng products include fresh ginseng, white ginseng product, and red ginseng extracts and others. These ginseng products are processed via steaming, drying, extraction with water or ethanol, and concentration and these processes lead to biochemical transformations in the constituent peptides, ginsenosides, polysaccharides, fatty acids, and polyacetylenic alcohols.8 Thus, the content of ginsenosides may vary during these processes.
Therefore, we aimed to analyze the content of ginsenosides in the ginseng products prepared from different process and to investigate the pharmacokinetics of ginsenosides after oral administration of these ginseng products to rats at a dose of 1 g/kg.
Experimental
Chemicals and reagents
Ginseng products were obtained from Punggi Ginseng Cooperative Association (Youngjoo, Kyungpook, Korea).
*Reprint requests to Min-Koo Choi, and Im-Sook Song E-mail: [email protected] and [email protected] All MS Letters content is Open Access, meaning it is accessible online to everyone, without fee and authors’ permission. All MS Letters content is published and distributed under the terms of the Creative Commons Attribution License (http://creativecommons.org /licenses/by/3.0/). Under this license, authors reserve the copyright for their content; however, they permit anyone to unrestrictedly use, distribute, and reproduce the content in any medium as far as the original authors and source are cited. For any reuse, redistribution, or reproduction of a work, users must clarify the license terms under which the work was produced.
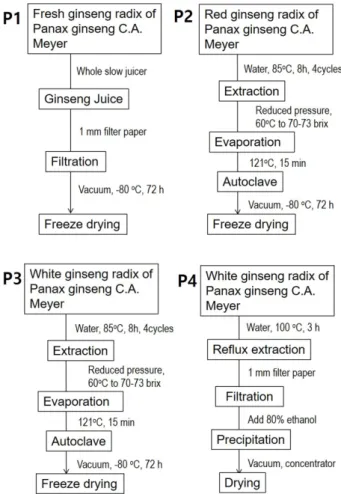
The preparation scheme for the four different ginseng products, including fresh ginseng extract, red ginseng extract, white ginseng extract, and saponin enriched white ginseng extract are shown in Figure 1. 20(S)-ginsenosides Rb1 (GRb1), GRb2, GRc, GRd, GRg1, GRg3, GRe, GRh1, GF1, GF2, compound K (CK), 20(S)-proptopanaxadiol (PPD), and 20(S)-protopanaxatriol (PPT) were purchased from the Ambo Institute (Daejeon, Korea). Berberine and 13C-caffeine were used as internal standards (IS) and were purchased from Sigma–Aldrich Chemical Co. (St. Louis, MO, USA). All the other chemicals and solvents were of reagent or analytical grade.
Pharmacokinetic study
All animal procedures were approved by the Animal Care and Use Committee of Kyungpook National University (Approval No. KNU 2018-0077 and KNU 2019-0005) and carried out in accordance with the National Institutes of Health guidelines for the care and use of laboratory animals.
The male Sprague Dawley rats (7–8 week old, weighing 225–270 g) were purchased from the Samtako (Osan, Kyungi-do, Korea). After their arrival, the rats were housed with a 12 h light/dark cycle; food and water were supplied ad libitum for 1 wk. The rats were made to fast for 16 h; however, free access to water was given before the pharmacokinetic experiments. Four ginseng products (Figure 1) were suspended with distilled water (1 g/kg/ 2 mL) and administered to the rats using oral gavage at a dose of 1 g/kg. Blood samples were withdrawn from the cannulated femoral artery at 0.25, 0.5, 1, 2, 4, 8, and 24 h after the administration of ginseng products. Blood samples were centrifuged at 16000 rpm for 1 min, and aliquots (30 µL) of plasma samples were stored at -80oC until the analysis of ginsenosides.
LC-MS/MS analysis of ginsenosides
The concentrations of ginsenosides were analyzed using a modified liquid chromatography-tandem mass spectrometry (LC-MS/MS) method9-11 using an Agilent 6470 triple quadrupole LC-MS/MS system (Agilent, Wilmington, DE, USA). In order to analyze GRb1, GRb2, GRc, GRd, GRe, GRf, GRg1, GRg3, GF1, and GF2, 200 µL of an IS (0.05 ng/mL berberine in methanol) was added to 30 µL of plasma samples. Thereafter, the mixture was vortexed for 15 min and centrifuged at 16,000 × g for 5 min. After centrifugation, 200 µL of the supernatant was transferred to a clean tube and evaporated to dryness under nitrogen stream at 40oC. The residue was reconstituted using 100 µL of 70% methanol supplemented with 0.1% formic acid, and a 10 µL aliquot was injected into the LC-MS/MS system. The ginsenosides were separated on a Polar RP column (150 × 2.0 mm, 4.0 µm particle size) with mobile phase comprising 0.1% formic acid in water (phase A) and 0.1% formic acid in methanol (phase B) at a flow rate of
0.27 mL/min. The gradient elution was used: 69% of phase B for 0–2.0 min, 69%–85% of phase B for 2.0–4.0 min, 85%–69% of phase B for 6.0–6.5 min.
To analyze GRh1, GRh2, CK, PPD, and PPT, 30 µL of an IS (20 ng/mL 13C-caffeine in water) and 400 µL of methyl tert-butyl ether was added to 30 µL of plasma samples. The mixture was vortexed for 10 min and then centrifuged at 16,000 × g for 5 min. After centrifugation, the samples were frozen at -80oC for 4 h. Next, the upper layer was transferred to a clean tube and evaporated to dryness under a nitrogen stream. The residue was reconstituted with 100 µL of 80% methanol supplemented with 0.1% formic acid, and a 10-µL aliquot was injected into the LC-MS/MS system. Ginsenosides were separated on a Luna C18 column (150 × 2.0 mm, 3.0 µm particle size) with mobile phase consisting of 0.1% formic acid in water (8%) and 0.1% formic acid in methanol (92%) at a flow rate of 0.15 mL/min.
The ginsenoside content in the RGE was quantified in a similar manner. The ginseng product (100 mg) was diluted
Figure 1. The preparation scheme for four different ginseng products prepared from the radix of Panax ginseng C.A. Meyer. P1, fresh ginseng extract; P2, red ginseng extract; P3, white ginseng extract; P4, saponin enriched white ginseng extract.
100-fold with 80% methanol, and 30 µL of the diluted sample was prepared using the method described previously. Aliquots (10 µL) of the supernatant were directly injected into the LC-MS/MS system.
Quantification was performed using multiple reaction monitoring in positive ion mode, and the details are shown in Table 1. The standard calibration curve for the mixture of 15 ginsenosides was linear in the concentration range of 0.5–200 ng/mL for the plasma samples, and the inter-day and intra-day precision and accuracy for ginsenosides was < 15%.
Data Analysis
The pharmacokinetic parameters were determined with non-compartmental analysis (WinNonlin® 2.0; Pharsight, Mountain View, CA, USA).6 All data are expressed as mean ± standard deviation values.
Results and Discussion
Ginsenosides content in four ginseng product
The ginseng product prepared from the radix of Panax ginseng C.A. Meyer contained eight or nine ginsenosides of the 15 tested ginsenosides (Table 2). The ginsenoside content varies as per the preparation method of ginseng product, such as steaming, extraction, and drying; each affect the composition of the final ginseng product.12 In red
ginseng extract and white ginseng, the sum of PPD-type ginsenosides was higher that the sum of PPT-type ginsenosides, consistent with that in previous reports.7,13 However, the fresh ginseng and saponon enriched white ginseng extract showed a higher sum of PPT-type ginsenosides than that of PPD-type. The results suggested that steaming and extraction with water may increase the content of PPD-type ginsenosides. Among them, triglycosylated ginsenosides, such as GRb1, GRb2, GRc, and GRd were present in the highest content compared with the diglycosylated ginsenosides. Likewise, triglycosylated PPT-type ginsenosides, such as GRe and GRg1, showed higher content than diglycosylated ginsenosides. In all ginseng products, mono-glycosylated or deglycosylated ginsenosides that need enzymatic deglycosylation from tri-or diglycosylates were not detected (Table 2).7
Plasma concentrations of ginsenosides in rats
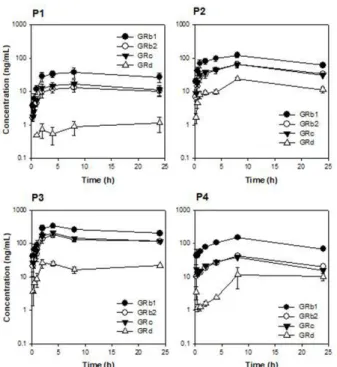
The plasma concentrations of ginsenosides after oral administration of four ginseng products in rats are shown in Figure 2, and the relevant pharmacokinetic parameters are presented in Table 3. After the single oral administration of the four different ginseng product in rats, only four ginsenosides were detected in the rat plasma samples among the 15 ginsenosides that were tested, which is consistent with the human case.10 As shown in Figure 2,
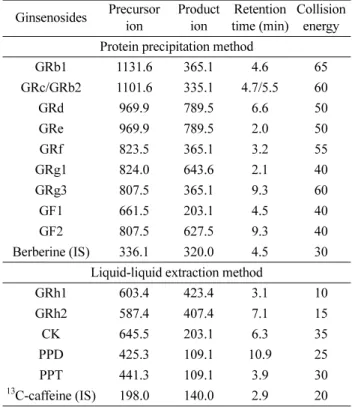
Table 1. MS/MS parameters for the detection of the ginsenosides and IS prepared from protein precipitation and liquid-liquid extraction method. Ginsenosides Precursor ion Product ion Retention time (min) Collision energy Protein precipitation method
GRb1 1131.6 365.1 4.6 65 GRc/GRb2 1101.6 335.1 4.7/5.5 60 GRd 969.9 789.5 6.6 50 GRe 969.9 789.5 2.0 50 GRf 823.5 365.1 3.2 55 GRg1 824.0 643.6 2.1 40 GRg3 807.5 365.1 9.3 60 GF1 661.5 203.1 4.5 40 GF2 807.5 627.5 9.3 40 Berberine (IS) 336.1 320.0 4.5 30
Liquid-liquid extraction method
GRh1 603.4 423.4 3.1 10 GRh2 587.4 407.4 7.1 15 CK 645.5 203.1 6.3 35 PPD 425.3 109.1 10.9 25 PPT 441.3 109.1 3.9 30 13C-caffeine (IS) 198.0 140.0 2.9 20
Table 2. Content of ginsenosides in the four ginseng products. Ginsenoside content (mg/g extract)
P1 P2 P3 P4 PPD-type GRb1 1.4 ± 0.1 2.4 ±0.2 5.7 ± 0.04 1.6 ± 0.0 GRb2 0.7 ± 0.02 1.6 ± 0.06 3.7 ± 0.06 0.5 ± 0.0 GRc 0.5 ± 0.01 1.1 ± 0.04 2.7 ± 0.06 0.4 ± 0.0 GRd 0.1 ± 0.0 0.7 ± 0.02 0.9 ± 0.05 0.07 ± 0.0 GRh2 ND ND ND ND GRg3 0.1 ± 0.0 1.2 ± 0.02 0.9 ± 0.01 0.2 ± 0.0 GF2 ND ND ND ND CK ND ND ND ND PPD ND ND ND ND Sum 2.7 8.2 13.9 2.8 PPT-type GRe 1.5 ± 0.07 1.8 ± 0.06 2.8 ± 0.05 0.6 ± 0.2 GRf 0.3 ± 0.0 0.8 ± 0.02 0.8 ± 0.01 ND GRh1 ND 0.9 ± 0.03 0.2 ± 0.0 0.9 ± 0.08 GRg1 1.7 ± 0.09 1.6 ± 0.01 3.7 ± 0.07 4.7 ± 0.5 GF1 ND ND ND ND PPT ND ND ND ND Sum 3.6 5.1 7.5 6.2
P1, Fresh ginseng extract; P2, Red ginseng extract; P3, White ginseng extract; P4, Saponin enriched white ginseng extract; ND, not detected
GRb1, GRb2, GRc, and GRd in rat plasma were all found in the four ginseng products, and their plasma concentration profiles in rats were similar. That is, GRb1 had the highest concentration and GRd had the lowest concentration. Moreover, the plasma concetration of these four ginsenosides were maintained stably for 24 h, limiting the calculation of elimination half-life.
However, other PPD-type ginsenosides were not detected in the rat plasma samples after single administration of the ginseng product. In other studies after repeated oral administration of red ginseng extract, GRg3, CK, and PPD were detected in mice, rats, and humans.9-11 Although the content of PPT-type ginsenosides was comparable or lower than that of PPD-type ginsenosides, none of the PPT-type ginsenosides were detected in the rat plasma samples in this study. With repeated oral administration of red ginseng extract, only GRe was detected in mice, and PPT was detected in rats and humans.9,11 This could be attributed to the limited intestinal absorption or faster metabolism and elimination of PPT-type ginsenosides than in PPD-PPT-type ginsenosides.11,14
Then, we compared the plasma concentrations of GRb1, GRb2, GRc, and GRd with their content in ginseng products. Correlation analyses on the pharmacokinetic parameters of GRb1, GRb2, GRc, and GRd revealed a
good correlation between the AUC values and the content of GRb1, GRb2, and GRc, but not GRd in ginseng product (Figure 3). In our previous results, the fecal recovery of
Figure 2. Plasma concentration-time profile of the ginsenoside GRb1, GRb2, GRc, and GRd after an oral administration of four ginseng products (1 g/kg) in rats. P1, Fresh ginseng extract; P2, Red ginseng extract; P3, White ginseng extract; P4, Saponin enriched white ginseng extract. Each data point represents the mean ± standard deviation (n = 4).
Table 3. Pharmacokinetic parameters of ginsenoside GRb1, GRb2, GRc, and GRd in rats. Tmax (h) Cmax (ng/mL) AUC (ng·h/mL) MRT (h) P1 GRb1 5.6 ± 1.0 39.2 ± 12 751.6 ± 236 11.6 ± 0.1 GRb2 7.2 ± 0.8 13.3 ± 3.6 271.6 ± 75.7 11.8 ± 0.2 GRc 6.4 ± 1.0 17.7 ± 5.1 335.5 ± 103 11.2 ± 0.3 GRd 17 ± 3.9 1.3 ± 0.5 19.93 ± 10.0 13.9 ± 1.7 P2 GRb1 8.0 ± 0.0 123 ± 19 2223 ± 319 10.6 ± 0.2 GRb2 8.0 ± 0.0 66.7 ± 16 1152 ± 249 11.1 ± 0.3 GRc 8.0 ± 0.0 65.2 ± 9.3 1137 ± 132 10.7 ± 0.3 GRd 8.0 ± 0.0 24.6 ± 2.6 389.6 ± 45.7 11.0 ± 0.5 P3 GRb1 2.6 ± 0.6 360 ± 54 5839 ± 577 11.3 ± 0.5 GRb2 3.4 ± 0.6 189 ± 26 3082 ± 315 11.8 ± 0.5 GRc 2.6 ± 0.6 221 ± 32 3360 ± 351 11.3 ± 0.4 GRd 3.0 ± 0.5 34.5 ± 4.7 470.1 ± 34.9 12.9 ± 0.9 P4 GRb1 6.4 ± 1.5 162 ± 14 2619 ± 205 10.4 ± 0.1 GRb2 6.4 ± 1.5 45.8 ± 5.5 725.8 ± 80.9 10.8 ± 0.2 GRc 6.4 ± 1.5 47.2 ± 5.3 666.9 ± 47.2 10.0 ± 0.2 GRd 13 ± 4.7 17.8 ± 6.1 212.5 ± 62.7 15.6± 2.1 P1, Fresh ginseng extract; P2, Red ginseng extract; P3, White ginseng extract; P4, Saponin enriched white ginseng extract; Cmax: maximum plasma concentration; Tmax: time to reach Cmax ; AUC: area under the plasma concentration-time curve; MRT: mean residence time.
Data expressed as mean± standard deviation (n = 4).
Figure 3. Correlation between the ginsenoside content and the area under the plasma concentration curve (AUC) of ginsenosides after oral administration of four ginseng products (1 g/kg) in rats. The data are taken from Table 2 and 3.
GRb1, GRb2, and GRc was < 10% of the oral intake; however, GRd was ~291% of the oral intake.11 It suggested that GRb1, GRb2, and GRc were transformed into GRd; thus, the plasma concentrations of GRd could be higher than the content of GRd in the ginseng product. The results suggested that the pharmacokinetic properties of various ginsenosides, including GRb1, GRb2, GRc, and GRd could be determined by the composition of ginseng product as well as the intestinal biotransformation of ginsenosides. Therefore, researchers should be careful when selecting the ginseng product to explore the pharmacology and therapeutic effect of ginseng with a specific focus on the individual ginsenosides.
Conclusions
In this study, we investigated and compared the content of individual ginsenosides from four different ginseng products prepared from the radix of Panax ginseng C.A. Meyer with the pharmacokinetics after oral administration of these products. The major ginsenosides found in the plasma were GRb1, GRb2, GRc, and GRd, which are present in the highest content in ginseng products. Consequently, the good correlation between the AUC values and the content of GRb1, GRb2, and GRc, but not GRd, in the ginseng product might be the result of their higher concentration in the ginseng product and intestinal biotransformation process from GRb1, GRb2, and GRc to GRd. A strategy to increase the ginsenoside content of interest in the ginseng product or to modulate the metabolic biotransformation may improve the plasma ginsenoside concentrations and therapeutic response of the ginseng product.
Acknowledgments
This work was supported by the National Research Foundation of Korea (NRF) grant funded by the Korea government (MSIT) (No. NRF-2020R1I1A3074384 and NRF-2020R1A5A2017323).
References
1. Ru, W.; Wang, D.; Xu, Y.; He, X.; Sun, Y.E.; Qian, L.; Zhou, X.; Qin, Y. Drug Discov. Ther. 2015, 9, 23, DOI: 10.5582/ddt.2015.01004.
2. Lee, C. H.; Kim, J. H. J. Ginseng Res. 2014, 38, 161, DOI: 10.1016/j.jgr.2014.03.001.
3. Kim, J. H.; Yi, Y. S.; Kim, M. Y.; Cho, J. Y. J. Ginseng Res. 2017, 41, 435, DOI: 10.1016/j.jgr.2016.08.004. 4. Yun, T. K.; Choi, S. Y.; Yun, H. Y. J. Korean Med. Sci.
2001, 16, S19, DOI: 10.3346/jkms.2001.16.S.S19. 5. Gui, Q. F.; Xu, Z. R.; Xu, K. Y.; Yang, Y. M. Medicine
2016, 95, e2584, DOI: 10.1097/MD.0000000000002584. 6. Park, T. Y.; Hong, M.; Sung, H.; Kim, S.; Suk, K. T. J.
Ginseng Res. 2017, 41, 450, DOI: 10.1016/j.jgr.2016.11.004. 7. Choi, M. K.; Song, I. S. Arch. Pharm. Res. 2019, 42, 862,
DOI: 10.1007/s12272-019-01184-3.
8. Lee, S. M.; Bae, B. S.; Park, H. W.; Ahn, N. G.; Cho, B. G.; Cho, Y. L.; Kwak, Y. S. J. Ginseng Res. 2015, 39, 384, DOI: 10.1016/j.jgr.2015.04.009.
9. Jin, S.; Jeon, J. H.; Lee, S.; Kang, W. Y.; Seong, S. J.; Yoon, Y. R.; Choi, M. K.; Song, I. S. Molecules 2019, 24, 2618, DOI: 10.3390/molecules24142618.
10. Choi, M. K.; Jin, S.; Jeon, J. H.; Kang, W. Y.; Seong, S. J.; Yoon, Y. R.; Han, Y. H.; Song, I. S. J. Ginseng Res. 2020, 44, 229, DOI: 10.1016/j.jgr.2018.10.006.
11. Jeon, J. H.; Lee, J.; Choi, M. K.; Song, I. S. Arch. Pharm. Res. 2020, 43, 1335, DOI: 10.1007/s12272-020-01289-0. 12. Choi, I. D.; Ryu, J. H.; Lee, D. E.; Lee, M. H.; Shim, J. J.;
Ahn, Y. T.; Sim, J. H.; Huh, C. S.; Shim, W. S.; Yim, S. V.; Chung, E. K.; Lee, K. T. Evid.-Based Complement Alternat. Med. 2016, 2016, 3908142, DOI: 10.1155/2016/ 3908142.
13. Chen, C. F.; Chiou, W. F.; Zhang, J. T. Acta Pharmacol. Sin. 2008, 29, 1103, DOI: 10.1111/j.1745-7254.2008.00868.x. 14. Jiang, R.; Dong, J.; Li, X.; Du, F.; Jia, W.; Xu, F.; Wang, F.; Yang, J.; Niu, W.; Li, C. Br. J. Pharmacol. 2015, 172, 1059, DOI: 10.1111/bph.12971.