저작자표시-비영리-변경금지 2.0 대한민국 이용자는 아래의 조건을 따르는 경우에 한하여 자유롭게 l 이 저작물을 복제, 배포, 전송, 전시, 공연 및 방송할 수 있습니다. 다음과 같은 조건을 따라야 합니다: l 귀하는, 이 저작물의 재이용이나 배포의 경우, 이 저작물에 적용된 이용허락조건 을 명확하게 나타내어야 합니다. l 저작권자로부터 별도의 허가를 받으면 이러한 조건들은 적용되지 않습니다. 저작권법에 따른 이용자의 권리는 위의 내용에 의하여 영향을 받지 않습니다. 이것은 이용허락규약(Legal Code)을 이해하기 쉽게 요약한 것입니다. Disclaimer 저작자표시. 귀하는 원저작자를 표시하여야 합니다. 비영리. 귀하는 이 저작물을 영리 목적으로 이용할 수 없습니다. 변경금지. 귀하는 이 저작물을 개작, 변형 또는 가공할 수 없습니다.
Doctoral Thesis in Medicine
Tumor response according to peripheral blood
lymphocyte subpopulation trend during
preoperative chemoradiotherapy in locally
advanced rectal cancer
Ajou University Graduate School
Radiation Oncology Major
Tumor response according to peripheral blood
lymphocyte subpopulation trend during
preoperative chemoradiotherapy in locally
advanced rectal cancer
Young-Taek Oh, Advisor
I submit this thesis as the Doctoral thesis in Medicine.
February, 2017
Ajou University Graduate School
Radiation Oncology Major
The Doctoral thesis of Jaesung Heo in Medicine is hereby approved.
Thesis Defense Committee President Mison Chun
Seal
Member
Young-Taek Oh
Seal
Member
O Kyu Noh
Seal
Member
Seung Yeop Oh
Seal
Member
Won Park
Seal
Ajou University Graduate School
-ABSTRACT-Tumor response according to peripheral blood lymphocyte subpopulation trend during preoperative chemoradiotherapy in locally advanced rectal cancer
Background: The aim of this prospective study was to evaluate the association between lymphocyte subpopulation counts in the blood during preoperative chemoradiotherapy (CRT) and tumor response in rectal cancer.
Methods: From August 2015 to June 2016, 10 patients satisfying criteria for prospective study were enrolled. Patients received conventional radiotherapy with fluorouracil-based chemotherapy and surgery was performed at 4 to 8 weeks after end of preoperative CRT. The lymphocyte subpopulation was obtained prior to and after 4 weeks of preoperative CRT. We analyzed the relationship between a tumor response and host immunity such as lymphocyte subpopulation during preoperative CRT.
Results: Among 10 patients, 2 (20%) had evidence of pathologic complete response. In 8 patients with clinically node positive, 4 (50%) had nodal tumor response. All lymphocyte subpopulation counts at 4 weeks after CRT were significantly lower than lymphocyte count observed during pretreatment (p < 0.01). A high decrease in NK cell count during CRT (baseline cell count − cell count at 4 weeks) was associated with node down staging (p = 0.034). Conclusions: Our results suggest that the change of lymphocyte subset to preoperative CRT may be a predictive factor for tumor response in rectal cancer.
TABLE OF CONTENTS
ABSTRACT ‧‧‧‧‧‧‧‧‧‧‧‧‧‧‧‧‧‧‧‧‧‧‧‧‧‧‧‧‧‧‧‧‧‧‧‧‧‧‧‧‧‧‧‧‧‧‧‧‧‧‧‧‧‧‧‧‧‧‧‧‧‧‧‧‧‧‧‧‧‧‧‧‧‧‧‧‧‧‧‧‧‧‧‧‧‧‧‧‧‧‧‧‧‧‧‧‧‧‧‧‧‧‧‧‧‧‧‧ i TABLE OF CONTENTS ‧‧‧‧‧‧‧‧‧‧‧‧‧‧‧‧‧‧‧‧‧‧‧‧‧‧‧‧‧‧‧‧‧‧‧‧‧‧‧‧‧‧‧‧‧‧‧‧‧‧‧‧‧‧‧‧‧‧‧‧‧‧‧‧‧‧‧‧‧‧‧‧‧‧‧‧‧‧‧‧‧‧‧‧‧‧‧‧‧ ii LIST OF FIGURES ‧‧‧‧‧‧‧‧‧‧‧‧‧‧‧‧‧‧‧‧‧‧‧‧‧‧‧‧‧‧‧‧‧‧‧‧‧‧‧‧‧‧‧‧‧‧‧‧‧‧‧‧‧‧‧‧‧‧‧‧‧‧‧‧‧‧‧‧‧‧‧‧‧‧‧‧‧‧‧‧‧‧‧‧‧‧‧‧‧‧‧‧‧‧‧‧ iii LIST OF TABLES ‧‧‧‧‧‧‧‧‧‧‧‧‧‧‧‧‧‧‧‧‧‧‧‧‧‧‧‧‧‧‧‧‧‧‧‧‧‧‧‧‧‧‧‧‧‧‧‧‧‧‧‧‧‧‧‧‧‧‧‧‧‧‧‧‧‧‧‧‧‧‧‧‧‧‧‧‧‧‧‧‧‧‧‧‧‧‧‧‧‧‧‧‧‧‧‧‧‧ iv LIST OF TEXT I. INTRODUCTION ‧‧‧‧‧‧‧‧‧‧‧‧‧‧‧‧‧‧‧‧‧‧‧‧‧‧‧‧‧‧‧‧‧‧‧‧‧‧‧‧‧‧‧‧‧‧‧‧‧‧‧‧‧‧‧‧‧‧‧‧‧‧‧‧‧‧‧‧‧‧‧‧‧‧‧‧‧‧‧‧‧‧‧‧‧‧‧‧‧‧‧ 1 II. METHODS ‧‧‧‧‧‧‧‧‧‧‧‧‧‧‧‧‧‧‧‧‧‧‧‧‧‧‧‧‧‧‧‧‧‧‧‧‧‧‧‧‧‧‧‧‧‧‧‧‧‧‧‧‧‧‧‧‧‧‧‧‧‧‧‧‧‧‧‧‧‧‧‧‧‧‧‧‧‧‧‧‧‧‧‧‧‧‧‧‧‧‧‧‧‧‧‧‧‧‧‧‧ 3 A. Patients ‧‧‧‧‧‧‧‧‧‧‧‧‧‧‧‧‧‧‧‧‧‧‧‧‧‧‧‧‧‧‧‧‧‧‧‧‧‧‧‧‧‧‧‧‧‧‧‧‧‧‧‧‧‧‧‧‧‧‧‧‧‧‧‧‧‧‧‧‧‧‧‧‧‧‧‧‧‧‧‧‧‧‧‧‧‧‧‧‧‧‧‧‧‧‧‧‧‧‧‧ 3 B. Treatments ‧‧‧‧‧‧‧‧‧‧‧‧‧‧‧‧‧‧‧‧‧‧‧‧‧‧‧‧‧‧‧‧‧‧‧‧‧‧‧‧‧‧‧‧‧‧‧‧‧‧‧‧‧‧‧‧‧‧‧‧‧‧‧‧‧‧‧‧‧‧‧‧‧‧‧‧‧‧‧‧‧‧‧‧‧‧‧‧‧‧‧‧‧‧‧ 3 C. Flow cytometry ‧‧‧‧‧‧‧‧‧‧‧‧‧‧‧‧‧‧‧‧‧‧‧‧‧‧‧‧‧‧‧‧‧‧‧‧‧‧‧‧‧‧‧‧‧‧‧‧‧‧‧‧‧‧‧‧‧‧‧‧‧‧‧‧‧‧‧‧‧‧‧‧‧‧‧‧‧‧‧‧‧‧‧‧‧‧‧ 4 D. Statistics ‧‧‧‧‧‧‧‧‧‧‧‧‧‧‧‧‧‧‧‧‧‧‧‧‧‧‧‧‧‧‧‧‧‧‧‧‧‧‧‧‧‧‧‧‧‧‧‧‧‧‧‧‧‧‧‧‧‧‧‧‧‧‧‧‧‧‧‧‧‧‧‧‧‧‧‧‧‧‧‧‧‧‧‧‧‧‧‧‧‧‧‧‧‧‧ 4 III. RESULTS ‧‧‧‧‧‧‧‧‧‧‧‧‧‧‧‧‧‧‧‧‧‧‧‧‧‧‧‧‧‧‧‧‧‧‧‧‧‧‧‧‧‧‧‧‧‧‧‧‧‧‧‧‧‧‧‧‧‧‧‧‧‧‧‧‧‧‧‧‧‧‧‧‧‧‧‧‧‧‧‧‧‧‧‧‧‧‧‧‧‧‧‧‧‧‧‧‧ 6 IV. DISCUSSION ‧‧‧‧‧‧‧‧‧‧‧‧‧‧‧‧‧‧‧‧‧‧‧‧‧‧‧‧‧‧‧‧‧‧‧‧‧‧‧‧‧‧‧‧‧‧‧‧‧‧‧‧‧‧‧‧‧‧‧‧‧‧‧‧‧‧‧‧‧‧‧‧‧‧‧‧‧‧‧‧‧‧‧‧‧‧‧‧‧‧‧‧‧‧‧ 16 V. CONCLUSION ‧‧‧‧‧‧‧‧‧‧‧‧‧‧‧‧‧‧‧‧‧‧‧‧‧‧‧‧‧‧‧‧‧‧‧‧‧‧‧‧‧‧‧‧‧‧‧‧‧‧‧‧‧‧‧‧‧‧‧‧‧‧‧‧‧‧‧‧‧‧‧‧‧‧‧‧‧‧‧‧‧‧‧‧‧‧‧‧‧‧‧‧‧‧‧ 22 REFERENCE ‧‧‧‧‧‧‧‧‧‧‧‧‧‧‧‧‧‧‧‧‧‧‧‧‧‧‧‧‧‧‧‧‧‧‧‧‧‧‧‧‧‧‧‧‧‧‧‧‧‧‧‧‧‧‧‧‧‧‧‧‧‧‧‧‧‧‧‧‧‧‧‧‧‧‧‧‧‧‧‧‧‧‧‧‧‧‧‧‧‧‧‧‧‧‧‧‧‧‧‧‧‧‧‧‧‧ 23 국문요약 ‧‧‧‧‧‧‧‧‧‧‧‧‧‧‧‧‧‧‧‧‧‧‧‧‧‧‧‧‧‧‧‧‧‧‧‧‧‧‧‧‧‧‧‧‧‧‧‧‧‧‧‧‧‧‧‧‧‧‧‧‧‧‧‧‧‧‧‧‧‧‧‧‧‧‧‧‧‧‧‧‧‧‧‧‧‧‧‧‧‧‧‧‧‧‧‧‧‧‧‧‧‧‧‧‧‧‧‧‧‧‧‧‧ 27
LIST OF FIGURES
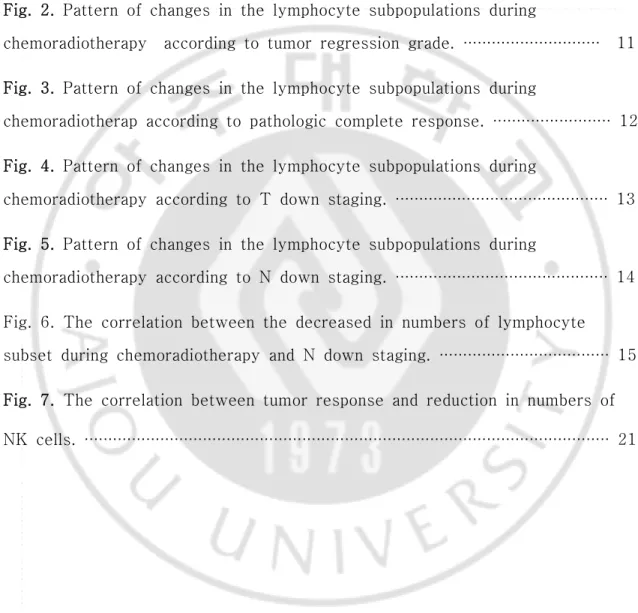
Fig. 1. Changes in the lymphocyte subpopulations between baseline and 4weeks after the start of treatment. ‧‧‧‧‧‧‧‧‧‧‧‧‧‧‧‧‧‧‧‧‧‧‧‧‧‧‧‧‧‧‧‧‧‧‧‧‧‧‧‧‧‧‧‧‧‧‧‧‧‧‧‧‧‧‧‧‧‧‧‧‧‧‧‧‧‧‧‧‧‧‧‧‧‧‧‧‧‧ 9 Fig. 2. Pattern of changes in the lymphocyte subpopulations during
chemoradiotherapy according to tumor regression grade. ‧‧‧‧‧‧‧‧‧‧‧‧‧‧‧‧‧‧‧‧‧‧‧‧‧‧‧‧‧ 11 Fig. 3. Pattern of changes in the lymphocyte subpopulations during
chemoradiotherap according to pathologic complete response. ‧‧‧‧‧‧‧‧‧‧‧‧‧‧‧‧‧‧‧‧‧‧‧‧‧ 12 Fig. 4. Pattern of changes in the lymphocyte subpopulations during
chemoradiotherapy according to T down staging. ‧‧‧‧‧‧‧‧‧‧‧‧‧‧‧‧‧‧‧‧‧‧‧‧‧‧‧‧‧‧‧‧‧‧‧‧‧‧‧‧‧‧‧‧‧ 13 Fig. 5. Pattern of changes in the lymphocyte subpopulations during
chemoradiotherapy according to N down staging. ‧‧‧‧‧‧‧‧‧‧‧‧‧‧‧‧‧‧‧‧‧‧‧‧‧‧‧‧‧‧‧‧‧‧‧‧‧‧‧‧‧‧‧‧‧ 14 Fig. 6. The correlation between the decreased in numbers of lymphocyte subset during chemoradiotherapy and N down staging. ‧‧‧‧‧‧‧‧‧‧‧‧‧‧‧‧‧‧‧‧‧‧‧‧‧‧‧‧‧‧‧‧‧‧‧‧ 15 Fig. 7. The correlation between tumor response and reduction in numbers of NK cells. ‧‧‧‧‧‧‧‧‧‧‧‧‧‧‧‧‧‧‧‧‧‧‧‧‧‧‧‧‧‧‧‧‧‧‧‧‧‧‧‧‧‧‧‧‧‧‧‧‧‧‧‧‧‧‧‧‧‧‧‧‧‧‧‧‧‧‧‧‧‧‧‧‧‧‧‧‧‧‧‧‧‧‧‧‧‧‧‧‧‧‧‧‧‧‧‧‧‧‧‧‧‧‧‧‧‧‧‧‧‧‧ 21
LIST OF TABLES
Table 1. Patients’ characteristics ( n = 10) ‧‧‧‧‧‧‧‧‧‧‧‧‧‧‧‧‧‧‧‧‧‧‧‧‧‧‧‧‧‧‧‧‧‧‧‧‧‧‧‧‧‧‧‧‧‧‧‧‧‧‧‧‧‧ 8 Table 2. Tumor response ( n = 10) ‧‧‧‧‧‧‧‧‧‧‧‧‧‧‧‧‧‧‧‧‧‧‧‧‧‧‧‧‧‧‧‧‧‧‧‧‧‧‧‧‧‧‧‧‧‧‧‧‧‧‧‧‧‧‧‧‧‧‧‧‧‧‧‧‧ 10 Table 3. Clinical parameters of node down staging (n = 4) and non-node down staging to the preoperative CRT (n = 4)‧‧‧‧‧‧‧‧‧‧‧‧‧‧‧‧‧‧‧‧‧‧‧‧‧‧‧‧‧‧‧‧‧‧‧‧‧‧‧‧‧‧‧‧‧‧‧ 20
I. INTRODUCTION
In patients with locally advanced rectal cancer, preoperative
chemoradiotherapy (CRT) is administered because of advantages such as better local control, a higher rate of sphincter preservation, and lower toxicity compared to postoperative CRT [1]. Patients with preoperative CRT had the chance of tumor response evaluation that provides information of response to CRT and prognosis. In rectal cancer treatment, tumor response to preoperative CRT is associated with long-term prognosis [2].
In previous studies, researchers tried to evaluate the predictive factors that affect tumor response to CRT for rectal cancer. Clinical factors such as carcinoembryonic antigen (CEA), molecular profile, and distance from the anal verge were associated with tumor response [3, 4]. Recently, in addition to the clinical factors, the relationship between host immunity and tumor response was studied. Circulating lymphocyte count in peripheral blood was found to be an important parameter to determine clinical outcomes in advanced rectal cancer [5]. We also recently confirmed that sustaining lymphocyte count during preoperative CRT could be a predictive factor for patients with advanced rectal cancer [6].
Lymphocytes are divided into several subtypes, and each type reflects host immunity. Subpopulations of lymphocytes before CRT in rectal cancer were
analyzed, and the density of pretreatment CD8+lymphocytes in tumor
infiltrating lymphocytes was found to be an independent predictive factor for tumor response[7]. In addition, subpopulations of lymphocytes during radiotherapy (RT) change and each subpopulation responds differently to RT[8]. In cancer patients, total lymphocyte count and CD4+lymphocyte count
at the end of pelvic irradiation[9]. These changes of lymphocyte subsets to treatment could influence host immunity and tumor response [10]. However, the correlation between these lymphocytic profile changes to treatment and tumor response has not been evaluated in advanced rectal cancer.
We analyzed the association between the lymphocyte subpopulation count in the blood and tumor response to preoperative CRT in locally advanced rectal cancer.
II. Methods
A. Patients
In the prospective study, eligible patients had to satisfy all of the following
criteria: (1) a histologically confirmed diagnosis of rectal cancer
(adenocarcinoma); (2) resectable clinical stage T3-T4 or lymph-node metastasis positive based on computed tomography (CT) or magnetic resonance imaging (MRI); (3) CRT planned before surgery; (4) ECOG performance status of 0 or 1; (5) an age of 18–75 years at enrollment; (6) no severe organ dysfunction; and (7) no history of other cancer within 5 years. Patients with distant metastasis, previous RT, or pregnancy were excluded. Before enrollment, written informed consent was obtained from all patients. Patients received complete blood count (CBC) with differentiation, colonoscopy, MRI, and CT. Absolute lymphocyte counts and a subpopulation analysis were performed prior to and 4 weeks after the initiation of CRT. The institutional
review board of our institution has approved this study
(AJIRB-MED-SMP-15-207).
B. Treatments
RT was delivered with 6- or 10-MV photon beams in 1.8 Gy daily to a total dose of 50.4 Gy. Gross tumor volume (GTV) contoured the primary tumor and positive regional lymph nodes. The primary lesion was confirmed by MRI and CT. The clinical target volume (CTV) included the GTV, mesorectum, presacral area, and regional lymphatics (pararectal lymph nodes, internal iliac lymph nodes, and obturator lymph nodes). The planning target volume (PTV) was contoured by increasing the CTV by a margin of 0.5cm. Patients concurrently received a bolus of 5-fluorouracil (400 mg/m2/day)and
leucovorin(20mg/m2/day) for 5days in the first and fifth week of RT. The 3rd
chemotherapy could be administered depending on physician’s decision based on the tumor response using clinical imaging and physical examination in the ninth week. Surgery was performed 4–8weeks after the end of preoperative CRT. Surgeon selected method such as abdominoperinealresection(APR) or low anterior resection(LAR).
C. Flow cytometry
Blood was collected two times before and 4 weeks after the initiation of
CRT. Lymphocyte subpopulations (CD3+T lymphocyte, CD3+/CD4+helper T
lymphocytes, CD3+/CD8+ cytotoxic T lymphocytes, CD3-/CD19+ B
lymphocytes, and CD3-CD56+ NK cells) counts(cells/μL) and CD4+/CD8+ ratio
were analyzed by multicolor flow cytometry. Acquired cell were analyzed by flow cytometry using a FC-500 cytometer (Beckman Coulter). Monoclonal antibodies (mAbs) were used for cell surface staining. Instrument setting parameters such as threshold were set with machine software (CXP Software; Beckman Coulter) in conjunction with calibration beads (Flow-set beads, Cytocompkit, and CYTO-TROL Control Cells). Data were analyzed using CXP analysis software (Beckman Coulter).
D. Statistics
The endpoint of this study was to estimate tumor regression grade (TRG), pathologic complete response (pCR), lymph node response and the curative resection (R0) rate. Baseline evaluations were performed through imaging studies based on diffusion-weighted MRI with conventional MRI and CT. We used the sustaining ratio (SR) as a method of estimating CRT sensitivity of the lymphocyte subset. The SR was calculated by dividing the 4 weeks count
by the pretreatment count.
Achieving a pCR was defined as a complete absence of any tumor cells, in both dissected lymph nodes and the primary site in the pathology report from surgical specimen. Tumor and nodal response was evaluated by comparing the pretreatment status (determined by clinical staging) to the pathologic status after surgery. Node down staging was evaluated only among patients with clinically node positive. Clinical lymph node staging was evaluated based on signal intensity, border contour and size using T2 weighted MRI [11]. Differences in changes of lymphocyte subset counts between pretreatment and 4 weeks after the initiating CRT were analyzed by the Wilcoxon signed rank test. To confirm the relationship between lymphocyte subpopulation and tumor response, the Mann-Whitney U test was used. We assessed pattern over time in lymphocyte subset count by comparing tumor response group and non-tumor response group before and 4 weeks after initiation of CRT. We used a Friedman test as a nonparametric interaction test for factorial designs with repeated measures using an R program – npIntFactRep package [12]. Two-sided p-values less than 0.05 were confirmed to be significantly different. All statistical analyses were performed using R statistical packages [13].
III. RESULTS
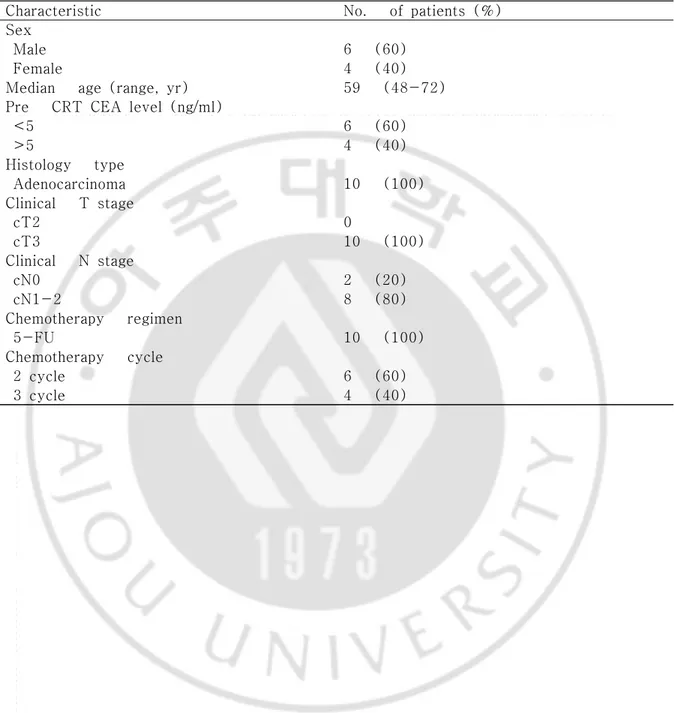
From August 2015 to June 2016, a total of 10 patients were enrolled. The clinical characteristics of the patients are shown in Table 1. Their ages ranged from 48 to 72 years, and 6 of the patients were men. All patients had clinical T3 staging and their node staging was N0 (2), N1-2 (8). Six patients received 2 cycles of chemotherapy and 4 patients received 3 cycles based on 5FU. All 10 patients had lower anterior resection (LAR) (100%) because of the tumor location.
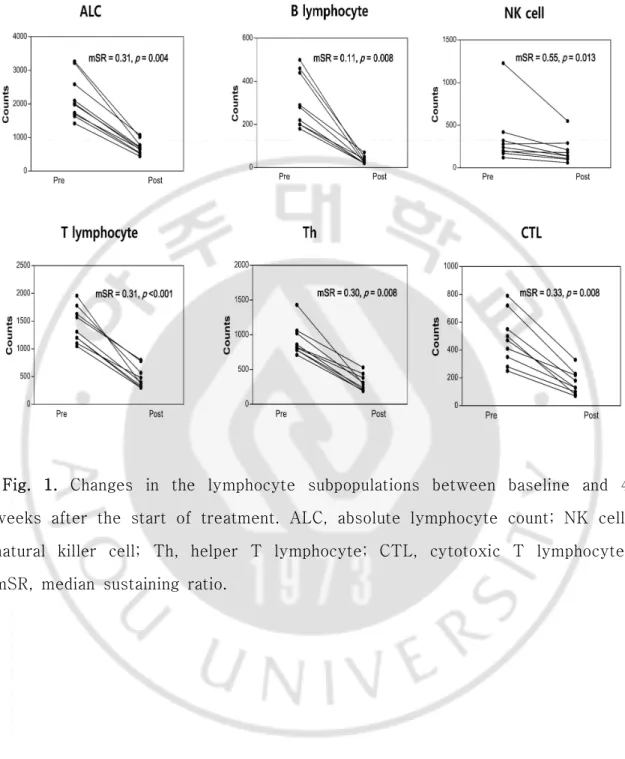
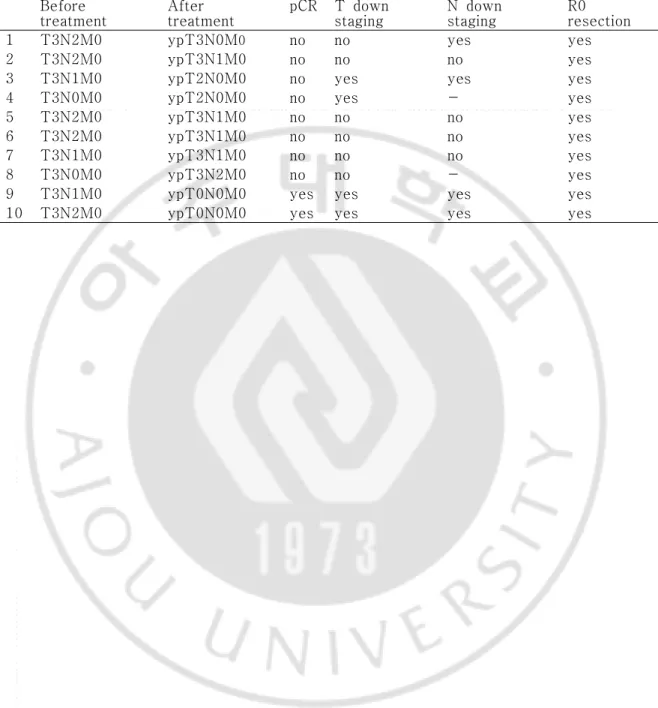
The tumor response of preoperative CRT was evaluated in all 10 patients (Table 2). The pCR rate was 20%, and R0 resection was 100%. T down staging was confirmed in 4 patients (40%). Node down staging which changed from clinical node positive to pathologic node negative after CCRT was occurred 4 of 8 patients with node positive. The median SR (mSR) for the lymphocyte was 0.31 and mSR for B lymphocytes was 0.11, which was the lowest compared to the other subpopulation values (Fig.1). The mSR for NK cells was 0.55.
The lymphocyte subset counts according to node down staging between pretreatment and 4 weeks after treatment are shown in Figure 1. At the pretreatment time point and 4 weeks after the initiation of treatment, there was no difference in clinical parameters between the node downs staging group versus the non-node down staging group to CRT (Table 3). However, all lymphocyte subpopulation counts at 4 weeks after the start of treatment were significantly decreased compared to the baseline result (p < 0.05).
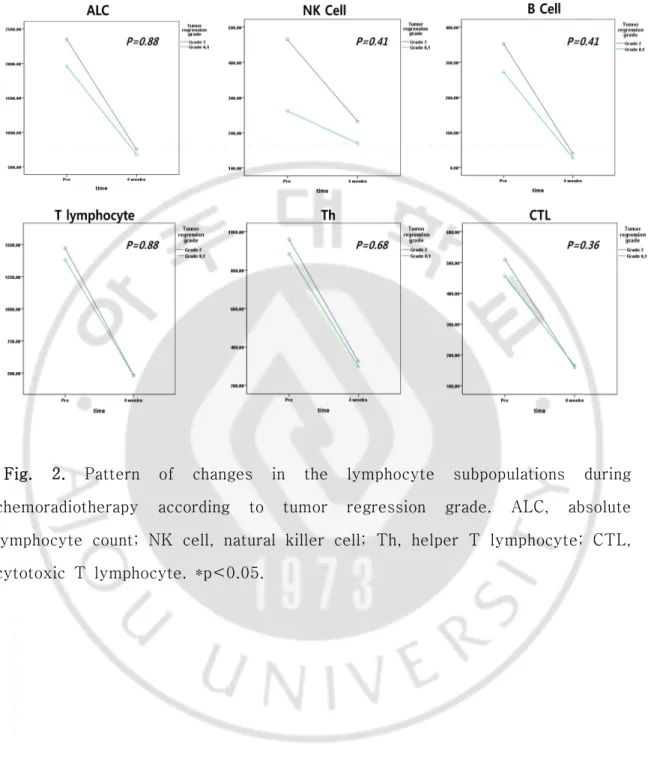
We evaluated the relationship between lymphocyte subpopulations and tumor response to preoperative CRT. The factors in relationship to a pCR and tumor
regression grade were not confirmed (Fig.2 and 3); however, the
CD4+/CD8+ratio at 4weeks after the initiation of CRT exhibited a tr
end(p=0.079).T downstaging was not associated with clinical and immune parameters (Fig.4). Among patients with lymph node positive, decreased lymphocyte count had a tendency to have an association with nodal response(p=0.067). In analysis of lymphocyte subset, a pattern of NK cell change between before and after CRT showed a trend for the association with nodal response (p = 0.052 by repeated measure analysis) (Fig.5). Also decreased NK cell count at 4-week (NK cell count at baseline – NK cell count at 4 weeks after initiating treatment) was associated with nodal response (p = 0.034) (Table 3 and Fig.6)
Table 1. Patient characteristics (n = 10)
Characteristic No. of patients (%)
Sex
Male 6 (60)
Female 4 (40)
Median age (range, yr) 59 (48-72) Pre CRT CEA level (ng/ml)
<5 6 (60) >5 4 (40) Histology type Adenocarcinoma 10 (100) Clinical T stage cT2 0 cT3 10 (100) Clinical N stage cN0 2 (20) cN1-2 8 (80) Chemotherapy regimen 5-FU 10 (100) Chemotherapy cycle 2 cycle 6 (60) 3 cycle 4 (40)
Fig. 1. Changes in the lymphocyte subpopulations between baseline and 4 weeks after the start of treatment. ALC, absolute lymphocyte count; NK cell, natural killer cell; Th, helper T lymphocyte; CTL, cytotoxic T lymphocyte; mSR, median sustaining ratio.
Table 2. Tumor response (n = 10) Before
treatment After treatment pCR T down staging N down staging R0 resection
1 T3N2M0 ypT3N0M0 no no yes yes
2 T3N2M0 ypT3N1M0 no no no yes
3 T3N1M0 ypT2N0M0 no yes yes yes
4 T3N0M0 ypT2N0M0 no yes - yes
5 T3N2M0 ypT3N1M0 no no no yes
6 T3N2M0 ypT3N1M0 no no no yes
7 T3N1M0 ypT3N1M0 no no no yes
8 T3N0M0 ypT3N2M0 no no - yes
9 T3N1M0 ypT0N0M0 yes yes yes yes
Fig. 2. Pattern of changes in the lymphocyte subpopulations during chemoradiotherapy according to tumor regression grade. ALC, absolute lymphocyte count; NK cell, natural killer cell; Th, helper T lymphocyte; CTL, cytotoxic T lymphocyte. *p<0.05.
Fig.3. Pattern of changes in the lymphocyte subpopulations during chemoradiotherapy according to pathologic complete response. ALC, absolute lymphocyte count; NK cell, natural killer cell; Th, helper T lymphocyte; CTL, cytotoxic T lymphocyte. *p<0.05.
Fig.4. Pattern of changes in the lymphocyte subpopulations during chemoradiotherapy according to T down staging. ALC, absolute lymphocyte count; NK cell, natural killer cell; Th, helper T lymphocyte; CTL, cytotoxic T lymphocyte. *p<0.05.
Fig.5. Pattern of changes in the lymphocyte subpopulations during chemoradiotherapy according to N down staging. ALC, absolute lymphocyte count; NK cell, natural killer cell; Th, helper T lymphocyte; CTL, cytotoxic T lymphocyte. *p<0.05.
Fig.6. The correlation between the decreased in numbers of lymphocyte subset during chemoradiotherapy (CRT) and N down staging. ALC, absolute lymphocyte count; Th, helper T lymphocyte; CTL, cytotoxic T lymphocyte; NK cell, natural killer cell. *p < 0.05.
IV. DISCUSSION
Lymphocyte subtypes include T lymphocytes, B lymphocytes, and natural killer cells. Each subpopulation of lymphocytes has different immune functions and different responses to CRT [14]. In a previous study, we showed that change in lymphocytes during CRT had a relationship with a pCR in locally advanced rectal cancer [6]. This result inspired us to evaluate the relationship between subpopulations of lymphocytes and tumor response. In this study, we found that change of NK cell showed a trend of correlation with nodal tumor response.
Tumor response to preoperative CRT is dependent on a patient’s status. We could select treatment plan or modality based on predictions of response. Many studies focused on clinical factors and molecular profile of cancer lesion and confirmed the association of biomarker with tumor response [3, 4]. Immunological host status also influenced tumor response [5]. Previous studies also considered pretreatment immune status such as the density of CD4(+) and CD8(+) T lymphocyte [15]. However, during preoperative CRT, host immunity status was changed. We confirmed that the lymphocyte subset profile before and 4 weeks after initiation of CRT was significantly decreased (Fig.1).
Therefore, change of host immune status could influence tumor response. Decreased peripheral blood lymphocytes count based on radiation-induced apoptosis was associated with histological tumor regression to preoperative CRT in rectal cancer [16]. High proportion of apoptosis in lymphocyte showed good histological regression to treatment. In our study, decreased lymphocyte count also showed a trend in association with node down staging (p = 0.067) (Fig.6). In the study using lymphocyte subset analysis, higher reduction of T lymphocyte containing Th and Tc during CRT was associated with T down
staging [17].
In addition to T down staging, we found that change of NK cell during treatment was related to lymph node down staging. The pattern and amount of change in NK cells during CRT were associated with pathologic lymph node metastasis (Fig.5 and 6). These results suggested that the change of lymphocyte and lymphocyte subset in peripheral blood could be used as a biomarker to predict tumor response. Especially, in patients with rectal cancer, pathologic lymph node status was associated with prognosis [18]. Therefore, prediction of lymph node response using change to CRT could be useful to decide treatment plan after CRT. If poor node response to CRT is predicted, we could consider surgery rather than additional chemotherapy after CRT. Besides N down staging, pCR and T down staging were not associated with change of NK cell (Fig.7).
In this study, we used the SR as a method of estimating sensitivity of the lymphocyte subset to treatment. The lymphocyte subpopulation also has a different response to chemotherapy and radiotherapy. [8, 19]. Sensitivity to CRT for NK cells was the lowest in the lymphocyte subset (mSR = 0.55). The mSR for NK cells was 5 times higher than that for B cells which was most sensitive to CRT (0.55 vs 0.11). The mSR for CTL was 0.33 and CTL showed more resistance compared to Th (mSR 0.33 vs 0.30) (Figure 1). Since NK cell is most resistant to CRT, change of NK cell could more critical to tumor response than any another lymphocyte subset. In fact, mSR for NK cell in according to node down staging was different (0.54 vs 0.95) and node down staging group had low mSR.
Besides divergent sensitivity to CRT, lymphocyte subpopulation has a different immune function. NK cells are cytotoxic lymphocytes that are part of
the innate immune system [20]. In tumors, NK cells eliminate tumor cells without activation of antigens. CTL has the function of adaptive immune responses based on cell mediated immunity [21]. CTL recognizes tumor antigens by Th and kills tumor cells. Th has a function of recognizing antigens on the surface of antigen presenting cells (APC) and secrete cytokines for differentiation from naïve CTL cells into activated CTL[22]. We confirmed that
a low CD4+/CD8+ratio has a tendency to have a relationship with
pCR(p=0.079).The CD4+/CD8+ratio indicates immune status and has clinical
significant relation with lymph node metastas is in cervical cancer[23].
B lymphocytes originate from the bone marrow and are related to humoral immunity. B lymphocytes have been reported to be the most radiation sensitive subpopulation type [8]. In breast cancer patients, circulating B lymphocytes during fractionated RT show severe depletion. After completion of RT, a gradual recovery has been confirmed [14]. In addition, B cells are sensitive to chemotherapy [19]. The mSR for B lymphocytes was 0.11 and it was the lowest of the subpopulation types. Absolute counts of B lymphocytes decreased significantly after CRT (Fig.1). However, in the analysis of their relationship with tumor response, B lymphocytes were not significantly associated with pCR, T and N down staging.
There are some limitations in this study. Unlike previous studies using tumor infiltrating lymphocyte (TIL), we analyzed circulating lymphocyte subset. The correlation between circulating lymphocyte and TIL has not been confirmed. However, naïve lymphocytes continuously migrate from the blood into the lymph nodes. Activated lymphocytes in lymph nodes move to specific sites through peripheral blood vessels. The pelvic area receiving RT has regional lymphatics and vessels near lymph nodes. Therefore, evaluation of
circulating lymphocytes in rectal cancer could reflect patient immunity. High peripheral lymphocytes have association with favorable prognosis [15]. Specimen to evaluate TIL after surgery was affected by CRT and could not reflect primary status. Also, biopsy specimen before CRT could not represent whole cancer tissue. Although prospective study was conducted, sample size was relatively small. Relation between lymphocyte subpopulation and tumor response was analyzed with nonparametric method such as Wilcoxon signed rank test and the Mann-Whitney U test. Also, to avoid variability due to diurnal changes, blood sampling was twice implemented before and 4 weeks after initiating CRT.
Table 3. Clinical parameters of node down staging (n=4) and non-node down staging to the preoperative CRT (n=4)
Abbreviations: DS, down staging; CTL, ; Th, helper T lymphocyte.
Variable Node DS (+) Median (range) Node DS (-) Median (range) p-value CEA, baseline (ng/ml) 3.95 (1.6 – 15.4) 8.2 (2.9 - 23.1) 0.386 WBC, baseline (×106L) 6850 (4000 - 8500) 6600 (5100 – 6500) 0.243 Lymphocyte, baseline (×106/L) 1850 (1700 - 2800) 1850 (1400 – 2200) 0.561 B lymphocyte, baseline (%) 15 (10 - 23) 13 (10 – 14) 0.661 B lymphocyte, baseline (×109/L) 330 (180 - 500) 250 (140 – 290) 0.564 T lymphocyte, baseline (%) 69 (54 – 79) 73 (69 - 78) 0.554 T lymphocyte, baseline (×109/L) 1255 (1100 – 1780) 1385 (960 - 1630) 0.885 Th, baseline (%) 42 (36 – 52) 48 (39 – 56) 0.386 Th, baseline (×106/L) 835 (720 – 1020) 800 (780 – 1060) 1.000 CTL, baseline (%) 24 (14 – 33) 24 (12 – 37) 1.000 CTL, baseline (×106/L) 450 (280 – 720) 440 (170 – 790) 1.000 CD4/CD8 ratio, baseline 1.95 (1.28 – 2.90) 2.12 (1.05 – 4.69) 0.773 NK cell, baseline (%) 15 (10 - 16) 13 (6 – 20) 0.564 NK cell, baseline (×106/L) 280 (170 – 420) 235 (120 - 280) 0.384 CEA at 4-week (ng/ml) 1.6 (1.3 – 10.7) 6.5 (2.8 – 25.8) 0.154 WBC at 4-week (×106/L) 4650 (3300 – 5100) 4400 (4300 – 7500) 0.476 Lymphocyte, at 4-week(×106/L) 600 (500 - 800) 900 (500 – 1100) 0.271 B lymphocyte, at 4-week (%) 4 (3 – 7) 4 (3 – 8) 0.853 B lymphocyte, at 4-week (×109/L) 25 (20 – 50) 30 (20 – 70) 0.578 T lymphocyte, at 4-week (%) 68 (67 – 77) 71 (56 – 85) 0.721 T lymphocyte, at 4-week (×109/L) 440 (330 – 570) 780 (300 – 800) 0.480 Th, at 4-week (%) 41 (39 – 53) 47 (35 – 48) 1.000 Th, at 4-week (×106L) 260 (200 – 380) 440 (190 – 530) 0.480 CTL, at 4-week (%) 27 (14 – 36) 25 (19 – 36) 0.858 CTL, at 4-week (×106L) 155 (100 – 230) 220 (130 – 330) 0.372 CD4+/CD8+ratioat4-week 1.51 (1.09 – 3.73) 1.40 (1.33 – 2.4) 1.000 NK cell, at 4-week (%) 23 (19 – 28) 26 (7 – 32) 0.857 NK cell, at 4-week (×106/L) 140 (100 – 290) 180 (60- 290) 0.721 Decreased lymphocyte at 4-week 1250 (200 – 2000) 1100 (1100 -1200) 0.064 Decreased B lymphocyte at 4-week 296 (160 – 470) 220 (200 – 250) 1.000 Decreased T lymphocyte at 4-week 890 (620 – 1210) 850 (770 – 900) 0.480 Decreased Th at 4-week 580 (430 – 710) 530 (380- 590) 0.480 Decreased CTL at 4-week 295 (180 – 490) 340 (190 – 460) 1.000 Decreased NK cell at 4-week 140 (70 – 210) 10 (10 – 60) 0.034
Fig.7. The correlation between tumor response and reduction in numbers of NK cells. CRT, chemoradiotherapy; pCR, pathologic complete response. *p < 0.05.
V. Conclusion
Host immunity plays an important role in tumor responses to CRT for rectal cancer. Each lymphocyte subpopulation responded differently to CRT and had different functions. B lymphocytes were the most sensitive while NK cells were the most resistant to CRT. NK cell change during CRT were associated with nodal tumor response. Further studies on large patient populations are warranted to confirm our observations.
REFERENCE
1. Sauer R, Becker H, Hohenberger W, Rödel C, Wittekind C, Fietkau R, et al. Preoperative versus Postoperative Chemoradiotherapy for Rectal Cancer. New England Journal of Medicine. 2004;351(17):1731-40.
2. Walker AS, Zwintscher NP, Johnson EK, Maykel JA, Stojadinovic A,
Nissan A, et al. Future directions for monitoring treatment response in colorectal cancer. J Cancer. 2014;5(1):44-57.
3. Restivo A, Zorcolo L, Cocco IM, Manunza R, Margiani C, Marongiu L,
et al. Elevated CEA levels and low distance of the tumor from the anal verge are predictors of incomplete response to chemoradiation in patients with rectal cancer. Ann Surg Oncol. 2013;20(3):864-71.
4. Kuremsky JG, Tepper JE, McLeod HL. Biomarkers for response to
neoadjuvant chemoradiation for rectal cancer. Int J Radiat Oncol Biol Phys. 2009;74(3):673-88.
5. Kitayama J, Yasuda K, Kawai K, Sunami E, Nagawa H. Circulating
lymphocyte is an important determinant of the effectiveness of preoperative radiotherapy in advanced rectal cancer. BMC Cancer. 2011;11:64.
6. Heo J, Chun M, Noh OK, Oh YT, Suh KW, Park JE, et al. Sustaining
Blood Lymphocyte Count during Preoperative Chemoradiotherapy as a Predictive Marker for Pathologic Complete Response in Locally Advanced Rectal Cancer. Cancer Res Treat. 2016;48(1):232-9.
7. Yasuda K, Nirei T, Sunami E, Nagawa H, Kitayama J. Density of CD4(+) and CD8(+) T lymphocytes in biopsy samples can be a predictor of pathological response to chemoradiotherapy (CRT) for rectal cancer. Radiation Oncology (London, England). 2011;6:49-.
8. Heylmann D, Rodel F, Kindler T, Kaina B. Radiation sensitivity of
human and murine peripheral blood lymphocytes, stem and progenitor cells. Biochim Biophys Acta. 2014;1846(1):121-9.
9. Lissoni P, Brivio F, Fumagalli L, Messina G, Meregalli S, Porro G, et al. Effects of the conventional antitumor therapies surgery, chemotherapy, radiotherapy and immunotherapy on regulatory T lymphocytes in cancer patients. Anticancer Res. 2009;29(5):1847-52.
10. García-Martínez E, Gil GL, Benito AC, González-Billalabeitia E, Conesa
MAV, García TG, et al. Tumor-infiltrating immune cell profiles and their change after neoadjuvant chemotherapy predict response and prognosis of breast cancer. Breast Cancer Research : BCR. 2014;16(6):488.
11. Beets-Tan RG, Lambregts DM, Maas M, Bipat S, Barbaro B,
Caseiro-Alves F, et al. Magnetic resonance imaging for the clinical management of rectal cancer patients: recommendations from the 2012 European Society of Gastrointestinal and Abdominal Radiology (ESGAR) consensus meeting. European radiology. 2013;23(9):2522-31.
with repeated measures
http://cran.r-project.org/web/packages/npIntFactRep/index.html2015
13. Team. RDC. R: A language and environment for the statistical
computing, R Foundation for Statistical Computing, Vienna, Austria.
https://www.r-project.org/2016.2016
14. Sage EK, Schmid TE, Sedelmayr M, Gehrmann M, Geinitz H, Duma
MN, et al. Comparative analysis of the effects of radiotherapy versus radiotherapy after adjuvant chemotherapy on the composition of lymphocyte subpopulations in breast cancer patients. Radiother Oncol. 2016;118(1):176-80.
15. He JR, Shen GP, Ren ZF, Qin H, Cui C, Zhang Y, et al. Pretreatment levels of peripheral neutrophils and lymphocytes as independent prognostic
factors in patients with nasopharyngeal carcinoma. Head & neck.
2012;34(12):1769-76.
16. Ishihara S, Iinuma H, Fukushima Y, Akahane T, Horiuchi A, Shimada R, et al. Radiation-Induced Apoptosis of Peripheral Blood Lymphocytes is Correlated with Histological Regression of Rectal Cancer in Response to
Preoperative Chemoradiotherapy. Annals of Surgical Oncology.
2012;19(4):1192-8.
17. Tada N, Kawai K, Tsuno NH, Ishihara S, Yamaguchi H, Sunami E, et
al. Prediction of the preoperative chemoradiotherapy response for rectal cancer by peripheral blood lymphocyte subsets. World Journal of Surgical Oncology. 2015;13(1):1-10.
18. Ong MLH, Schofield JB. Assessment of lymph node involvement in
colorectal cancer. World Journal of Gastrointestinal Surgery.
2016;8(3):179-92.
19. Sewell HF, Halbert CF, Robins RA, Galvin A, Chan S, Blamey RW.
Chemotherapy-induced differential changes in lymphocyte subsets and natural-killer-cell function in patients with advanced breast cancer. Int J Cancer. 1993;55(5):735-8.
20. Marcus A, Gowen BG, Thompson TW, Iannello A, Ardolino M, Deng W,
et al. Recognition of tumors by the innate immune system and natural killer cells. Adv Immunol. 2014;122:91-128.
21. Spurrell EL, Lockley M. Adaptive immunity in cancer immunology and
therapeutics. ecancermedicalscience. 2014;8:441.
22. Knutson KL, Disis ML. Tumor antigen-specific T helper cells in cancer immunity and immunotherapy. Cancer Immunol Immunother. 2005;54(8):721-8.
23. Hadrup S, Donia M, thor Straten P. Effector CD4 and CD8 T Cells and Their Role in the Tumor Microenvironment. Cancer Microenvironment. 2013;6(2):123-33.