Research Article
CaCl
2
-Accelerated Hydration of Tricalcium Silicate:
A STXM Study Combined with
29
Si MAS NMR
Qinfei Li,
1,2Yong Ge,
1Guoqing Geng,
2Sungchul Bae,
2,3and Paulo J. M. Monteiro
21School of Transportation Science and Engineering, Harbin Institute of Technology, Harbin 150090, China
2Department of Civil and Environmental Engineering, University of California at Berkeley, Berkeley, CA 94720, USA 3Faculty of Science and Technology, Tokyo University of Science, 2641 Yamasaki, Noda, Chiba 278-8510, Japan
Correspondence should be addressed to Qinfei Li; [email protected]
Received 20 August 2015; Revised 5 November 2015; Accepted 16 November 2015 Academic Editor: Jin-Ho Choy
Copyright © 2015 Qinfei Li et al. This is an open access article distributed under the Creative Commons Attribution License, which permits unrestricted use, distribution, and reproduction in any medium, provided the original work is properly cited.
The effect of calcium chloride (CaCl2) on tricalcium silicate (C3S) hydration was investigated by scanning transmission X-ray microscopy (STXM) with Near Edge X-X-ray Absorption Fine Structure (NEXAFS) spectra and29Si MAS NMR. STXM is demonstrated to be a powerful tool for studying the chemical composition of a cement-based hydration system. The Ca L3,2-edge NEXAFS spectra obtained by examining C3S hydration in the presence of CaCl2showed that this accelerator does not change the coordination of calcium in the calcium silicate hydrate (C-S-H), which is the primary hydration product. O K-edge NEXAFS is also very useful in distinguishing the chemical components in hydrated C3S. Based on the Ca L3,2-edge spectra and chemical component mapping, we concluded that CaCl2prefers to coexist with unhydrated C3S instead of C-S-H. In Si K-edge NEXAFS analysis, CaCl2increases the degree of silicate polymerization of C-S-H in agreement with the29Si CP/MAS NMR results, which show that the presence of CaCl2in hydrated C3S considerably accelerates the formation of middle groups (𝑄2) and branch sites (𝑄3) in the silicate chains of C-S-H gel at 1-day hydration.
1. Introduction
Calcium chloride (CaCl2) plays an important role in
accel-erating the hydration and setting of tricalcium silicate (C3S)
and Portland cement [1–3]. CaCl2has been used widely in
construction using unreinforced concrete [3] due to steel cor-rosion. The rate of formation of hydration products has often
been observed to increase in the presence of CaCl2, thereby
accelerating the rate of heat evolution during hydration [1, 3]. This accelerating admixture promotes the dissolution of the cations or anions from the cement, thereby accelerating the growth rate of calcium silicate hydrate (C-S-H), which is a complicated physical and chemical process for nucleation and growth [4]. However, this mechanism is not fully understood at the molecular level [5].
The microstructure and nanostructure of the hydration products are expected to be influenced by speeding up the
hydration reaction. CaCl2is well known to have the ability
to increase the nitrogen surface area and pore volume of
Portland cement and C3S pastes [6, 7]. The “sheaf-of wheat”
or fibrous morphology of hydrated C3S in the presence
of CaCl2 has been investigated using various microscopy
techniques [2, 8–11], such as scanning electron microscopy (SEM), transmission electron microscopy (TEM), and full-view transmission soft X-ray microscopy, but little infor-mation has been obtained about the chemical and physical properties corresponding to the morphology. Transmission soft X-ray microscopy has increasingly been utilized in exploring the cement-based materials [2, 8, 12, 13]. Juenger
et al. [2] found that CaCl2accelerates the formation of “inner
product” H with a low-density microstructure. The C-S-H is formed early and outside the original grain boundary as bridge spaces between grains. Thomas et al. studied the
development of the microstructure and kinetics of pure C3S
and CaCl2-accelerated C3S pastes, and they reported that
CaCl2 accelerated the rate of nucleation of the hydration
product on the surface of the C3S particles significantly
but that CaCl2 has relatively little effect on the growth
rate [1]. These studies demonstrated that both morphologic
information about hydrated C3S in the presence of CaCl2
Volume 2015, Article ID 215371, 10 pages http://dx.doi.org/10.1155/2015/215371
and exploration of chloride binding are needed. However, the analytical approaches listed above have certain limitations in that they do not include the chemical speciation of elements in heterogeneous materials on the submicron-scale.
Scanning transmission X-ray microscopy (STXM) pro-vides information on both morphology and X-ray Absorp-tion Spectroscopy (XAS). STXM is a promising technique in further understanding the structure and properties of the C-S-H phase [14–19]. The STXM technique allows the investigation of amorphous and crystalline materials. In addition to obtaining the chemical speciation information, STXM allows the identification of heterogeneity within the samples on a particle-by-particle basis. Significantly, image stacks (where a series of images is collected corresponding to each energy level observed by STXM with Near Edge X-ray Absorption Fine Structure (NEXAFS)) were converted into chemical component mapping. The results can be visualized by RGB overlay maps using Singular Value Decomposition (SVD) based on reference spectra [20]. Because various chemical components have unique NEXAFS spectra, the reference spectra obtained from known components were used to visualize and differentiate phases in a sample [21].
To investigate the effects of CaCl2on the microstructure
of hydration products during the hydration of C3S, X-ray
diffraction (XRD),29Si MAS NMR, and scanning
transmis-sion X-ray microscopy (STXM) measurements were taken to investigate the interactions between calcium chloride and C-S-H. Through the use of STXM in combination with concur-rent measurements of NEXAFS, the results from this study will examine sample composition and spatial heterogeneities and thus aid in explaining the interactions between calcium or chloride ions and C-S-H. This will improve understanding
of the accelerating role of CaCl2on the chemical information
of C-S-H, bringing the state of the art a step closer to the development of admixtures for advanced concrete structures.
2. Materials and Methods
2.1. Materials. Triclinic C3S passing through sieve #325
(45𝜇m) was purchased from CTL Group (Skokie, IL). Finely
ground anhydrous triclinic C3S powder was mixed with a
0.1 M CaCl2solution with a liquid-to-solid ratio of 1.0. A C3S
paste produced for STXM was maintained in CryoTube vials
(1.8 mL) under the protection of N2gas at room temperature
and was then sealed in a vacuum bag. After a period of
hydration of 1, 3, 7, and 28 d, samples of hydrated C3S with
an addition of CaCl2 were dried in a vacuum oven at 23∘C
before X-ray diffraction and29Si MAS NMR measurements.
2.2. X-Ray Diffraction. Samples of hydrated C3S with an
addition of CaCl2 at different hydration times were tested
using a PANalytical X’Pert Pro diffractometer equipped with a Co X-ray tube (𝜆 = 1.79 ˚A) and the rapid X’celerator detector. The XRD patterns of the samples were analyzed using the X-Pert High Score Plus software. XRD was used to
identify crystalline phases from a 2𝜃 value of 5–55∘with a step
of 0.02∘.
2.3. Scanning Transmission X-Ray Microscopy. After 7 d of
hydration, the C3S paste was ground and dispersed with
deionized water for STXM measurement. A drop of 0.1𝜇L of
C3S solution was taken and placed on the center of the Si3N4
membrane window (core: 1 mm × 1 mm × 100 nm; frame:
5 mm× 5 mm × 0.2 mm) with a micropipette. Residual water
was removed from the window.
The reference Ca L3,2-edge NEXAFS spectra of CaCl2
particles on the Si3N4 window were also measured. STXM
experiments were performed at the Advanced Light Source (ALS) at Lawrence Berkeley National Laboratory (LBNL) beamline 5.3.2.1 (700–2500 eV) and beamline 5.3.2.2 (250– 800 eV) [23]. The images and NEXAFS spectra of the Ca
L3,2-edge (340–360 eV), O edge (520–560 eV), and Si
K-edge (1825–1890 eV) were measured. The Axis 2000 software (version 2.1) was used to align stack images and extract NEXAFS spectra from the stack and line scan images. The stack scan collects absorption data for the field of view at each preselected energy point.
2.4.29Si MAS NMR. Solid-state NMR spectra were recorded
on a Bruker MSL-300 spectrometer in which the resonance
frequency for29Si is 59.63 MHz. Samples were packed into
a 4 mm Zirconia rotor. High-power proton decoupling was
used for the 29Si spectra, and chemical shifts are quoted
relative to external tetramethylsilane (TMS) for29Si. Typical
acquisition parameters for recording the29Si spectra were a
4.5 kHz sample spinning speed, 4𝜇s pulse length, and 6 KHz
sweep width. 29Si cross-polarization magic-angle spinning
(CPMAS) experiments were performed using a relaxation
delay of 12𝜇s.
3. Results and Discussion
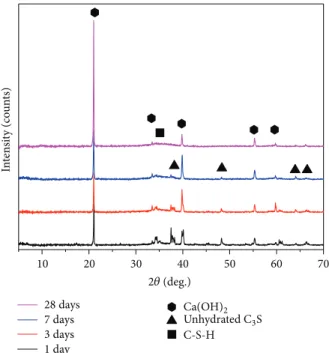
3.1. XRD Patterns. The results of the XRD analysis of the
chloride-containing samples with different hydration times
are shown in Figure 1. Portlandite crystals (Ca(OH)2) and
unhydrated C3S can be observed starting at 1 d of hydration.
At 28 d, unhydrated C3S was no longer observed. Due to the
poor crystallinity of amorphous C-S-H, there is just a hump associated with the formation of C-S-H at a d-spacing of
3.08 ˚A starting at 3 d for hydrated C3S with CaCl2.
3.2. Ca L3,2-Edge NEXAFS Analysis. The references of
unhy-drated C3S, pure Ca(OH)2, and pure C-S-H were first
determined by Bae et al. [22], whereas the reference for CaCl2
was collected in the present study. C3S and its hydration
products are calcium compounds. Ca L3,2-edge NEXAFS
spectra provide a calcium coordination environment and conveniently characterize the amorphous and crystalline Ca-containing materials that are present in these reference
compounds and 7-day-hydrated C3S with CaCl2in Figure 2.
The observed multiple peak patterns of Ca L3,2-edge NEXAFS
spectra consist of two main spin-orbit related peaks (𝑎2and
𝑏2) corresponding to L3 and L2, along with several smaller
peaks (𝑎1 and 𝑏1) leading to the main peaks (Figure 2).
The experimental resolution for the spectra is less than approximately 0.1 eV. The magnitudes and symmetry of
Table 1: Peak positions and splitting energy values of the reference Ca L3,2-edge and the different areas of the C3S particles in the presence of CaCl2.
Samples Peak positions (ev) ΔCa-L3(𝑎2− 𝑎1) ΔCa-L2(𝑏2− 𝑏1)
𝑎1 𝑎2 𝑏1 𝑏2 CaCl2-ref 348.0 349.2 351.3 352.4 1.2 1.1 Ca(OH)2-ref∗ 347.6 349.1 351.0 352.4 1.5 1.4 Unhydrated C3S-ref∗ 347.7 349.0 351.1 352.3 1.3 1.2 C-S-H-ref∗ 348.1 349.1 351.4 352.4 1.0 1.0 Area 1 347.7 349.0 351.1 352.3 1.3 1.2 Area 2 347.9 348.9 351.2 352.3 1.0 1.1 Area 3 347.8 349.0 351.1 352.3 1.2 1.2
∗Data from Bae et al. [22].
28 days 7 days 3 days 1 day 10 30 40 Ca(OH)2 Unhydrated C3S C-S-H 50 20 60 70 2𝜃 (deg.) In te n si ty (co un ts)
Figure 1: XRD patterns of phase changes from hydrated C3S in the presence of CaCl2at different hydration times.
the crystal field of calcium in the first coordination sphere result in crystal field splitting, which is the origin of these multipeak patterns. The peak positions and energy separation
values (ΔL3(𝑎2 − 𝑎1) and ΔL2(𝑏2 − 𝑏1)) are related to the
symmetry of Ca2+, given in Table 1.
Figure 2 presents the Ca L3,2-edge NEXAFS spectra of
CaCl2, Ca(OH)2, pure C-S-H, and anhydrous C3S as the
references. Each of these spectra is unique in terms of its shape and peak positions as well as the splitting shown in Table 1. The uniqueness of each spectrum has been used as a fingerprint for investigating the Ca structure. The larger
splitting energy and peak intensity ratio in the Ca L3,2-edge
NEXAFS spectra are good indications of the well-developed crystalline Ca structure, which means that the splitting
energy values forΔ(𝑎2− 𝑎1) and Δ(𝑏2− 𝑏1) are nonlinearly
related to the value of the crystal field parameter (10 Dq).
Ca(OH)2, with octahedral symmetry (Oℎ) [24], shows larger
splitting energy values and peak intensity ratios for𝑎1/𝑎2and
𝑏1/𝑏2compared with the values and ratios of unhydrated C3S
and pure C-S-H due to the different electronegativity in the crystal field. The reference of pure C-S-H in 17-day-hydrated
C3S [22] has the smallest splitting energy and peak intensity
ratio shown in Figure 2, which result from its amorphous or poor-crystallinity structure. In addition, the peak intensity
ratios for𝑎1/𝑎2 and𝑏1/𝑏2 generally indicate the magnitude
of the crystal field and suggest that C-S-H has the smallest
crystal field parameter but that CaCl2 has the largest. The
mean coordination number of CaCl2is six in the octahedral
crystal field (positive) [25].
3.3. STXM Analysis of 7-Day-Hydrated C3S with CaCl2. The
selected areas of a 7-day-hydrated C3S particle in the presence
of CaCl2were analyzed by Ca L3,2-edge and O K-edge
NEX-AFS spectroscopy, as shown in Figure 2. The peak positions,
splitting energy values, and references of Ca L3,2-edge
NEX-AFS spectra are listed in Table 1. In Figure 2(d), Ca L3,2-edge
NEXAFS for Area 1 has the largest splitting energy and peak intensity ratio, and Area 2 has the smallest. The peak positions
for Area 2 shift slightly by approximately−0.2 eV, but the
split-ting energy for Area 2 is similar to that of the C-S-H reference.
The energy separation of C-S-H with 1.0 and 1.1 forΔ(𝑎2− 𝑎1)
andΔ(𝑏2− 𝑏1) and the smallest peak intensity ratios for 𝑎1/𝑎2
and𝑏1/𝑏2 in Area 2 suggest that the calcium in C-S-H has
a randomly spherical coordination with the oxygen, which means that the coordination environment of calcium in
C-S-H is asymmetric. This observation suggests that CaCl2does
not change the coordination environment of calcium in C-S-H. Moreover, the energy separation of Area 3, with 1.2 and 1.2
forΔ(𝑎2− 𝑎1) and Δ(𝑏2− 𝑏1), respectively, is similar to that of
the unhydrated C3S reference. Therefore, these areas are
iden-tified by Ca L3,2-edge NEXAFS spectra, which are compared
with the peak positions, splitting energy, and peak shape of
the above references: Area 1 is related to Ca(OH)2, Area 2 is
related to C-S-H, and Area 3 is related to unhydrated C3S.
We also present the O K-edge NEXAFS spectroscopy of the three areas in the same particle shown in Figure 2(e). The O K-edge NEXAFS spectrum can provide simultaneous chemical information about hydration products and
unhy-drated C3S and shows that the differences in the O K-edge
NEXAFS spectra are sufficiently significant to distinguish the distinct hydration products.
342 346 350 354 Energy (eV) 358 N o rm alized in te n si ty (a.u .) Anhydrous C3S-ref C-S-H-ref Ca(OH)2-ref CaCl2-ref a1 a2 b1 b2 (a) 1 𝜇m 1 1 1𝜇𝜇𝜇𝜇𝜇𝜇mmmm 1 2 3 0.5 𝜇m (b) 1 2 3 0.5 𝜇m (c) 358 Area 3 Area 2 Area 1 342 346 350 354 Energy (eV) N o rm alized in te n si ty (a.u .) a1 a2 b1 b2 (d) 1 2 3 4 520 530 540 550 560 Energy (eV) 570 580 N o rm alized in te n si ty (a.u .) Area 3 Area 2 Area 1 (e)
Figure 2: (a) Ca L3,2-edge NEXAFS spectra of the reference anhydrous C3S∗, C-S-H∗, Ca(OH)2∗, and CaCl2(∗ data from Bae et al. [22]), (b) and (c) a single image of 7-day-hydrated C3S in the presence of CaCl2taken at, respectively, 340 eV and 525 eV, (d) Ca L3,2-edge NEXAFS spectra of the selected area in (b), and (e) O K-edge NEXAFS spectra of the selected area in (c).
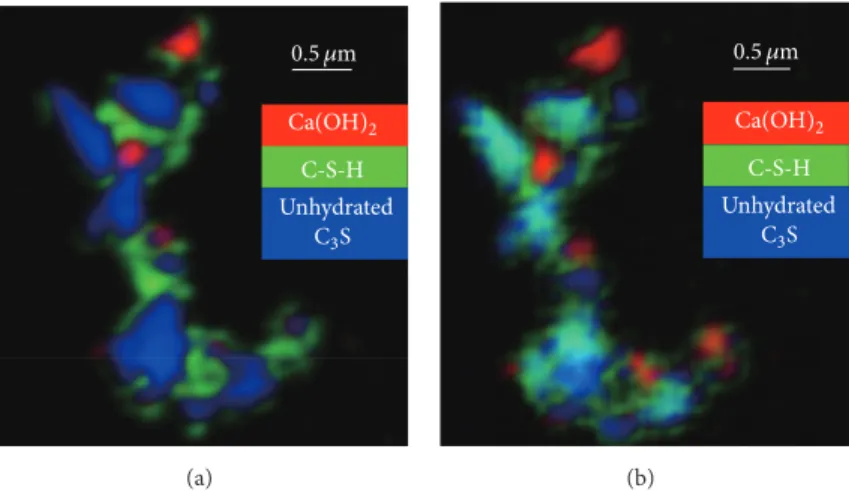
Anhydrous C3S C-S-H Ca(OH)2 0.5 𝜇m Unhydrated C3S C-S-H Ca(OH)2 (a) 0.5 𝜇m Unhydrated C3S C-S-H Ca(OH)2 (b)
Figure 3: Decomposition diagram of RGB overlay maps using SVD for the C3S particle in the presence of CaCl2based on NEXAFS spectra obtained from the reference in Figure 2 and the different areas in Figure 3: (a) Ca L3,2-edge image stacks; (b) O K-edge image stacks.
0.5 𝜇m
Unhydrated
C3S
C-S-H Ca(OH)2
Figure 4: Decomposition diagram of RGB overlay maps using SVD for the C3S particle in the presence of CaCl2based on the Ca L3,2 -edge NEXAFS spectra obtained from the reference in Figure 2 and the different areas in Figure 3.
In Figure 2(e), there are four peaks, labeled 1 through 4,
in each O spectrum. Peak 1 is a𝜋∗peak, and peaks 3 and 4 are
𝜎∗peaks. However, peak 2 behaves differently across different
types of crystallinity [26]. Peak 2 is sharper in Ca(OH)2than
are the peaks in C-S-H and in unhydrated C3S. The layered
crystal structure of Portlandite (Ca(OH)2) is well known to
be trigonal with the space group P3m1 and can be described as stacked sheets of distorted edge-sharing Ca-O octahedra along the c-axis [27]. Each hydroxyl group is coordinated by three Ca atoms in its layer and is surrounded by three other hydroxyl groups that belong to the adjacent layer. Unhydrated
C3S is triclinic and consists of the mean coordination number
(6.21) [28] of Ca cations and the SiO4tetrahedra, which show
varying degrees of disorder. Therefore, there are weaker𝜋∗
peaks, and peak 2 in the O K-edge NEXAFS of C-S-H is due to the poor crystallization of C-S-H.
Image stacks, where a series of images is collected cor-responding to each energy, were collected to convert into
chemical component mapping. As shown in Figure 3, the results were visualized by RGB overlay maps using Singular Value Decomposition (SVD) based on reference spectra [20]. Because various chemical components have unique NEXAFS spectra, the reference spectra obtained from known components were used to visualize and differentiate phases in a sample [21]. Both of the distributions of phases in the
same hydrated C3S in the presence of CaCl2 with the Ca
L3,2-edge and the O K-edge image stacks are presented in
Figure 3. We observe a few magenta pixels (M = R + B =
Ca(OH)2+ unhydrated C3S) in Figure 3. There are, however,
numerous cyan pixels (C = G + B = C-S-H + unhydrated C3S)
in Figure 3(b), which indicate unhydrated C3S in those pixels
is transforming to C-S-H; however, there are a few yellow
pixels (Y = R + G = Ca(OH)2 + H). Clearly, the
C-S-H surrounds the unhydrated C3S, along with the formation
of Ca(OH)2. Obviously, the RGB overlay map based on the
O K-edge image stacks is similar to the RGB overlay map
based on the Ca L3,2-edge image stacks. However, in the case
of the O K-edge image stacks, the morphology of the C-S-H gel was more present in the details where the flocculent
C-S-H gel surrounds the unhydrated C3S and Ca(OH)2, in good
accordance with the results for Ca L3,2-edge.
Because RGB overlay maps using Singular Value Decom-position (SVD) can consist of no more than three
compo-nents, the chemical component mapping for unhydrated C3S,
C-S-H, and Ca(OH)2 are shown in Figure 3, and Figure 4
shows the RGB overlay maps with unhydrated C3S, C-S-H
gel, and CaCl2. We observe numerous magenta pixels (M =
R + B = CaCl2+ unhydrated C3S) even at the center of these
unhydrated C3S, which indicates that CaCl2diffuses into the
inside of unhydrated C3S during the transformation from
unhydrated C3S to C-S-H and Ca(OH)2. Interestingly, the
red part (CaCl2) in Figure 4 was not intermingled with the
green part, C-S-H gel, but instead with unhydrated C3S. In
other words, CaCl2coexists with unhydrated C3S instead of
C-S-H in the case of 7-day-hydrated C3S with CaCl2. Calcium
chloride increases the dissolution of C3S for easier diffusion
2 𝜇m (a) N o rm al ized in te n si ty (a.u .) 18401850 1860 1870 1880 Energy (eV) a1 a2 (b) 2 𝜇m (c) 2 𝜇m (d) Core Top Bottom 0.5 𝜇m (e) Core Top Bottom N o rm alized in te n si ty (a.u .) 18401850 1860 1870 1880 Energy (eV) a1 a2 (f)
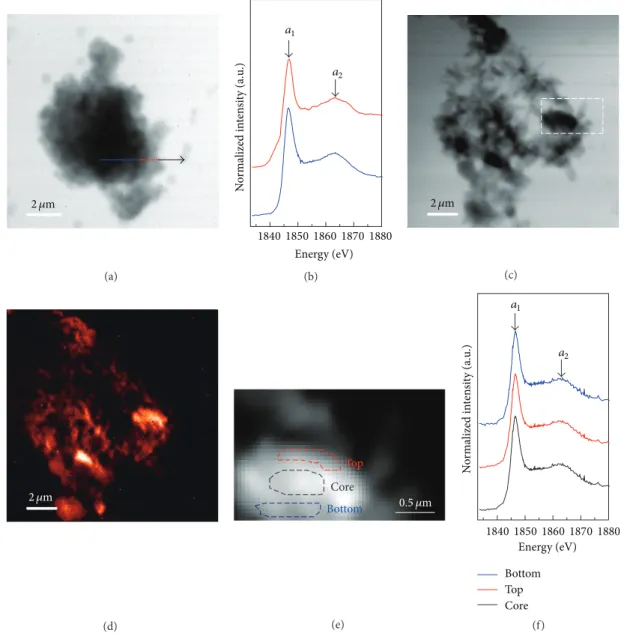
Figure 5: Si K-edge NEXAFS analysis of 7-day-hydrated C3S particles in the presence of CaCl2: (a) single image of one particle taken at 1855 eV, (b) Si K-edge NEXAFS spectra of the line-scan indicated in (a), (c) single image of another particle taken at 1855 eV, (d) image contrast mapping corresponding to (c), (e) selected areas in the image contrast map enlarged partly from (c) for the NEXAFS spectra, and (f) Si K-edge NEXAFS spectra taken from the different locations indicated in (e).
silicon ions away from the particle to form C-S-H gel and Portlandite [2].
The Si K-edge NEXAFS analysis on 7-day-hydrated C3S in
the presence of CaCl2is shown in Figure 5. The flocculent and
the fibrillary hydration product can be observed, respectively, in Figures 3(a) and 3(b). The distribution map of silicon, as seen in Figure 5(d), is the computed optical density between the image taken at the preadsorption edge at 1830 eV and the near-adsorption edge at 1840 eV. With respect to the
hydration of C3S, Ca(OH)2contains no silicon, whereas the
unhydrated C3S and C-S-H have silicon-containing
compo-sition. Figures 5(b) and 5(f) show the Si K-edge NEXAFS spectra of the corresponding line-scan in Figure 5(a) and selected areas in Figure 5(e). Each spectrum consists of
the main peak (𝑎1) and the multiple scattering peak (𝑎2).
Peak 𝑎1 is assigned to the transition of Si 1s electrons to
the antibonding𝑡2 orbital (3p-like state), whereas peak 𝑎2
is qualitatively attributable to the multiple scattering effect beyond the second coordination sphere [29].
The peak positions and energy separation (Δ𝑎2 − 𝑎1)
shown in Table 2 are associated with the degree of poly-merization in the silicates [22]. A line-scan on the floc-culent particle shown in Figure 5(a) was selected to verify the changes from center to boundary, which had similar absorption features to synthetic C-S-H, with 0.66 and 0.95 Ca/Si ratios in previous studies [22]. Three locations (core, top, and bottom) were selected to verify the uniformity of the hydration product in Figure 5(e). These locations had no
(a) (b) 1 6 8 2 4 5 3 9 10 12 13 11 7 Spongy mass Thin sheet (c) 11.5 11.0 10.5 10.0 9.5 9.0 Ca/Si Cl: a to mic ra tio (%) 1.8 2.0 2.2 2.4 2.6 2.8 3.0 3.2 3.4 3.6 1 2 3 4 5 6 7 8 9 10 11 12 13 (d)
Figure 6: (a)∼(c) The morphology of 7-day-hydrated C3S in presence of CaCl2imaged by SEM, (d) SEM-EDS analysis of (c), Cl versus Ca/Si.
Table 2: Peak positions and the energy separation between peak positions of Si K-edge NEXAFS spectra of selected areas in 7-day-hydrated C3S with CaCl2(C and Op denote the core area and outer product of C3S, resp., in Bae et al. [22]).
Peak𝑎1(eV) Peak𝑎2 Δ𝑎2− 𝑎1
Blue line 1846.6 1863.2 16.6 Red line 1846.9 1863.0 16.1 Core 1846.5 1861.9 15.4 Top 1846.5 1861.9 15.4 Bottom 1846.5 1862.0 15.5 Anhydrous C3S∗ 1847.7 1858.9 11.2 Syn-CSH0.66∗ 1846.9 1863.4 16.5 Syn-CSH0.95∗ 1846.7 1863.1 16.4 Syn-CSH1.44∗ 1846.4 1861.5 15.1 Op∗ 1847.4 1862.7 15.4 C∗ 1847.7 1559.4, 1861.5 11.4, 13.8
∗Data from Bae et al. [22].
difference among their absorption features but were similar to Op and synthetic C-S-H, with a 1.44 Ca/Si ratio in
previous studies [22]. Therefore, the hydration product of
C3S with CaCl2 at 7 d in Figure 5(e) had a uniform degree
of silicate polymerization. C3S hydration is a
dissolution-precipitation process [30]; however, CaCl2 accelerated the
rate of nucleation of the hydration product on the surface of
the C3S particles significantly, but CaCl2has relatively little
effect on the growth rate [1]. Hence, after 7 d of hydration of
C3S with CaCl2, the degree of silicate polymerization in the
hydration product was close to that of the 17-day-hydrated
C3S in previous studies [22], thus implying that CaCl2
increases the degree of silicate polymerization, especially in
the case of Ip. Therefore, CaCl2can also facilitate ion diffusion
[31], prompt the dissolution process of C3S, and accelerate the
formation of “inner product” C-S-H [2], ultimately resulting in a higher degree of silicate polymerization at either the core
or the boundary of 7-day-hydrated C3S.
The fracture surface of 7-day-hydrated C3S in the
pres-ence of CaCl2 imaged by SEM is shown in Figure 6.
Thin-sheet C-S-H and the spongy mass C-S-H are observed in Figures 6(a)–6(c). “Honeycomb-like” morphologies of
hydration products in the presence of CaCl2are shown at ages
−60 −70 −80 −90 −100 −110 −120 28 d 7 d 3 d1 d Chemical shift (ppm) Q2 Q3 Q1 Q0 (a) −60 −70 −80 −90 −100 −110 −120 28 d 7 d 3 d1 d Chemical shift (ppm) Q2 Q3 Q1 Q0 (b)
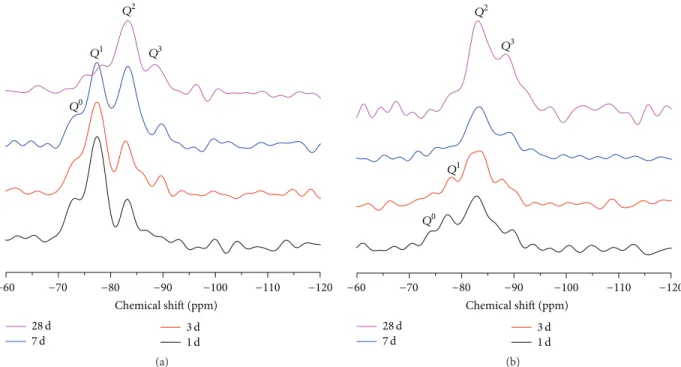
Figure 7:29Si CP/MAS NMR spectra of C3S paste as a function of hydration time in the absence (a) and in the presence (b) of CaCl2.
the Ca/Si ratio for the honeycomb C-S-H ranges between 2.0 and 3.6, whereas that for the spongy mass C-S-H is also
included in the range. CaCl2accelerates the nucleation of the
hydration product on the surface of the C3S particles [1] and
possibly prompts the bridge of the dreierketten silicate chains of C-S-H to develop in the two-dimensional direction into thin-sheet C-S-H.
3.4.29Si MAS NMR Analysis. 29Si CP/MAS NMR was proven
to be very useful for studying the chemical shifts of the cor-responding element. The primary advantage of this method is its high resolution of signals, so the relationship between Si chemical shifts and corresponding assigned structure of
silica unites is easy to establish.29Si CP/MAS NMR plots for
hydrated C3S with different hydration times in the absence
or presence of CaCl2 are shown in Figure 7. To describe
various types of silica unites, we used 𝑄𝑛 (𝑛 ≤ 4) for
the connectivity of SiO4 tetrahedra, where𝑛 represents the
number of bridging oxygen (Si-O-Si): the𝑄0site is isolated
SiO4tetrahedra,𝑄1is SiO4tetrahedra present in end unites
of a silicate chain,𝑄2 is a middle group,𝑄3 is a branching
site, and𝑄4sites link to four other SiO4tetrahedra in a
three-dimensional network. Amorphous C-S-H initially contains
mainly dimeric silicate [33–35], whereas C3S includes nine
inequivalent SiO4tetrahedra (𝑄0sites) between−69 ppm and
−75 ppm [36]. In our analysis, the Gaussian distributions
centered about−75 ppm, −78 ppm, −83 ppm, and −89 ppm
are attributed, respectively, to 𝑄0, 𝑄1, 𝑄2, and 𝑄3 units
[37, 38].29Si CP/MAS NMR could not provide an accurate
quantitative analysis of𝑄𝑛but instead indicated the chemical
shift of the corresponding𝑄𝑛sites. However, for comparison,
the trend for evaluating the fraction of𝑄𝑛could be reflected
by29Si CP/MAS NMR.
Prior to the 7-day-hydration process of C3S without
CaCl2, the discrete SiO4tetrahedra (𝑄0) in unhydrated C3S
transformed to dominant dimers𝑄1and doubly coordinated
tetrahedral 𝑄2 in the hydrated C3S, while there was the
occurrence of𝑄3at 3 days of hydration. However, the𝑄0and
𝑄1peaks maintained the lowest level at 28 d, and the𝑄2peak
became a predominant level. In the presence of CaCl2, the
𝑄2peak played a dominant role in the dreierketten silicate
chain structure after 1 d of hydration, and the 𝑄3 peak at
−89 ppm began to emerge compared with the control group,
as shown. CaCl2is clearly indicated to considerably accelerate
the formation of middle groups (𝑄2) and branch sites (𝑄3) in
the silicate chains of C-S-H gel. CaCl2significantly accelerates
the rate of nucleation of the hydration product deposited
on the surface of the C3S particles but has a relatively
insignificant effect on the growth rate [1], thus explaining why
the𝑄2peaks in the CaCl2group played a leading role in the
dreierketten silicate chain structure. The earlier emergence
of𝑄2and𝑄3peaks of the CaCl2group indicates that CaCl2
accelerates the degree of silicate polymerization in hydrated
C3S in agreement with the above studies of the morphology of
hydrated C3S in the presence of CaCl2. From the perspective
of ionic diffusion, CaCl2 cannot only facilitate diffusion of
ions [31] but also prompt the dissolution process of C3S and
accelerate the formation of “inner product” C-S-H [2], along with a higher degree of silicate polymerization at either the
core or the boundary of 7-day-hydrated C3S.
4. Conclusions
Scanning transmission X-ray microscopy with NEXAFS
spectra offers the possibility of studying the effect of CaCl2
composition information of the systems can easily be deter-mined by STXM with NEXAFS.
The results from the Ca L3,2-edge NEXAFS spectra of C3S
hydration in the presence of CaCl2show that CaCl2does not
change the coordination of calcium within C-S-H. The O
K-edge NEXAFS spectrum for C3S hydration in the presence of
CaCl2indicates that O K-edge NEXAFS is also very useful for
distinguishing the chemical components in hydrated C3S.
The chemical component mapping based on Ca L3,2-edge
and O K-edge NEXAFS spectra and image stacks reveals that the hydration product for C-S-H surrounds the unhydrated
C3S, along with the formation of Ca(OH)2in 7-day-hydrated
C3S in the presence of CaCl2. However, CaCl2coexists not
with C-S-H but with unhydrated C3S. It is possible for CaCl2
to accelerate the dissolution of ions from unhydrated C3S,
which results in increasing the hydration.
The network-cross fibrillary C-S-H gel was observed by STXM with Si K-edge NEXAFS spectra, whereas both the thin-sheet and the fibrillary C-S-H were also observed by
SEM. CaCl2increases the degree of silicate polymerization.
The29Si MAS NMR analysis reveals that the presence of
CaCl2 in hydrated C3S accelerates the formation of middle
groups (𝑄2) and branch sites (𝑄3) in the silicate chains of
C-S-H gel considerably, in agreement with increasing the degree of polymerization of the silicate chains in C-S-H
gel considerably. CaCl2 possibly prompts the bridge of the
dreierketten silicate chains of C-S-H to develop in the two-dimensional direction into crumpled-foil C-S-H.
These findings definitely validate the STXM with NEX-AFS spectra as a significantly powerful tool for investigating the microstructure of cementitious pastes, thus opening the possibility of studying the in situ nanostructure of cementi-tious materials during hydration.
Conflict of Interests
The authors declare that there is no conflict of interests regarding the publication of this paper.
Acknowledgments
STXM data were acquired at beamline BL5.3.2.1 and beamline BL5.3.2.2 at the Advanced Light Source, supported by the Director of the Office of Science, Office of Basic Energy Sciences of the US Department of Energy, under Contract no. DE-AC02-05CH11231. Funding for this project was provided by the National Natural Science Foundation of China (no. 51278157).
References
[1] J. J. Thomas, A. J. Allen, and H. M. Jennings, “Hydration kinetics and microstructure development of normal and CaCl2 -accelerated tricalcium silicate pastes,” Journal of Physical Chem-istry C, vol. 113, no. 46, pp. 19836–19844, 2009.
[2] M. C. G. Juenger, P. J. M. Monteiro, E. M. Gartner, and G. P. Denbeaux, “A soft X-ray microscope investigation into the effects of calcium chloride on tricalcium silicate hydration,” Cement and Concrete Research, vol. 35, no. 1, pp. 19–25, 2005.
[3] P. K. Mehta and P. J. M. Monteiro, Concrete: Microstructure, Properties, and Materials, McGraw-Hill, New York, NY, USA, 4th edition, 2014.
[4] V. K. Peterson and A. E. Whitten, “Hydration processes in tri-calcium silicate: application of the boundary nucleation model to quasielastic neutron scattering data,” Journal of Physical Chemistry C, vol. 113, no. 6, pp. 2347–2351, 2009.
[5] E. M. Gartner, J. F. Young, D. A. Damidot, and I. Jawed, “Hydra-tion of portland cement,” in The Structure and Performance of Cements, J. Bensted and P. Barnes, Eds., chapter 3, Spon Press, London, UK, 2nd edition, 2002.
[6] M. C. G. Juenger and H. M. Jennings, “The use of nitrogen adsorption to assess the microstructure of cement paste,” Cement and Concrete Research, vol. 31, no. 6, pp. 883–892, 2001. [7] J. Skalny, I. Odler, and J. Hagymassy Jr., “Pore structure of hydrated calcium silicates. I. Influence of calcium chloride on the pore structure of hydrated tricalcium silicate,” Journal of Colloid And Interface Science, vol. 35, no. 3, pp. 434–440, 1971. [8] E. M. Gartner, K. E. Kurtis, and P. J. M. Monteiro, “Proposed
mechanism of C-S-H growth tested by soft X-ray microscopy,” Cement and Concrete Research, vol. 30, no. 5, pp. 817–822, 2000. [9] V. S. Ramachandran and R. F. Feldman, “Time-dependent and intrinsic characteristics of portland cement hydrated in the presence of calcium chloride,” Il Cemento, vol. 3, 1978. [10] A. M. Rosenberg, “Study of the mechanism through which
calcium chloride accelerates the set of portland cement,” Journal of American Concrete Institute, vol. 61, pp. 1261–1269, 1964. [11] G. W. Groves, P. J. Le Sueur, and W. Sinclair, “Transmission
electron microscopy and microanalytical studies of ion-beam-thinned sections of tricalcium silicate paste,” Journal of the American Ceramic Society, vol. 69, no. 4, pp. 353–356, 1986. [12] K. E. Kurtis, P. J. M. Monteiro, J. T. Brown, and W.
Meyer-Ilse, “High resolution transmission soft X-ray microscopy of deterioration products developed in large concrete dams,” Journal of Microscopy, vol. 196, no. 3, pp. 288–298, 1999. [13] K. E. Kurtis, P. J. M. Monteiro, J. T. Brown, and W. Meyer-Ilse,
“Imaging of ASR gel by soft X-ray microscopy,” Cement and Concrete Research, vol. 28, no. 3, pp. 411–421, 1998.
[14] J. Ha, S. Chae, K. W. Chou, T. Tyliszczak, and P. J. M. Monteiro, “Effect of polymers on the nanostructure and on the carbona-tion of calcium silicate hydrates: a scanning transmission X-ray microscopy study,” Journal of Materials Science, vol. 47, no. 2, pp. 976–989, 2012.
[15] J. Ha, S. Chae, K. W. Chou, T. Tyliszczak, and P. J. M. Monteiro, “Scanning transmission X-ray microscopic study of carbonated calcium silicate hydrate,” Transportation Research Record, vol. 2142, pp. 83–88, 2010.
[16] S. R. Chae, J. Moon, S. Yoon et al., “Advanced nanoscale char-acterization of cement based materials using X-ray synchrotron radiation: a review,” International Journal of Concrete Structures and Materials, vol. 7, no. 2, pp. 95–110, 2013.
[17] P. J. M. Monteiro, L. Clodic, F. Battocchio et al., “Incorporating carbon sequestration materials in civil infrastructure: a micro and nano-structural analysis,” Cement and Concrete Composites, vol. 40, pp. 14–20, 2013.
[18] D. Hern´andez-Cruz, C. W. Hargis, S. Bae et al., “Multiscale characterization of chemical—mechanical interactions between polymer fibers and cementitious matrix,” Cement and Concrete Composites, vol. 48, pp. 9–18, 2014.
[19] S. Yoon, J. Ha, S. R. Chae, D. A. Kilcoyne, and P. J. M. Monteiro, “X-ray spectromicroscopic study of interactions between NaCl
and calcium silicate hydrates,” Magazine of Concrete Research, vol. 66, no. 3, pp. 141–149, 2014.
[20] G. Johansson, J. Dynes, A. Hitchcock, T. Tyliszczak, G. Swer-hone, and J. Lawrence, “Chemically sensitive tomography at 50 nm spatial resolution using a soft X-ray scanning transmis-sion X-ray microscope,” Microscopy and Microanalysis, vol. 12, supplement S02, pp. 1412–1413, 2006.
[21] Z. Yangquanwei, S. Neethirajan, and C. Karunakaran, “Cytoge-netic analysis of quinoa chromosomes using nanoscale imaging and spectroscopy techniques,” Nanoscale Research Letters, vol. 8, no. 1, article 463, 7 pages, 2013.
[22] S. Bae, R. Taylor, D. Hern´andez-Cruz, S. Yoon, D. Kilcoyne, and P. J. M. Monteiro, “Soft X-ray spectromicroscopic investigation of synthetic C-S-H and C3S hydration products,” Journal of the American Ceramic Society, vol. 98, no. 9, pp. 2914–2920, 2015. [23] A. L. D. Kilcoyne, T. Tyliszczak, W. F. Steele et al.,
“Interferometer-controlled scanning transmission X-ray microscopes at the Advanced Light Source,” Journal of Synchrotron Radiation, vol. 10, no. 2, pp. 125–136, 2003. [24] S. J. Naftel, T. K. Sham, Y. M. Yiu, and B. W. Yates, “Calcium
l-edge XANES study of some calcium compounds,” Journal of Synchrotron Radiation, vol. 8, no. 2, pp. 255–257, 2001. [25] F. M. F. de Groot, J. C. Fuggle, B. T. Thole, and G. A. Sawatzky,
“2p x-ray absorption of 3d transition-metal compounds: an atomic multiplet description including the crystal field,” Phys-ical Review B: Condensed Matter and Materials Physics, vol. 42, no. 9, pp. 5459–5468, 1990.
[26] R. T. DeVol, R. A. Metzler, L. Kabalah-Amitai et al., “Oxy-gen spectroscopy and polarization-dependent imaging contrast (PIC)-mapping of calcium carbonate minerals and biominer-als,” Journal of Physical Chemistry B, vol. 118, no. 28, pp. 8449– 8457, 2014.
[27] T. Nagai, T. Ito, T. Hattori, and T. Yamanaka, “Compression mechanism and amorphization of portlandite, Ca(OH)2: struc-tural refinement under pressure,” Physics and Chemistry of Minerals, vol. 27, no. 7, pp. 462–466, 2000.
[28] H. W. F. Taylor, Cement Chemistry, Thomas Telford, London, UK, 2nd edition, 1997.
[29] D. Li, G. M. Bancroft, M. E. Fleet, and X. H. Feng, “Silicon K-edge XANES spectra of silicate minerals,” Physics and Chemistry of Minerals, vol. 22, no. 2, pp. 115–122, 1995.
[30] J. J. Thomas, H. M. Jennings, and J. J. Chen, “Influence of nucleation seeding on the hydration mechanisms of tricalcium silicate and cement,” Journal of Physical Chemistry C, vol. 113, no. 11, pp. 4327–4334, 2009.
[31] N. B. Singh and P. N. Ojha, “Effect of CaCl2on the hydration of tricalcium silicate,” Journal of Materials Science, vol. 16, no. 10, pp. 2675–2681, 1981.
[32] J. F. Young, R. L. Berger, and F. V. Lawrence Jr., “Studies on the hydration of tricalcium silicate pastes III. Influence of admixtures on hydration and strength development,” Cement and Concrete Research, vol. 3, no. 6, pp. 689–700, 1973. [33] J. J. Beaudoin, L. Raki, and R. Alizadeh, “A29Si MAS NMR
study of modified C-S-H nanostructures,” Cement and Concrete Composites, vol. 31, no. 8, pp. 585–590, 2009.
[34] M. Chloup-Bondant and O. Evrard, “Tricalcium aluminate and silicate hydration. Effect of limestone and calcium sulfate,” in Nuclear Magnetic Resonance Spectroscopy of Cement-Based Materials, P. Colombet, H. Zanni, A.-R. Grimmer, and P. Sozzani, Eds., pp. 295–308, Springer, Berlin, Germany, 1998.
[35] S. A. Rodger, G. W. Groves, N. J. Clayden, and C. M. Dobson, “Hydration of tricalcium silicate followed by29Si NMR with cross-polarization,” Journal of the American Ceramic Society, vol. 71, no. 2, pp. 91–96, 1988.
[36] M. M¨agi, E. Lippmaa, A. Samoson, G. Engelhardt, and A.-R. Grimmer, “Solid-state high-resolution silicon-29 chemical shifts in silicates,” Journal of Physical Chemistry, vol. 88, no. 8, pp. 1518–1522, 1984.
[37] C. E. Tambelli, J. F. Schneider, N. P. Hasparyk, and P. J. M. Monteiro, “Study of the structure of alkali-silica reaction gel by high-resolution NMR spectroscopy,” Journal of Non-Crystalline Solids, vol. 352, no. 32–35, pp. 3429–3436, 2006.
[38] R. J. Myers, S. A. Bernal, R. San Nicolas, and J. L. Provis, “Gener-alized structural description of calcium-sodium aluminosilicate hydrate gels: the cross-linked substituted tobermorite model,” Langmuir, vol. 29, no. 17, pp. 5294–5306, 2013.
Submit your manuscripts at
http://www.hindawi.com
Scientifica
Hindawi Publishing Corporationhttp://www.hindawi.com Volume 2014 Hindawi Publishing Corporation
http://www.hindawi.com Volume 2014 Hindawi Publishing Corporation
http://www.hindawi.com Volume 2014
Hindawi Publishing Corporation
http://www.hindawi.com Volume 2014
Ceramics
Journal ofHindawi Publishing Corporation
http://www.hindawi.com Volume 2014
Nanoparticles
Journal of Hindawi Publishing Corporationhttp://www.hindawi.com Volume 2014
Hindawi Publishing Corporation
http://www.hindawi.com Volume 2014 International Journal of
Biomaterials
Hindawi Publishing Corporation
http://www.hindawi.com Volume 2014
Nanoscience
Journal ofTextiles
Hindawi Publishing Corporation
http://www.hindawi.com Volume 2014
Journal of
Hindawi Publishing Corporation
http://www.hindawi.com Volume 2014
Crystallography
Journal of Hindawi Publishing Corporationhttp://www.hindawi.com Volume 2014
The Scientific
World Journal
Hindawi Publishing Corporationhttp://www.hindawi.com Volume 2014
Hindawi Publishing Corporation
http://www.hindawi.com Volume 2014
Coatings
Journal ofAdvances in
Materials Science and Engineering Hindawi Publishing Corporation
http://www.hindawi.com Volume 2014
Hindawi Publishing Corporation
http://www.hindawi.com Volume 2014
Hindawi Publishing Corporation
http://www.hindawi.com Volume 2014
Metallurgy
Journal ofHindawi Publishing Corporation
http://www.hindawi.com Volume 2014 BioMed
Research International
Materials
Journal of Hindawi Publishing Corporationhttp://www.hindawi.com Volume 2014
N
a
no
ma
te
ria
ls
Hindawi Publishing Corporation
http://www.hindawi.com Volume 2014 Journal of