저작자표시-비영리-변경금지 2.0 대한민국 이용자는 아래의 조건을 따르는 경우에 한하여 자유롭게 l 이 저작물을 복제, 배포, 전송, 전시, 공연 및 방송할 수 있습니다. 다음과 같은 조건을 따라야 합니다: l 귀하는, 이 저작물의 재이용이나 배포의 경우, 이 저작물에 적용된 이용허락조건 을 명확하게 나타내어야 합니다. l 저작권자로부터 별도의 허가를 받으면 이러한 조건들은 적용되지 않습니다. 저작권법에 따른 이용자의 권리는 위의 내용에 의하여 영향을 받지 않습니다. 이것은 이용허락규약(Legal Code)을 이해하기 쉽게 요약한 것입니다. Disclaimer 저작자표시. 귀하는 원저작자를 표시하여야 합니다. 비영리. 귀하는 이 저작물을 영리 목적으로 이용할 수 없습니다. 변경금지. 귀하는 이 저작물을 개작, 변형 또는 가공할 수 없습니다.
의학 박사학위 논문
Interpretation and utilization
of sectioned images and
three-dimensional models of cadaver
(시신 절단면영상과 3차원영상의
분석과 활용)
아 주 대 학 교 대 학 원
의 학 과
Interpretation and utilization
of sectioned images and
three-dimensional models of cadaver
(시신 절단면영상과 3차원영상의
분석과 활용)
지도교수 안 영 환
이 논문을 의학 박사학위 논문으로 제출함.
2020 년 2 월
아 주 대 학 교 대 학 원
의 학 과
Abstract
The importance of anatomical study using cadaver is maintained, in spite of recently advanced medical images including 7 Tesla magnetic resonance images and diffusion tensor imaging. As mobile devices, augmented reality, and three-dimensional printing are widely utilized, digital anatomy has been highlighted for educational and clinical purposes. Among the various methods for anatomical studies, sectioned images and
three-dimensional models of cadaver can be ideal materials for the digital anatomy.
Between the sectioned images and three-dimensional models made in United States, Korea, and China, those made in Korea are considered to have the best quality to be utilized by numerous institutions around the world. However, the interpretation and processing methods of the Korean images have not been improved from the initial stages. Moreover, the image quality should be upgraded for more detailed observations.
The purpose of this study is to three-dimensionally reconstruct and utilize the sectioned images of cadaver with improved methods. Three-dimensional anatomical models will be made into virtual phantom for virtual experiments on electromagnetic wave and radiation. Furthermore, the sectioned images of rhesus monkey and human female head will be produced in improved quality as the fundamental data for neuroscience.
The sectioned images of male whole body, male head, female pelvis, and female whole body were aligned and adjusted while observed on the orthogonal planes. Anatomical structures were segmented while observed on two-dimensional planes and three-dimensional models using iSeg. The sectioned images and segmented images were reconstructed into volume models to be peeled and obliquely sectioned using MRIcroGL. The segmented images were reconstructed into surface models using Mimics and Maya. The surface models were three-dimensionally printed and also made into functionalized models with tissue properties that can be used for virtual experiments. Standardized
three-were automatically segmented using FSL. For producing new sectioned images, donated rhesus monkey and human female head were sectioned at smaller intervals and
photographed in higher resolution.
The interpretation on the three orthogonal planes enabled more accurate inspection of anatomical structures and segmentation of the head, lumbar spine, and hand. Moreover, neuroanatomical structures around the central area of brain, cavernous sinus, and
pallidothalamic tracts were identified. The volume models that could be peeled and piled from the surface were utilized in explaining the anatomy of the whole body, neck, cubital region, femoral region, hand, stomach, and kidney. The volume models were obliquely sectioned to elucidate advanced sectional anatomy in interactive style. The
three-dimensionally printed head model were used in student education, while the functionalized models were officially distributed for the virtual experiments. From the standardized models of head, tendencies of lengths of brain were speculated for each sex and age group and applied to virtual experiments on electromagnetic wave. The new sectioned images of rhesus monkey and human female head that have high resolution enabled the observation of minute structures including nuclei and fibers of brainstem.
The sectioned images and three-dimensional models of this study will contribute to digital anatomy in convergence with augmented reality, virtual phantom, and three-dimensional printing. The sectioned images with real color and high resolution will function as a reference in the interpretation of medical images. In future, the improved digital camera and automatic segmentation algorithm will yield sectioned images and segmented images with improved quality. The images of this study is being shared with other researchers for diverse utilization for anatomy education and research.
Table of contents
Abstract··· i
Table of contents··· iii
List of figures··· v
List of tables··· xiii
I. Introduction··· 1
II. Materials and methods··· 5
A. Sectioned images ··· 5
B. Three-dimensional models ··· 12
1. Volume models··· 12
2. Surface models ··· 17
3. Techniques from medical imaging··· 23
C. Newly produced sectioned images ···30
1. Rhesus monkey images··· 30
2. Female head images ··· 35
III. Results··· 41
A. Sectioned images ··· 41
B. Three-dimensional models ··· 54
C. Newly produced sectioned images ···86
1. Rhesus monkey images··· 86
2. Female head images ··· 92
IV. Discussion··· 97
V. Conclusion··· 105
References··· 106
List of figures
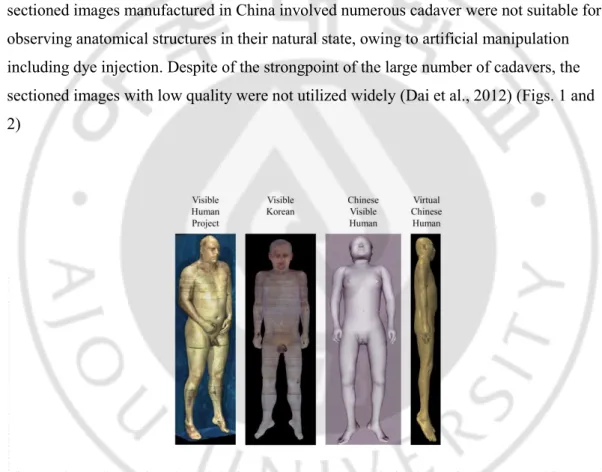
Fig. 1. Sectioned images of pelvis made in United States, Korea, and China.··· 2 Fig. 2. Three-dimensional models from the data sets made in the United States,
China, and Korea. ··· 3 Fig. 3. Visible Korean surface models of male whole body, male head, female pelvis, and female whole body. ··· 4 Fig. 4. Comparison of the sectioned images of male whole body and female
whole body. ··· 7 Fig. 5. Comparison of the sectioned images of female whole body, male head, and the female pelvis. ··· 8 Fig. 6. Production of sagittal sectioned images from horizontal sectioned images using the in-house software named ExSlice. ··· 9 Fig. 7. Reconstructed coronal sectioned images of male head before realignment
(top) and after realignment (bottom). ··· 10 Fig. 8. Sectioned images in 8 bit grayscale displayed for horizontal, coronal, and
sagittal planes using MRIcroGL. ··· 10 Fig. 9. Sectioned image of male head before the level adjustment (top) and after
the level adjustment (bottom) using Adobe Photoshop. ··· 11 Fig. 10. Tracing of linear structure using iSeg software. ··· 12 Fig. 11. Process of making volume models and surface models. ··· 13 Fig 12. Intentional setting of 1 second delay of export action on Adobe Photoshop. ···· 14 Fig. 13. Application of the script to use study time as instance number on
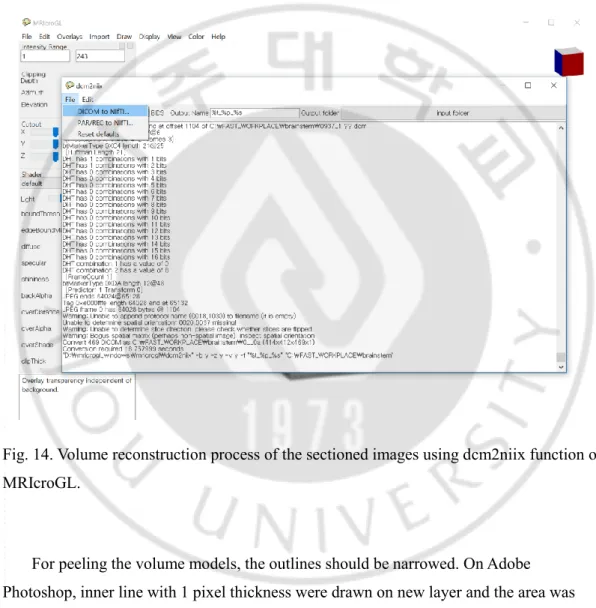
Fig. 14. Volume reconstruction process of the sectioned images using dcm2niix
function of MRIcroGL. ··· 15
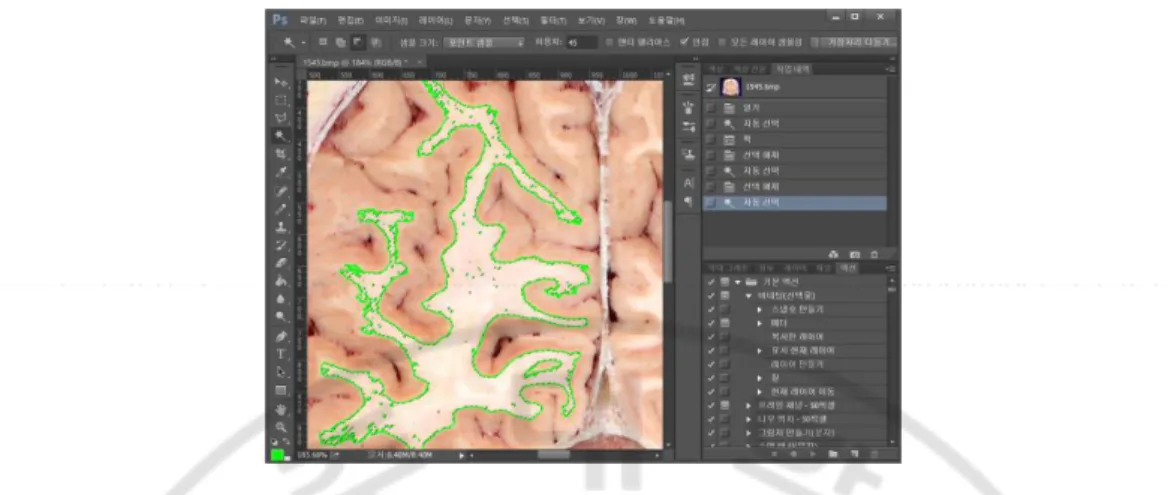
Fig. 15. Segmented area of white matter is peeled by drawing internal green line inside the segmentation zone and selected again. ··· 16
Fig. 16. Depth, azimuth, and elevation of the software MRIcroGL explained on a head figure. ··· 16
Fig. 17. Scripting function of MRIcroGL for making continuous sections. ··· 17
Fig. 18. Manual segmentation using “Lasso tool” function (left) and semiautomatic segmentation using “Magic wand” function (right) of the Adobe Photoshop. ··· 18
Fig. 19. Segmentation outlines being surface reconstructed on Materialise Mimics. ···· 19
Fig. 20 . Surface model with tangled vertices before the amendment (top) and after the amendment (bottom) using Autodesk Maya. ··· 20
Fig. 21. Coronal sectioned image displayed on 3D coordinates space using Autodesk Maya. ··· 21
Fig. 22. Surface model of the brainstem made semitransparent on Adobe Acrobat for the confirmation of its location relationship with the coronal sectioned image. ··· 22
Fig. 23. Serial coronal sectioned images aligned in constant intervals with surface model of the brainstem. ··· 23
Fig. 24. Overall process of the bypass method for the automatic segmentation of the real color images. ··· 24
Fig. 25. FSLeyes for overlapping the registered volume model with Harvard-Oxford atlas of cortical and subcortical structures. ··· 26
Fig. 26. Values and measurement for 29 items on MRIs of 500 subjects. ··· 28
Fig. 27. Length measurement of the female rhesus monkey. ··· 31
Fig. 29. Cryomacrotome without the rotating disc (left) and with the rotating
disc (right). ··· 33
Fig. 30. Frozen monkey grounded by rotating milling disc of cryomacrotome. ··· 34
Fig. 31. Sectioned frozen monkey photographed with digital camera. ··· 35
Fig. 32. Donated female cadaver with radiological marker and alignment lines for the coordinate system regarding the anterior commissure and posterior commissure. ··· 36
Fig. 33. Scanning of the head of the cadaver for MRIs and DTIs (top) and setting optimal parameters (bottom). ··· 37
Fig. 34. Volume model made from MRIs of female head. The volume model is sectioned in horizontal, coronal, and sagittal planes to identify the anterior commissure, posterior commissure, and interthalamic adhesion. ··· 38
Fig. 35. Cadaveric head placed on the embedding box matching the cross line laser with the reference lines on the skin (top) and embedded with the rat and mice for the preliminary settings (bottom). ··· 39
Fig. 36. The embedded and frozen female head sectioned my cryomacrotome (left) and wiped with 99% ethyl alcohol (right). ··· 40
Fig. 37. Horizontal sectioned image of whole head. ··· 42
Fig. 38. Coronal sectioned image of whole head. ··· 43
Fig. 39. Sagittal sectioned image of whole head. ··· 44
Fig. 40. Horizontal sectioned image of lumbar region. ··· 45
Fig. 41. Coronal sectioned image of lumbar region. ··· 46
Fig. 42. Sagittal sectioned image of lumbar region. ··· 47 Fig. 43. Browsing software containing sectioned images (right column) and segmented
Fig. 44. Horizontal sectioned image showing the minute head structures. ··· 49 Fig. 45. Coronal sectioned image showing the minute head structures. ··· 50 Fig. 46. Sagittal sectioned image showing the minute head structures. ··· 51 Fig. 47. Sectioned images showing the anatomical structures around the cavernous sinus on horizontal (1st row), coronal (2nd row), and sagittal (3rd row) planes. ··· 52 Fig. 48. Meningeal layer and periosteal layer of the cavernous sinus identified on the sectioned images. ··· 53 Fig. 49. Pallidothalamic tracts were identified on the coronal images of the male
head. ··· 54 Fig. 50. Gradually peeled volume model of male whole body (top) and browsing software showing anthropological landmarks (bottom). ··· 55 Fig. 51. Volume model of sectioned images showing the surface anatomy (left),
volume model of segmented images (middle), and surface models of the identical cadaver (right). ··· 56 Fig. 52. Peeled volume model showing the internal jugular vein (top), median cubital vein (middle), and femoral artery (bottom) for clinical approach. ··· 57 Fig. 53. Peeled volume of hand showing the hand muscles and bones. ··· 58 Fig. 54. Peeled (top) and piled (bottom) volume models of stomach in correspondence with original sectioned images. ··· 59 Fig. 55. Peeled and piled volume models of stomach observed in endoscopic view (top) and laparoscopic view (bottom). ··· 60 Fig. 56. Browsing software that contains peeled volume model (left) and piled volume models (right) of kidney. The outlines of the volume models are indicated with green line on sectioned image. ··· 60
Fig. 57. Volume model of male whole body sectioned in oblique planes intervening the horizontal, coronal, and sagittal planes. ··· 61 Fig. 58. The oblique plane presenting surgical approach to lumbar spine using transpsoas approach. ··· 62 Fig. 59. Obliquely sectioned volume model showing the 4-chamber view of heart
ultrasound. ··· 63 Fig. 60. Volume model of male head sectioned in oblique planes intervening the horizontal, coronal, and sagittal planes. ··· 64 Fig. 61. The plane that is perpendicular to the electrode for deep brain stimulation (top) and the neuro-ocular plane that is for observing the visual pathway (bottom) made from the volume model of male head. ··· 65 Fig. 62. The entry point (yellow arrow head) and target point (green arrow head) identified on the patients’ computed tomographs (left column), magnetic resonance images (middle column), and cadaver’s sectioned images (right column) ··· 66 Fig. 63. Oblique plane that is perpendicular to the electrode for deep brain stimulation at the target point (top) and 4.6 mm deeper from the target point (bottom). Side effects of inaccurate stimulation are presented in red color font. ··· 67 Fig. 64. Gradually peeled volume model made from head region of the female whole body data set. ··· 68 Fig. 65. The surface models of male whole body in a PDF file. ··· 69 Fig. 66. The surface model models of male whole body demonstrating surgical anatomy of transpsoas approach to lumbar spine. ··· 72 Fig. 67. Surface models of hand structures (1st and 2nd row) overlapped with horizontal sectioned images (3rd row) in a PDF file. ··· 73
Fig. 69. Surface models of the cavernous sinus and nearby cranial nerves displayed in PDF file (top) and sectioned in coronal plane (bottom). ··· 75 Fig. 70. Surface models of surgical triangles around the cavernous sinus view from superior side. ··· 76 Fig. 71. The surface models of the surgical triangles around the cavernous sinus (left column) compared with figures from the neurosurgery textbooks (right column). Surgical approaches including interhemispheric approach (1st row), pterional approach (2nd row), middle cranial fossa approach (3rd row), and retromastoid suboccipital approach (4th row) are demonstrated. ··· 77 Fig. 72. Actual plastic models of the temporal bone, blood vessels, and nervous structures produced by 3D printing. ··· 78 Fig. 73. Surface models of pallidothalamic tracts and thalamic nuclei. ··· 79 Fig. 74. Virtual deep brain stimulation performed on the surface models of
pallidothalamic tracts. ··· 80 Fig. 75. Functionalized models for virtual experiment on electromagnetic wave made from male whole body data set (left) and female whole body data set (right). ··· 81 Fig. 76. Real color sectioned images and real color volume models of the whole area (1st column), brain (2nd column), gray matter (3rd column), and white matter (4th column). ··· 82 Fig. 77. Volume model of the male head before the registration (left), after the registration (center), and overlapped with the Harvard-Oxford cortical and subcortical atlas. ··· 82 Fig. 78. Tendencies drawn from the measurement of the MRIs of 500 subject. ··· 84 Fig. 79. Averaged surface model of cerebrum of a 6-year-old boy (brown) and that of young male (green). ··· 85 Fig. 80. Averaged volume models of head converted from the surface models with measured lengths. ··· 86
Fig. 81. MRIs of living monkey’s head in T1 method (1st row), MRIs of sacrificed monkey in T1 method (2nd row), CTs of sacrificed monkey (3rd row), and sectioned images of sacrificed monkey (4th row). ··· 87 Fig. 82. Horizontal sectioned images of the head region of rhesus monkey. ··· 89 Fig. 83. Coronal plane (left) and sagittal plane (right) reconstructed from original
horizontal sectioned images of rhesus monkey. ··· 90 Fig. 84. Inner ear structures identified on the sectioned images of rhesus monkey (top row) and male human head (bottom row). ··· 91 Fig. 85. Semitransparent surface models of the skin and cerebrum of rhesus monkey overlapped with horizontal and coronal sectioned images. ··· 92 Fig. 86. Sectioned images (1st row), MRIs in T1 method (2nd row), MRIs in T2 method (3rd row), and DTIs (4th row) of female head. The anterior commissure (yellow arrow) and posterior commissure (green arrow head) are identified. ··· 93 Fig. 87. Horizontal sectioned images of female head showing the cerebrum, compared with myelin-stained histologic slides. ··· 94 Fig. 88. Horizontal sectioned images of female head showing the brainstem, compared with myelin-stained histologic slides. ··· 95 Fig. 89. DTI overlapped with the sectioned images showing the anterior thalamic radiation and superior thalamic radiation ··· 96 Fig. 90. Pixel sizes of the new sectioned image of female head (left), previous sectioned image of male head (center), and 7T MRIs (right). The blood vessels, arachnoid mater, and dura mater of the optic nerve are displayed. The new sectioned image shows the least degree of the pixelation thanks to its smallest pixel size. ··· 97 Fig. 91. Reference atlas featuring the sectioned images along with the corresponding 7T MRIs published by Springer. ··· 100
Fig. 92. Schematic figure of the hexahedron model having 6 walls suggested for the cavernous sinus.··· 102 Fig. 93. Surface models of facial bones applied to augmented reality using Android application Sketchfab. ··· 104 Fig. 94. Comparison of areas of cerebrum (red) and hippocampus (green) in the sectioned image of rhesus monkey (left) and that of male human head (right). ··· 105
List of tables
Table 1. Specifications of the four data sets of the Visible Korean.··· 6 Table 2. Optimized tools and parameters for automatic segmentation and volume
reconstruction of true color sectioned images ··· 25 Table 3. The values and measurement agreements for 29 items 50 male and 50 female heads for each age groups. ··· 29 Table 4. Six-hundreds-forty-two anatomical structures that were made into surface models, categorized according to the systems and groups. ··· 69 Table 5. One-hundred seventy-eight anatomical structures that were made into surface models, categorized according to the systems. ··· 74 Table 6. Features of horizontal CT, MRI, and sectioned images of the rhesus monkey. ··· 87 Table 7. Comparison between the previous sectioned images of male head and new
sectioned images of female head. ··· 98 Table 8. Diverse definitions of the walls of the cavernous sinus. ··· 102
I. Introduction
Despite the advancement of medical images including 7T magnetic resonance images (MRIs) and diffusion tensor imaging (DTI) (Thomas et al., 2008; Kleinnijenhuis et al., 2015), anatomical research using cadaver is still important. Cadaveric study can elucidate detailed anatomical structures that cannot be observed with the medical images, despite of their increasing resolution. The developed medical images and cadaver dissection do not replace each other but complement each other. Since medical images with higher
resolution show more anatomical structures, detailed cadaveric study should be preceded for the concrete interpretation of the images. This correlation will be continued for upcoming improvement of the medical images.
In order to keep pace with the medical images, anatomy research methods have been improved in numerous aspects. Plastination technique is not only for public education purpose but also for advanced study on anatomical structures. Improved method of a polyester technique for sheet plastination enabled more detailed observation (Gao et al., 2006). Moreover, the cadavers have been 3D scanned to be measured in length and volume for more diverse dimensions. The tendency to apply digital techniques to anatomy research has been worldwide.
Recently, techniques such as augmented reality and three-dimensional (3D) printing are applied anatomy, which is known as digital anatomy. Newly developed hardware and software can enhance the learning efficiency of the gross anatomy regardless of time and place. The combination of actual cadaver dissection and virtual software dissection can be an ideal method to learn anatomy in limited curriculum duration (Shaffer, 2004).
Even though the computer techniques of drawing and manipulating 3D models are highly developed, students are not interested with 3D volume models with grayscale color and low resolution. The surface 3D models drawn without anatomical background have numerous limitation to be applied to education for medical students, since the models cannot reflect detailed morphology of human organs like muscle attachments and vascular
branches (Petersson et al., 2009).
Among the numerous anatomical research methods, interpretation and three-dimensional reconstruction of anatomical structures using sectioned images are highlighted, since they can be combined with medical images and digital anatomy. The actual color and high resolution of the sectioned images of cadaver cannot be achieved with medical images including MRIs.
Among the sectioned images made in United States (Ackerman, 1998), Korea (Park et al., 2005), and China (Dai et al., 2012), the images made in Korea are considered to have the best quality. The Korean images have smaller intervals, higher resolution and less artifacts from cadaver preparation, freezing, and sectioning. As a result, the Korean images have been utilized by multiple institutes around the world to yield diverse applications (Uhl et al., 2006; Chung et al., 2015) (Fig. 1).
On the other hand, the sectioned images made in the United States had several flaws including missing regions and relatively large sectioning intervals of 0.33 mm, since it was the first attempt. The images made with old digital camera had low resolution and
inadequate contrast for the observation of anatomical structures with less distinct color. The artifacts made during freezing and sectioning procedure were hardly fixed and the artifacts led to inaccurate measurement and observation. Moreover, the images made from Caucasian subjects cannot be applied to Asian population (Ackerman, 1998). The
sectioned images manufactured in China involved numerous cadaver were not suitable for observing anatomical structures in their natural state, owing to artificial manipulation including dye injection. Despite of the strongpoint of the large number of cadavers, the sectioned images with low quality were not utilized widely (Dai et al., 2012) (Figs. 1 and 2)
Fig. 2. Three-dimensional models from the data sets made in the United States, China, and Korea.
The Korean data sets entitled Visible Korean involved four human cadavers: male whole body (Park et al., 2005), male head (Park et al., 2009), female pelvis (Shin et al., 2013), and female whole body (Park et al., 2013). The Visible Korean utilized improved
digital camera while the sectioning intervals were reduced, to increase the resolution of the images. The artifacts made during the procedures of freezing and sectioning were
minimized and optimal environment of lighting and photographing were achieved through repeated trial and error.
The Visible Korean has been the utilized both for research and educational purposes. For research purpose, the images showed the difference between the Caucasian and Asian population by the comparison with the images made in United States. Manual
segmentation that consuming enormous time and effort was done for delineating minute structures including the lumbar nerves (Shin et al., 2001a). For educational purpose, the sectioned images were used for teaching sectional anatomy that is useful in understanding medical images (Shin et al., 2001b).
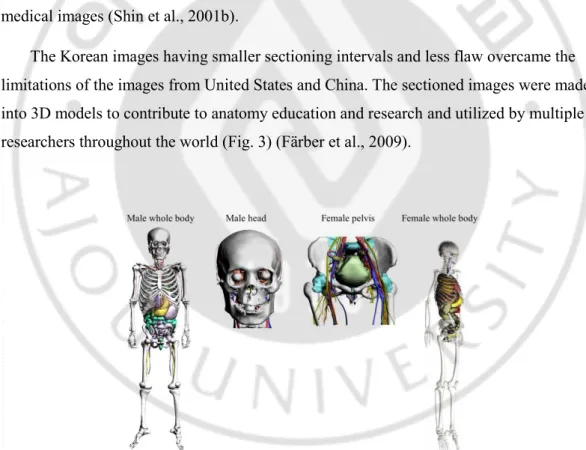
The Korean images having smaller sectioning intervals and less flaw overcame the limitations of the images from United States and China. The sectioned images were made into 3D models to contribute to anatomy education and research and utilized by multiple researchers throughout the world (Fig. 3) (Färber et al., 2009).
Fig. 3. Visible Korean surface models of male whole body, male head, female pelvis, and female whole body.
However, the Korean data sets needed to be improved, in spite of their superior image quality. The interpretation method and processing method required update, so as to provide more realistic and informative views. For the observation of smaller anatomical structures such as nuclei and white matters of brainstem, new data sets with smaller pixel size and sectioning intervals should be produced.
Additionally, to expand the range of application, the technique of the sectioned images was applied to new fields. For the field of neuroscience, the sectioned images of rhesus monkey were produced. For the field of and virtual experiment on electromagnetic wave, functionalized 3D models of human were needed (Neufeld et al., 2018).
The purpose of this study is to three-dimensionally reconstruct and utilize the sectioned images of cadaver with improved methods. The 3D models made from the sectioned image will be used for 3D printing, augmented reality, and virtual experiments. Additionally, new sectioned images of rhesus monkey whole body and human female head with higher image quality will be produced. The high resolution of the new images will be the challenge to the field between macroscopic anatomy and microscopic anatomy. The images of this study will be provided to other researchers to function as the fundamental materials for various fields including anatomy education and neuroscience.
II. Materials and methods
A. Sectioned images
Four existing data sets of Visible Korean were employed for the interpretation: male whole body (Park et al., 2005), male head (Park et al., 2009), female pelvis (Shin et al., 2013), and female whole body (Fig. 2) (Table 1).
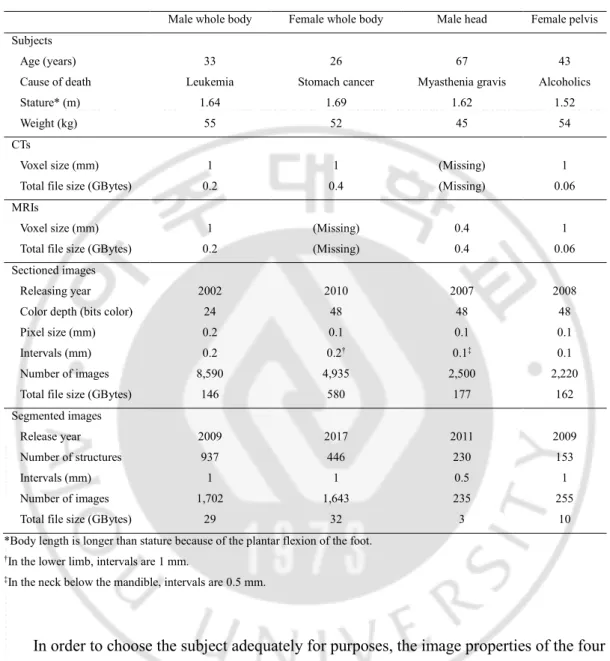
Table 1. Specifications of the four data sets of the Visible Korean.
Male whole body Female whole body Male head Female pelvis Subjects
Age (years) 33 26 67 43
Cause of death Leukemia Stomach cancer Myasthenia gravis Alcoholics
Stature* (m) 1.64 1.69 1.62 1.52
Weight (kg) 55 52 45 54
CTs
Voxel size (mm) 1 1 (Missing) 1
Total file size (GBytes) 0.2 0.4 (Missing) 0.06
MRIs
Voxel size (mm) 1 (Missing) 0.4 1
Total file size (GBytes) 0.2 (Missing) 0.4 0.06
Sectioned images
Releasing year 2002 2010 2007 2008
Color depth (bits color) 24 48 48 48
Pixel size (mm) 0.2 0.1 0.1 0.1
Intervals (mm) 0.2 0.2† 0.1‡ 0.1
Number of images 8,590 4,935 2,500 2,220
Total file size (GBytes) 146 580 177 162
Segmented images
Release year 2009 2017 2011 2009
Number of structures 937 446 230 153
Intervals (mm) 1 1 0.5 1
Number of images 1,702 1,643 235 255
Total file size (GBytes) 29 32 3 10
*Body length is longer than stature because of the plantar flexion of the foot.
†In the lower limb, intervals are 1 mm.
‡In the neck below the mandible, intervals are 0.5 mm.
In order to choose the subject adequately for purposes, the image properties of the four data sets were compared. Owing to the differences of the sex, age, and resolution, each data set had different pros and cons for research.
The male whole body data set and the female whole body data set were compared. The male subject had thicker cranium than the female subject. A part of the stomach of the
was homologous to the female subject’s crus of clitoris. The male subject had more developed hand muscles than the female subject. The resolution of the female images (pixel size, 0.1 mm x 0.1 mm) was better than that of the male images (pixel size, 0.2 mm x 0.2 mm) (Fig. 4).
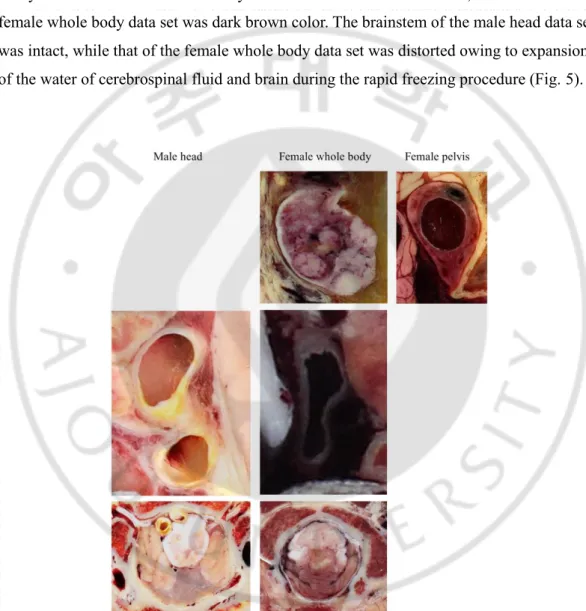
Moreover, the female whole body data set were compared to the male head data set and the female pelvis data set. The female whole body data set had ovarian follicles at every stage thank to young age at death (26 years old), while the female pelvis data set did not owing to menopause at relatively old age at deeath (43 years old). The internal carotid artery of the male head data set was yellow color due to atherosclerosis, while that of the female whole body data set was dark brown color. The brainstem of the male head data set was intact, while that of the female whole body data set was distorted owing to expansion of the water of cerebrospinal fluid and brain during the rapid freezing procedure (Fig. 5).
Fig. 5. Comparison of the sectioned images of female whole body, male head, and the female pelvis.
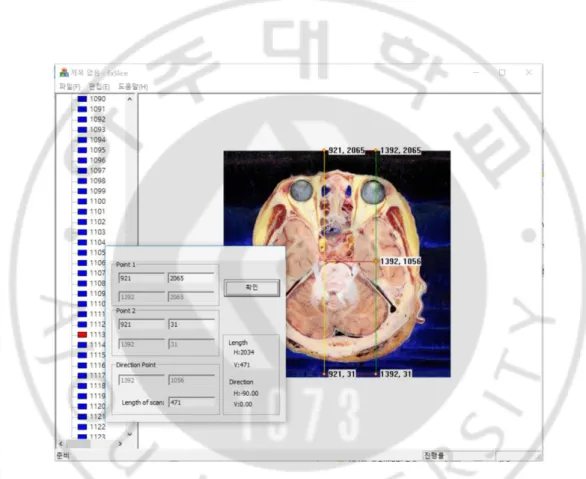
By using the in-house software named ExSlice, the original sectioned images in horizontal plane were reconstructed into coronal and sagittal images. For setting the orthogonal planes, Point 1 and Point 2 for the initial slice and Direction point for the slice progression should be determined. After the determination of the three points, the length of the scan which is the number of the resultant slices were automatically calculated (Fig. 6) (Park et al., 2005).
Fig. 6. Production of sagittal sectioned images from horizontal sectioned images using the in-house software named ExSlice.
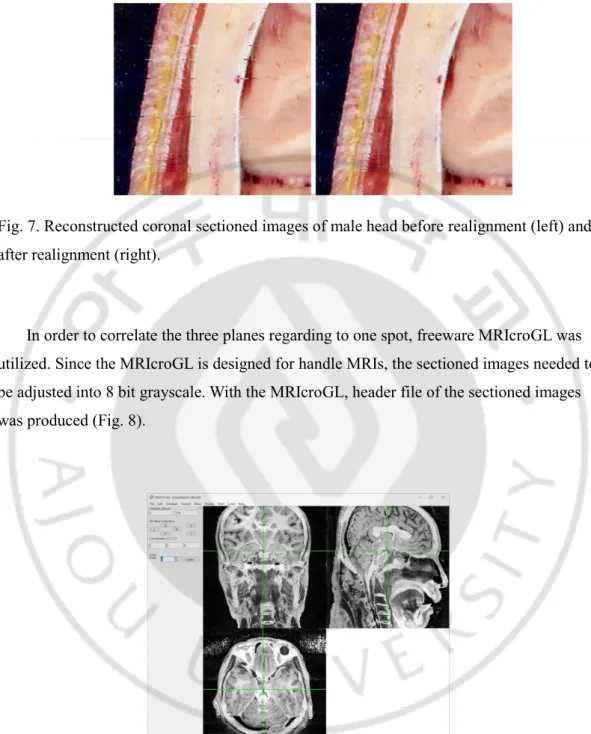
By observing the reconstructed coronal and sagittal planes, misalignments of the serial images caused during the filming process could be found. The misalignments manually amended for the whole data sets repeatedly for further interpretation (Fig. 7)
Fig. 7. Reconstructed coronal sectioned images of male head before realignment (left) and after realignment (right).
In order to correlate the three planes regarding to one spot, freeware MRIcroGL was utilized. Since the MRIcroGL is designed for handle MRIs, the sectioned images needed to be adjusted into 8 bit grayscale. With the MRIcroGL, header file of the sectioned images was produced (Fig. 8).
Fig. 8. Sectioned images in 8 bit grayscale displayed for horizontal, coronal, and sagittal planes using MRIcroGL.
In order to interpret minute structures, the pixel size of the sectioned images should be considered. The pixel size was 0.2 mm in male whole body and female whole body data, while 0.1 mm in male head and female pelvis data. The scope of the structures that can be distinguished by the pixel size were determined for the investigation. Anatomical
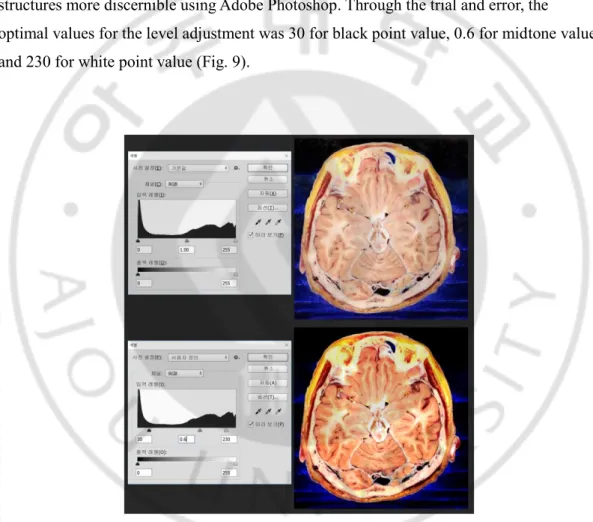
knowledge was necessary to locate and identify the structures at designated locations. For the interpretation, level of the images were properly modified to make the structures more discernible using Adobe Photoshop. Through the trial and error, the
optimal values for the level adjustment was 30 for black point value, 0.6 for midtone value, and 230 for white point value (Fig. 9).
Fig. 9. Sectioned image of male head before the level adjustment (top) and after the level adjustment (bottom) using Adobe Photoshop.
project collaborator was utilized. Since the software provided instant conversion between the segmentation on the horizontal plane and surface model, linear structures like the fornix or blood vessels can be more accurately identified (Fig. 10) (Wood et al., 2017).
Fig. 10. Tracing of linear structure using iSeg software.
B. Three-dimensional models
1. Volume models
The sectioned images and segmented images in two-dimensional plane were stacked and volume reconstructed to make volume models (Fig. 11).
Fig. 11. Process of making volume models and surface models.
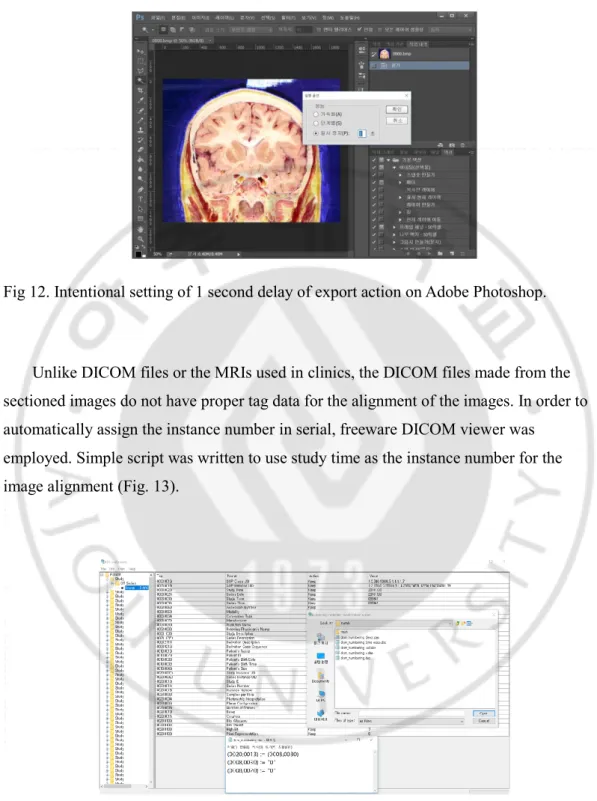
As the first step for making the volume models, the outline of anatomical structures should be manually drawn using Adobe Photoshop. In making the volume models, freeware MRIcroGL was employed on iMAC(OS, High Sierra; Main memory, 12 GB). Since the MRIcroGL is designed for processing MRIs, the sectioned images were adjusted properly. The original voxel sizes (0.2 mm x 0.2 mm x 0.2 mm for whole body; 0.1 mm x 0.1 mm x 0.1 mm for head) were increased to the adequate sizes (1.0 mm x 1.0 mm x 1.0 mm for whole body; 0.5 mm x 0.5 mm x 0.5 mm for head) for real time processing. The images in tagged image file format (TIFF) format were saved in Digital Imaging and Communications in Medicine (DICOM) format using Adobe Photoshop. In order to make the study time different from each other, delay of 1 second was put between the images intentionally (Fig. 12).
Fig 12. Intentional setting of 1 second delay of export action on Adobe Photoshop.
Unlike DICOM files or the MRIs used in clinics, the DICOM files made from the sectioned images do not have proper tag data for the alignment of the images. In order to automatically assign the instance number in serial, freeware DICOM viewer was
employed. Simple script was written to use study time as the instance number for the image alignment (Fig. 13).
The aligned DICOM files were imported to the software MRIcroGL and volume reconstructed. With the serial instance number, the sectioned images were stacked at constant intervals. The volume models were saved as Neuroimaging Informatics Technology Initiative (NIFTI) files (Fig. 14).
Fig. 14. Volume reconstruction process of the sectioned images using dcm2niix function of MRIcroGL.
For peeling the volume models, the outlines should be narrowed. On Adobe Photoshop, inner line with 1 pixel thickness were drawn on new layer and the area was selected with magic wand function. By repeating the procedure, the peeling effect was made (Fig. 15).
Fig. 15. Segmented area of white matter is peeled by drawing internal green line inside the segmentation zone and selected again.
The volume model could be sectioned at desired angle and position by manipulating three parameters: depth, azimuth, and elevation. The three parameters can be understood as the geographic coordinate system of the earth (Fig. 16).
Fig. 16. Depth, azimuth, and elevation of the software MRIcroGL explained on a head figure.
In order to export desired obliquely sectioned plane in constant size automatically, scripting function of the MRIcroGL was employed. The command “clip” was used for setting the depth value and the command “savebmp” was used for exporting (Fig. 17).
Fig. 17. Scripting function of MRIcroGL for making continuous sections.
2. Surface models
For making the surface models, the outline of anatomical structures should be outlined manually using Adobe Photoshop (Fig. 11).
Basically, “Lasso tool” function of the Adobe Photoshop was used for setting the segmented area of each slice. For the structures that have distinguished color from surrounding tissue, “Magic wand” function and “Magnetic lasso tool” function were used for the semiautomatic segmentation (Fig. 18).
Fig. 18. Manual segmentation using “Lasso tool” function (left) and semiautomatic segmentation using “Magic wand” function (right) of the Adobe Photoshop.
For every segmented structure, the outlines made with Adobe Photoshop were exported as black-filled images in bitmap (BMP) files. The black-filled images were imported to Materialise Mimics to be made into a new mask. The threshold was narrowed to select the black color only. The mask was surface reconstructed and exported as stereolithography (STL) files (Fig. 19).
Fig. 19. Segmentation outlines being surface reconstructed on Materialise Mimics.
The surface models were be amended for the more accurate portrayal of anatomical structures using Autodesk Maya. During the previous surface reconstruction process, some vertices were tangled and some surfaces were collided. Tangled vertices of the surface models were straighten up according to the actual shape of anatomical structures. Collided surfaces were smoothen or removed using the “Sculpting tool” function (Fig. 20).
Fig. 20 . Surface model with tangled vertices before the amendment (top) and after the amendment (bottom) using Autodesk Maya.
In order to overlap sectioned images on surface models, the sectioned images should be made into flat 2D object existing in 3D coordinates space. For the process, Autodesk Maya was utilized. In the object menu, simple square object was chosen and executed in desired direction. The width and height of the square was adjusted in proportion to the sectioned images to be inserted. After selecting the object, new attribute was assigned. Among the rendering methods, lambert method was selected to choose file as the color data. By selecting the sectioned images as the file and making the incandescence for the max, the object shows the sectioned images in the 3D coordinates space (Fig. 21).
Fig. 21. Coronal sectioned image displayed on 3D coordinates space using Autodesk Maya.
The sectioned image and surface models should be overlapped accurately in perspective of the anatomical landmarks. Repeatedly, the sectioned image should be resized and moved until all the landmarks correspond to the 3D models. Even after the correction in Maya, the surface models should be loaded on Abode Acrobat to be checked for their accuracy. Making the surface models semitransparent is helpful in adjusting the images properly (Fig. 22).
Fig. 22. Surface model of the brainstem made semitransparent on Adobe Acrobat for the confirmation of its location relationship with the coronal sectioned image.
The sectioned image as a square object can be duplicated as needed. One of the object receives the new attribute as the last sectioned image and moved to last position. By selecting all the object and using snap align function, all the objects are aligned in constant intervals. For the last step, the serial sectioned images are inserted to the object (Fig. 23).
Fig. 23. Serial coronal sectioned images aligned in constant intervals with surface model of the brainstem.
3. Techniques from medical imaging
Among the numerous automatic segmentation algorithm developed for MRIs, FMRIB Software Library (FSL) containing multiple functions was selected for the study. iMAC (OS, High Sierra; Main memory, 12 GB) was employed for the automatic segmentation.
Since the FSL is designed for processing grayscale MRIs, the real color sectioned images cannot be handled. As a solution, the sectioned images were converted to grayscale for the segmentation using FSL and then their masks were combined with real color images. This method of bypass enabled the automatic production of segmented sectioned images in real color (Fig. 24)
Fig. 24. Overall process of the bypass method for the automatic segmentation of the real color images.
To improve the automatic segmentation, the contrast and brightness of the sectioned images was adjusted to resemble a MRI using the Level tool of Adobe Photoshop. As a
in TIFF format were saved in DICOM format using Adobe Photoshop (Fig. 24) (Table 2).
Table 2. Optimized tools and parameters for automatic segmentation and volume reconstruction of true color sectioned images
Steps Software (tool) Optimized values for sectioned images
Results (file format) First
(preparation)
Photoshop (Level, grayscale) - Level adjustment: black point: 50 midtone: 1.0 white point: 230
- Change mode to grayscale
Gray sectioned images of whole area (DICOM)
Second (segmentation)
FMRIB Software Library (FSL)-Brain Extraction Tool (BET)
- Bias field neck cleanup - f value, 0.35
Gray 3D model of brain (NIFTI)
FSL-FMRIB's Automated Segmentation Tool (FAST)
- Class, 2 - MRF, 0.1 - Iteration, 4 - Bias smoothing, 20
Gray 3D models of white matter and gray matter (NIFTI)
In the FSL, Brain Extraction Tool (BET) to extract the brain tissue from the sectioned images. The BET of FSL contained six segmentation algorithms with f value from 0 to 1 could be chosen. Among them, ‘bias field, neck cleanup’ with f value of 0.35 was chosen as the best for brain segmentation, through trial and error (Table 2). The brain of the sectioned images was extracted to yield a volume model of the brain in NIFTI format (Fig. 24).
For the automatic segmentation of the gray matter and white matter, FMRIB's Automated Segmentation Tool (FAST) of the FSL was employed. In the FAST, 2 class method of FAST was chosen rather than the 3 class method (Table 2). The segmented volume models in grayscale were combined with real color sectioned images to yield volume models in real color (Fig. 24).
The gray matter and white matter were separately made into volume models in NIFTI format. The volume models were inspected to check if the segmentation is done properly (Fig. 24).
In order to identify more detailed brain structures, the volume model of the whole brain was registered to MNI152 space (Evans et al., 2012). For the registration, FMRIB's Linear Image Registration Tool (FLIRT) was used. The registered volume model were overlapped with Harvard-Oxford atlas of cortical and subcortical structures using FSLeyes (Fig. 25) (Vergani et al., 2016).
Fig. 25. FSLeyes for overlapping the registered volume model with Harvard-Oxford atlas of cortical and subcortical structures.
For making average head phantoms, 500 subjects were categorized in five age groups and two sex groups: 6-, 9-, 12-, 15-, 20–24-year-olds; females and males. MRIs of the subjects were obtained from a database of Ajou University Hospital. All MRIs were
coils. Images with 5 mm thick sections without an missing gap were acquired. This study was approved by the local Institutional Review Board (AJIRB-BMR-MDB-16-223).
A total of 29 measurements were obtained, including brain size, cranium thickness, and the brain-to-skin distance, which may be influential to electromagnetic absorption in the head (Fig. 26) (Table 3).
Table 3. The values and measurement agreements for 29 items 50 male and 50 female heads for each age groups.
Brain size (1) Horizontal length between the anterior and posterior margin of the brain, same as the longest length from the frontal to occipital lobes
(2) Horizontal anterior–posterior distance from the center of the ear openingc to the foremost margin of the frontal lobe
(3) Horizontal anterior–posterior distance from the center of the ear openingc to the hindmost margin of the occipital lobe
(4) Longest horizontal length from the left margin to the right margin of the brain
(5) Vertical length from the lower margin of the cerebellar tonsil to the highest point of the cerebrum (6) Vertical length from the lower margin of the frontal lobe to the highest point of the cerebrum (7) Vertical length from the lower margin of the occipital lobe to the highest point of the cerebrum (8) Vertical length from the lower margin of the temporal lobe to the highest point of the cerebrum* (9) Vertical distance from the center of the ear opening to the highest point of the cerebrum** (10) Vertical distance from the center of the ear opening to the lower margin of the frontal lobe** (11) Vertical distance from the center of the ear opening to the lower margin of the occipital lobe** (12) Vertical distance from the center of the ear opening to the lower margin of the temporal lobe*,** Cranium
thickness
(13) Bone thickness at the foremost point of the head (14) Bone thickness at the hindmost point of the head
(15) Bone thickness on the lateral side axial plane, 3 cm above the center of the ear opening*,** (16) Bone thickness at the uppermost point of the head
Brain to skin distance
(17) Distance from the brain margin to the foremost margin of the skin (18) Distance from the brain margin to the hindmost margin of the skin
(19) Distance from the brain margin to the lateral margin of the skin on the axial plane, 3 cm above the center of the ear opening*,**
(20) Distance from the brain margin to the uppermost margin of the skin Head size (21) Horizontal length from the anterior to posterior side of the scalp
(22) Longest horizontal distance from the left to the right side of the scalp (23) Vertical length from the ear to the highest point of the scalp
(24) Horizontal anterior–posterior distance from the center of the ear opening to the center of the mouth (25) Vertical distance from the center of the ear opening to the center of the mouth**
(26) Lateral horizontal distance from the center of the ear opening to the lowest margin of the temporal lobe*,**
Mastoid air cell*
(27) Lateral distance from the outermost margin of the mastoid air cell in the temporal bone to the inner ear structure, the margin of the lateral semicircular canal (axial plane)
(28) Shortest distance from the center of the ear opening to the lateral margin of the mastoid air cell** Width of
ear*
(29) Width between the outermost margin of the helix and tragus on the axial plane
* Values were averaged from the measurements taken on the right and left sides. All other values represent the longest distance, regardless of side.
** The center of the ear opening was decided on the axial plane that the bilateral external auditory canal (EAC) was best visible. The center of the ear opening in each image was displayed using the ‘Cross-link’ function, served by PACS at the institution.
All measurement values were arranged to be averaged according to each age group and sex group. The values of the right and left sides were also averaged. The values of the groups were compared using a one-way analysis of variance (ANOVA).
With Autodesk Maya, the sizes of the surface models of head were modified to match the averaged sizes measured from the MRIs. The surface models of each age group were compared to one another. The surface models were converted to volume models using in-house software named Voxel Studio.
C. Newly produced sectioned images
1. Rhesus monkey images
Thanks to the donation from the National Primate Research Center of Korea, a female rhesus monkey (head-to-feet length, 758 mm; weight, 4.3 kg; age, 93 months) was
obtained. The study protocol was reviewed and approved by the Institutional Review Board (IRB) of National Primate Research Center of Korea Research Institute of
Bioscience and Biotechnology (IRB No. KRIBB-AEC-18087). Written informed consent was not required for this study (Fig. 27).
Fig. 27. Length measurement of the female rhesus monkey.
The monkey was scanned for 3T MRIs using both T1 and T2 methods for its head region and whole body (repetition time, shortest; echo time, shortest).
In between the head MRIs and whole body MRIs, the monkey was sacrificed by intramuscular injection of ketamine (10 mg/kg) and intravenous injection of potassium chloride (100 mg/kg). Neither formalin nor dye was injected. The monkey was tied on a plate and the palms were made to face forward for the anatomical position. The feet were fixed to make ankle joint to be in 90 degrees angle. The whole body of the sacrificed monkey was scanned for Computed tomographs (CTs) (voltage, 140 kVp; electric current time, 240 mAs).
The monkey was frozen in a deep freezer at -70 degree Celcius for 7 days. The
monkey was embedded with gelatin solution (water 1,000 ml; gelatin 30 g; methylene blue 0.5 g) in a box. For the preliminary sectioning and light setting, a rat and several mice were placed ahead of the monkey specimen. The box was frozen in a deep freezer at -70 degree Celcius for 7 days (Fig. 28).
Fig. 28. Frozen monkey embedded with gelatin solution in a box.
For the sectioning process, cryomacrotome with a displacement accuracy of 0.001 mm was employed. The cryomacrotome was originally for grinding metal object with rotating disc. The rotating disc included removable metal blades (SFAN1203EFR 883, SECO) for constant grinding of the subject. In order to yield accurate grinding, the balance of the rotating disc were checked every day and the metal blades were changed to new ones for every three days of experiment (Fig. 29).
Fig. 29. Cryomacrotome without the rotating disc (left) and with the rotating disc (right).
The frozen monkey was serially sectioned at 0.05 mm intervals for the head region and at 0.5 mm intervals for the rest of body. The temperature of the room for the sectioning was around 4 degree Celcius using the outside temperature in winter. For every sectioning, frost was removed using 99% ethyl alcohol. Alternative materials for the wiping were tried in the preliminary experiment, but the ethyl alcohol having -114.1 degree Celcius showed the best result. The remaining connective tissues on the sectioned plane were cut with a scalpel (Fig. 30).
Fig. 30. Frozen monkey grounded by rotating milling disc of cryomacrotome.
For the photographing, Canon™ EOS 5Ds R digital single lens reflex (DSLR) camera (resolution, 8,688 x 5,792; color depth, 48 bit color) with a Canon™ EF 100mm f/2.8L Macro IS USM Lens was employed. The digital camera was placed to make field of view of 205 mm horizontal length and 137 mm vertical length which yields pixel size of 0.024 mm × 0.024 mm. Bilateral Elinchrom™ Digital S Strobes with Elinchrom™ Digital 2 power pack were used to provide constant brightness of the photograph surface. Tiffen™ Color Control Patch was placed on the surface and photographed every day for post processing of the sectioned images. Constant photograph parameter (ISO 100; shutter speed 1/250; aperture F/8; manual focus) was used. Every image was inspected by anatomists on a computer monitor and saved in TIFF in Adobe Photoshop. The process was repeated along the whole body of the monkey for 39 days of the experiment (Fig. 31).
Fig. 31. Sectioned frozen monkey photographed with digital camera.
The images underwent post processing to yield consistent alignment, color, and brightness. The horizontal sectioned images were stacked and reconstructed using in-house developed software to produce the coronal and sagittal planes.
2. Female head images
From the body donation program of Ajou University School of Medicine, a female cadaver (age at death, 70 years; no head pathology) was obtained. This study was approved by the Institution Review Board (IRB) of Ajou University School of Medicine (AJIRB-MED-MDB-18-315). Regarding the cadaver donation and further processes, informed consent was acquired from the donor and families (Fig. 32).
Fig. 32. Donated female cadaver with radiological marker and alignment lines for the coordinate system regarding the anterior commissure and posterior commissure.
For head alignment, five radiologic markers were attached midline of the head. Within 24 hours after the death, the head of the cadaver was scanned for 3T MRIs using both T1 and T2 methods (repetition time, 2,500 ms; echo time, 8 ms). Optimal parameters for the MRIs sequencing were determined to yield higher quality of the radiologic images (Fig. 33).
Fig. 33. Scanning of the head of the cadaver for MRIs and DTIs (top) and setting optimal parameters (bottom).
On the MRIs, the anterior commissure and posterior commissure were localized to set the horizontal, coronal, and sagittal planes. On MRIcroGL, the MRIs were volume
reconstructed to find a horizontal plane passing the anterior commissure and posterior commissure. According to the plane, the reference lines were marked on the cadaver head for the alignment. Additionally, the head was also scanned for DTIs (Fig. 34).
Fig. 34. Volume model made from MRIs of female head. The volume model is sectioned in horizontal, coronal, and sagittal planes to identify the anterior commissure, posterior commissure, and interthalamic adhesion.
The cadaver was frozen in a deep freezer at -70 degrees Celsius for 7 days. The head was separated from the rest of body. The head was placed with accurate alignment, by setting the reference lines with cross line laser. The head was embedded in a gelatin solution and frozen again. For the preliminary sectioning and light setting, a rat and several mice were placed ahead of the human head specimen. The box was frozen in a deep freezer at -20 degrees Celsius for 2 days, at -40 degrees Celsius for another 2 days, and -70
degrees Celsius for 3 days, so as to avoid the crushing from rapid expansion of freezing water (Fig. 35).
Fig. 35. Cadaveric head placed on the embedding box matching the cross line laser with the reference lines on the skin (top) and embedded with the rat and mice for the
preliminary settings (bottom).
with a displacement accuracy of 0.001 mm. The serial sectioning was performed at 0.04 mm intervals. The temperature of the room for the sectioning was around 4 degree Celcius using the outside temperature in winter. At every section, frost on the sectioned surface were wiped away using 99% ethyl alcohol. Protruding connective tissues on the surface were removed using a scalpel (Fig. 36).
Fig. 36. The embedded and frozen female head sectioned my cryomacrotome (left) and wiped with 99% ethyl alcohol (right).
For the photographing process, Canon™ EOS 5DsR digital single lens reflex camera and Canon™ EF 100mm f/2.8L Macro IS USM Lens were employed (resolution, 8,688 × 5,792 pixels). The digital camera was placed to yield the field of view with 347.5 mm in horizontal length and 231.7 mm in vertical length on the surface, which corresponds to a pixel size of 0.04 mm x 0.04 mm. Bilateral Elinchrom™ Digital S Strobes with an Elinchrom™ Digital 2 power pack were used so as to provide a constant brightness at the filming area. A Tiffen™ Color Control Patch was placed and photographed every day for post processing of the images. A constant photograph parameters (ISO 100, shutter speed 1/250, aperture F/13, manual focus) were used. The photograph was inspected by
The sectioned images of female head underwent post processing to yield consistent alignment, color, and brightness. The horizontal sectioned images were stacked and reconstructed using in-house developed software to produce the coronal and sagittal planes (Fig. 6).
III. Results
A. Sectioned images
In case of the male head data set, the original horizontal images and reconstructed coronal and sagittal images were observed to identify head structures. The coordinate system regarding the anterior commissure and posterior commissure was employed for setting the horizontal, coronal, and sagittal planes. At the 0 mm position of the orthogonal planes, important brain structures could be identified (Figs. 37, 38, 39) (Park, 2018).
Fig. 39. Sagittal sectioned image of whole head.
In case of the male whole body data set, the original horizontal images and
reconstructed coronal and sagittal images were observed to identify anatomical structures for lumbar spine surgery including transpsoas approach. In case of horizontal plane, representative images were chosen at the level of the intervertebral discs (Figs. 40, 41, 42) (Tubbs, 2019).
Fig. 42. Sagittal sectioned image of lumbar region.
From the male whole body data set, hand structures were observed on horizontal, coronal, and sagittal planes. The sectioned images and color-coded segmented images were put into browsing software which allows automatic identification of the hand structures. The thenar muscles, hypothenar muscles, and carpal bones which have complicated spatial relationship could be identified on the three orthogonal plane (Fig. 43) (Chung et al., 2018).
Fig. 43. Browsing software containing sectioned images (right column) and segmented images (left column). As a representative, the flexor pollicis brevis is automatically identified on horizontal (1st row), coronal (2nd row), and sagittal (3rd row) planes.
identified. Detailed structures of lentiform nucleus and thalmus were distinguished on the horizontal and coronal planes, while numerous structures of brainstem were observed on the sagittal plane (Figs. 44. 45, 46) (Park, 2018).
Fig. 46. Sagittal sectioned image showing the minute head structures.
Among the identified head structures, the cranial nerves and vessels around the cavernous sinus were identified in horizontal, coronal, and sagittal planes. Based on the observation, the cavernous sinus was determined as a hexahedron and six walls of the cavernous sinus were identified on the sectioned images (Fig. 47) (Chung et al., 2015).
Fig. 47. Sectioned images showing the anatomical structures around the cavernous sinus on horizontal (1st row), coronal (2nd row), and sagittal (3rd row) planes. (II, optic nerve; III, oculomotor nerve; IV, trochlear nerve; V1, ophthalmic nerve; V2, maxillary nerve; V3, mandibular nerve; VI, abducens nerve; ICA, internal carotid artery).
layer of dura mater at the cavernous sinus wall were distinguished, which is hardly possible on gross anatomy dissection. Moreover, the meningeal layer of dura mater covering the abducens nerve at the posterior wall of the cavernous sinus were identified (Fig. 48) (Chung et al., 2015).
Fig. 48. Meningeal layer and periosteal layer of the cavernous sinus identified on the sectioned images.
Pallidothalamic tracts were identified on the coronal images. Minute structures like the ansa lenticularis, lenticular fasciculus, and thalamic fasciculus (field H1 of Forel) were identified and segmented for further surface reconstruction (Fig. 49) (Chung and Park, 2019a).
Fig. 49. Pallidothalamic tracts were identified on the coronal images of the male head.
B. Three-dimensional model
1. Volume models
images had file size of 7 MBytes (Chung and Chung, 2019).
The volume model of male whole body were peeled to elucidate surface anatomy. Anthropological landmarks were identified on the volume model and put into browsing software (Fig. 50) (Kwon et al., 2019).
Fig. 50. Gradually peeled volume model of male whole body (top) and browsing software showing anthropological landmarks (bottom).
The volume model of male whole body was used for delineate surface anatomy. The comparison with segmented volume model and surface models enabled stereoscopic
understanding of the anatomical structures. The volume models of sectioned images and segmented images were put into browsing software for automatic identification of the anatomical structures (Fig. 51) (Kwon et al., 2019).
Fig. 51. Volume model of sectioned images showing the surface anatomy (left), volume model of segmented images (middle), and surface models of the identical cadaver (right).
The peeled volume model were used for learning clinical surface anatomy. For instance, the blood vessels that are frequently used for intravenous injection and catheter insertion could be identified on the peeled volume model. The depth from the skin can be measured by peeling the volume model gradually (Fig. 52) (Kwon et al., 2019).
Fig. 52. Peeled volume model showing the internal jugular vein (top), median cubital vein (middle), and femoral artery (bottom) for clinical approach.
Volume model of hand was peeled to explain surface anatomy. Detailed muscular structures could be distinguished on the volume model. The volume model can be freely rotated and peeled using browsing software. Thanks to the segmented data, all the structures could be labeled (Fig. 53) (Chung et al., 2017).
Fig. 53. Peeled volume of hand showing the hand muscles and bones.
Volume model of stomach was peeled and piled to be compared with original sectioned images. Not only the layers of the stomach wall but also the neighboring structures of the stomach could be identified both on volume model and sectioned images (Fig. 54) (Chung et al., 2016).
Fig. 54. Peeled (top) and piled (bottom) volume models of stomach in correspondence with original sectioned images.
The peeled and piled volume models of the stomach were observed from inside to yield endoscopic view and from outside to yield laparoscopic view. From the inside, the lumen, mucosa, muscular layer, serosa, and abdominal wall muscles could be identified (Fig. 55) (Kwon et al., 2015).
Fig. 55. Peeled and piled volume models of stomach observed in endoscopic view (top) and laparoscopic view (bottom).
Additionally, the peeled and piled volume models of the kidney were produced. The peeled volume model showed the internal renal structures such as major calyx, minor calyx, and renal papilla, while the piled volume model showed nearby structures like ascending colon and hepatoduodenal ligament (Fig. 56) (Chung et al., 2016b).
Fig. 56. Browsing software that contains peeled volume model (left) and piled volume models (right) of kidney. The outlines of the volume models are indicated with green line on sectioned image.
The volume model of male whole body was obliquely sectioned using the software MRIcroGL. The oblique planes intervening the horizontal, coronal, and sagittal planes could be used in studying advanced sectional anatomy. By controlling the depth, azimuth, and elevation of the MRIcroGL, the users can yield desired sectioned planes (Fig. 57) (Chung and Chung, 2019).
Fig. 57. Volume model of male whole body sectioned in oblique planes intervening the horizontal, coronal, and sagittal planes.
The oblique plane that intervenes coronal and sagittal planes were employed in presenting surgical anatomy of transpsoas approach to lumbar spine. The anatomical structures along the surgical route such as erector spinae, quadratus lumborum, and kidney
were observed in the oblique plane (Fig. 58) (Tubbs, 2019).
Fig. 58. The oblique plane presenting surgical approach to lumbar spine using transpsoas approach.
The obliquely sectioned volume model was used to elucidate the sectional anatomy of heart ultrasound. Since the volume model was made for the heart region rather than the whole body, the voxel size could be reduced to the original 0.2 mm x 0.2 mm x 0.2 mm. Representative planes such as 4-chamber view and parasternal short axis view were chosen (Fig. 59).
Fig. 59. Obliquely sectioned volume model showing the 4-chamber view of heart ultrasound.
The volume model of male head with voxel size of 0.5 mm x 0.5 mm x 0.5 mm had file size of 98 MBytes. The volume model made from its color-coded segmented images had file size of 33 MBytes. The volume model of head could be sectioned into oblique planes that intervenes the horizontal, coronal, and sagittal planes. The oblique planes of the head volume model could be adjusted by controlling the depth, azimuth, and elevation in the MRIcroGL software (Fig. 60) (Chung and Park, 2019b)
Fig. 60. Volume model of male head sectioned in oblique planes intervening the horizontal, coronal, and sagittal planes.
The volume model of head was sectioned in oblique planes that resembles the planes utilized in clinics. First, the plane that is perpendicular to the electrode for deep brain stimulation was produced. Second, the neuro-ocular plane that is for observing the visual pathway was made using the volume model. Unlike the MRIs, the volume model of the sectioned images showed real color, and the volume model of the segmented images enabled the identification of head structures (Fig. 61).
Fig. 61. The plane that is perpendicular to the electrode for deep brain stimulation (top) and the neuro-ocular plane that is for observing the visual pathway (bottom) made from the volume model of male head.
For clinical application, CTs and MRIs of the patients who had deep brain stimulation surgery were analyzed. The average coordinates of entry point and target point of the deep brain stimulation were found on the real color volume model of sectioned images (Figs. 62, 63).
Fig. 62. The entry point (yellow arrow head) and target point (green arrow head) identified on the patients’ computed tomographs (left column), magnetic resonance images (middle column), and cadaver’s sectioned images (right column)
Fig. 63. Oblique plane that is perpendicular to the electrode for deep brain stimulation at the target point (top) and 4.6 mm deeper from the target point (bottom). Side effects of inaccurate stimulation are presented in red color font.
Additionally, head region of the female whole body data set was made into volume model and gradually peeled to reveal the surface anatomy for plastic surgery. Minute structures like retaining ligaments and subcutaneous veins were identified (Fig. 64).
Fig. 64. Gradually peeled volume model made from head region of the female whole body data set.
2. Surface models
The surface models of male whole body were produced and distributed from the homepage (anatomy.co.kr) free of charge. The surface models were contained in a portable document format (PDF) file for convenient utilization by users on typical personal
computer. The surface models of 642 anatomical structures were classified by the systems in the model tree (Fig. 65) (Table 4) (Shin et al., 2012a).
Fig. 65. The surface models of male whole body in a PDF file.
Table 4. Six-hundreds-forty-two anatomical structures that were made into surface models, categorized according to the systems and groups.
Systems Groups Structures
Integumentary (7) Skin of whole body†, Skin of head, neck†, Skin of trunk†, Skin of upper limb*†, Skin of lower limb*†
Muscular (286) Muscles of head, neck (50) Buccinator*, Masseter*, Temporal muscle*, Lateral pterygoid muscle*, Medial pterygoid muscle*, Longus colli*, Longus capitis*, Anterior scalene muscle*, Middle scalene muscle*, Posterior scalene muscle*,
Sternocleidomastoid muscle*, Rectus capitis anterior*, Rectus capitis lateralis*, Rectus capitis posterior major*, Rectus capitis posterior minor*, Obliquus capitis superior*, Obliquus capitis inferior*, Digastric muscle*, Stylohyoid muscle*, Mylohyoid muscle*, Geniohyoid muscle*, Sternohyoid muscle*, Omohyoid muscle*, Sternothyroid muscle*, Thyrohyoid muscle*
Muscles of back (32) Trapezius*, Latissimus dorsi*, Rhomboid major muscle*, Rhomboid minor muscle*, Levator scapulae*, Serratus posterior superior*, Iliocostalis lumborum*, Rest of iliocostalis*, Longissimus cervicis*, Longissimus capitis*, Rest of longissimus*, Rest of erector spinae*, Splenius capitis*, Semispinalis cervicis*, Semispinalis capitis*, Rest of transversospinalis*
Muscles of thorax, abdomen (24) Pectoralis major*, Pectoralis minor*, Subclavius*, Intercostal muscle*, Diaphragm, Rectus abdominis*, External oblique abdominal muscle*, Internal oblique abdominal muscle*, Transversus abdominis*, Quadratus lumborum*, Levator ani, Coccygeus*