저작자표시-비영리-변경금지 2.0 대한민국 이용자는 아래의 조건을 따르는 경우에 한하여 자유롭게 l 이 저작물을 복제, 배포, 전송, 전시, 공연 및 방송할 수 있습니다. 다음과 같은 조건을 따라야 합니다: l 귀하는, 이 저작물의 재이용이나 배포의 경우, 이 저작물에 적용된 이용허락조건 을 명확하게 나타내어야 합니다. l 저작권자로부터 별도의 허가를 받으면 이러한 조건들은 적용되지 않습니다. 저작권법에 따른 이용자의 권리는 위의 내용에 의하여 영향을 받지 않습니다. 이것은 이용허락규약(Legal Code)을 이해하기 쉽게 요약한 것입니다. Disclaimer 저작자표시. 귀하는 원저작자를 표시하여야 합니다. 비영리. 귀하는 이 저작물을 영리 목적으로 이용할 수 없습니다. 변경금지. 귀하는 이 저작물을 개작, 변형 또는 가공할 수 없습니다.
이학 박사학위 논문
Neural activity in the posterior
thalamus and hippocampus during time
interval discrimination in rats
by
Jihyun Lee
Major in Neuroscience
Department of Medical Sciences
The Graduate School, Ajou University
Neural activity in the posterior
thalamus and hippocampus during time
interval discrimination in rats
A Dissertation Submitted to the Graduate
School of Ajou University in Partial Fulfillment
of the Requirements for Ph.D. in Neuroscience
Supervised by
Min Whan Jung, Ph.D.
Major in Neuroscience
Department of Medical Sciences
The Graduate School, Ajou University
i
ABSTRACT
Neural activity in the Posterior thalamus and Hippocampus
during Time interval discrimination in Rats
Organisms have developed different mechanisms to quantify time over a wide range of durations, from microseconds to daily circadian rhythms. Interval timing, which refers to timing in the range of seconds-to-minutes durations, is a prerequisite for numerous daily behaviors, including the perception and production of speech and dance, as well as estimation of the time that remains before the occurrence of an important event. Currently it is unclear what model of timing best describes temporal processing across seconds and minutes timescales in tasks with different response requirements. Two general models have been described how the passage of time is perceived. One emphasizes that the judgment of the duration of a stimulus depends on the operation of dedicated neural mechanisms specialized for representing the temporal relationships between events. Alternatively, there is no specialized brain system for representing temporal information. In order to investigate whether the distributed model of timing accounts for neural activity underlying interval timing, I examined activity of single neurons recorded from the dorsal CA1 of hippocampus and posterior thalamus in the same rats performing a temporal discrimination task. In this task, the animals were required to discriminate six randomly presented time interval durations ranging from
ii
3018 to 4784 ms into short or long ones to obtain water reward. The probability for the animal to choose the long target increased as a function of the sample duration, and it was well accounted for by a logistic regression model. Diverse types of activity were observed in both areas of the brain, and neuronal ensembles recorded from both areas conveyed significant amounts of information about the passage of time. A larger proportion of neurons conveyed temporal information based on monotonically changing activity profiles in the posterior thalamus than hippocampus. On the other hand, hippocampus was more likely to convey temporal information based on sequential activation of multiple neurons than the posterior thalamus. These results suggest that temporal information processing might be ubiquitous across widespread areas of the brain based on diverse neural processes. These findings are also consistent with the distributed model of timing.
Key words : hippocampus, posterior thalamus, interval timing, bisection
iii
TABLE OF CONTENTS
ABSTRACT ··· ⅰ TABLE OF CONTENTS ··· ⅲ LISTOF FIGURES ··· ⅵ LISTOF TABLES ··· ⅶ I. INTRODUCTION ··· 1 A. Interval timing ··· 3B. Dedicated models of temporal processing ··· 4
C. Distributed models of temporal processing ··· 7
D. Behavioral tasks for interval timing ··· 9
E. Neural mechanisms of interval timing ··· 11
F. Hippocampus and thalamus in the interval timing ··· 14
G. Aims of thesis ··· 15
II. MATERIALS AND METHODS ··· 18
A. Subjects ··· 18 B. Behavioral Task ··· 18 C. Unit recording ··· 21 D. Analysis ··· 23 1. Choice behavior ··· 23 2. Unit classification ··· 23
iv
3. Decoding temporal information ··· 25
4. Neuron-dropping analysis ··· 26
5. Sequential activation ··· 27
6. Multiple linear regression ··· 27
7. Time field ··· 28
E. Statistical analysis ··· 29
III. RESULTS ··· 30
A. Behavioral performance ··· 30
B. Example of neural responses ··· 30
C. Temporal information ··· 37
D. Individual neuronal response ··· 41
E. Response duration ··· 44
F. Multiple linear regression analysis ··· 46
G. Time fields ··· 48
IV. DISCUSSION ··· 50
A. Role of hippocampus in interval timing ··· 50
B. Role of thalamus in interval timing ··· 52
C. Relationship with the other brain region ··· 54
D. Dedicated vs. distributed time models ··· 55
E. Future direction ··· 57
v
REFERENCES ··· 60 국문요약 ··· 75
vi
LIST OF FIGURES
Fig. 1. Temporal bisection task ··· 20
Fig. 2. Examples of tetrode recording ··· 22
Fig. 3. Unit Classification ··· 24
Fig. 4. Choice behavior ··· 32
Fig. 5. Examples of individual activity of hippocampus ··· 33
Fig. 6. Examples of individual activity of thalamus ··· 35
Fig. 7. Neuronal ensemble decoding of choice ··· 39
Fig. 8. Neuronal ensemble decoding of the elapse of time ··· 40
Fig. 9. Example of simultaneously recorded hippocampal and thalamic neurons during the longest sample duration ··· 42
Fig. 10. Neuronal responses of all recorded neurons ··· 43
vii
LIST OF TABLES
Table 1. Neural signals for the elapsed time ··· 47 Table 2. Number of cells with a time field ··· 49
1
I. INTRODUCTION
The dimension of time is essential for everyday behavior and survival. We are aware of the passage of time and we perceive durations, and these experiences are intertwined with affective states and influence decisions about how and when to act (Wittmann and Paulus, 2008; Wittmann, 2009). Due to its importance in everyday activities that include anticipating upcoming events, the interest in how the brain encodes temporal processing has grown over the last decade. The ability to precisely track and tell time is critical across scales spanning over 15 orders of magnitude from the nanosecond accuracy of atomic clocks used for global positioning systems to the tracking of our yearly trip around the sun. Timing intervals on the scale of many hours to a day are mediated by the circadian timing system, while different systems, known as millisecond and interval timing, mediate estimation of time intervals in the ranges of milliseconds and seconds to minutes, respectively (Meck, 2003).
Circadian rhythms operate over the range of the 24-h light-dark cycle, control sleep and wakefulness as well as metabolic, reproductive fitness and secretion of hormones (Czeisler and Klerman, 1999). In addition, photoperiodism, the physiological reaction of organisms to the length of day or night, is vital to both plants and animals, and the circadian system plays a role in the measurement and interpretation of day length. The rhythm strongly relies on light input and other cues that guide a molecular network of
2
regulatory feedback loops controlling gene transcription and translation. One of the major neural structures controlling this rhythm, or the ‘clock’ is located in the suprachiasmatic nucleus (SCN) of the hypothalamus. The SCN receives direct input from specialized retinal ganglion cells, that contain melanopsin as a photo-pigment. Hence, light resets the internal clock to start a new cycle (Aton and Herzog, 2005).
Millisecond timing is crucial for motor control (Edwards et al., 2002), speech generation (Schirmer, 2004) and recognition (Mauk and Buonomano, 2004), playing music (Shaffer, 1984) and dancing (Buhusi and Meck, 2005). In this time range, the striatum and cerebellum might both be activated, possibly contributing to different aspects of performance (Jueptner and Weiller, 1998; Spencer and Zelaznik, 2003) as much of the motion processing in the visual and somatosensry system (Buonomano and Karmarkar, 2002).
The term interval timing is used to describe the temporal discrimination processes involved in the estimation and reproduction of relatively short durations in the seconds-to-minutes range that form the fabric of our everyday existence and unite our mental representations of action sequences and rhythmical structures (Meck, 2003). The interval timing system is a continuous event, cognitively controlled system, requiring attention and is known to be associated with the basal ganglia and related cortical structures. The neural basis of interval timing, despite being fundamental to numerous cognitive processes, remains largely unclear.
3
A. Interval timing
Time perception is a key feature of many biological and behavioral processes. We can identify a variety of human behaviors that may rely on a perception of time in the seconds-to-minutes range. Such behaviors range from perceiving a beat in a musical composition to returning to the stove just prior to the tea kettle whistling; from sensing when to begin a tennis swing based upon the estimation of the approaching ball’s speed to expecting a traffic light to change from red to green. Though many different timescales are relevant for human behavior (Buonomano and Karmarkar, 2002; Buhusi and Meck, 2005), debates exist about the nature of the mechanisms for timing on the order of milliseconds and seconds. One core contention is whether timing in this range occurs via a dedicated mechanism or is distributed throughout different areas (Ivry and Schlerf, 2008). If timing is dedicated, then an interval discrimination task in the somatosensory, visual or auditory modality would use the same group of neurons. Additionally, motor tasks requiring carefully timed responses would also rely on the same system. In this view, timing in the nervous system would be analogous to that in computers, in which a central clock sends out information to many other components of the computer. In contrast, in a distributed system, various regions of the brain would process time, and the brain area responsible for timing would depend on the modality and task at hand. Thus, different parts of the brain would be involved in timing in somatosensory, auditory, visual, or motor tasks
4
(Buonomano and Karmarkar, 2002).
B. Dedicated models of temporal processing
Perhaps the most popular dedicated model of timing is the information processing instantiation of scalar expectancy theory (SET) (Gibbon et al., 1984). SET can explain timing performance regularities, such as the superimposition of normalized response rate distributions, in both humans and animals (Grondin, 2001; Bangert et al., 2011). The paradigmatic example of a SET of time perception is the classic pacemaker-accumulator model (Treisman, 1963; Taatgen et al., 2007; Wittmann, 2013). The pacemaker emits pulses according to some simple distribution. If a switch is closed, these pulses enter the accumulator, which can be reset by another switch. When reinforcement occurs, the number of pulses in the accumulator (transformed by a multiplicative constant) is stored in memory. Thus, memory consists of an increasing number of examples of times of events. The decision process is based on three inputs: the current time (from the accumulator), a remembered time of an event (from a random sample of one element from memory), and a threshold (from a random sample of a distribution threshold).
5
SET can account for human timing performance across a variety of tasks, including analogous to those used in the animal studies (Wearden, 1991; Wearden et al., 1997; Wearden et al., 1998), and tasks specially-developed for human subjects (e.g. temporal production, reproduction, and continuation tapping) (Keele et al., 1985; Ivry and Hazeltine, 1995).
One motivation for dedicated models comes from the observation that our sense of the passage of time appears to transcend the sensory modality of a stimulus. The duration of a tone to a light was compared or the duration of a visual stimulus with a key press was metrically reproduced. Such interactions are
6
less apparent in other perceptual domains; for example, only rare individuals describe the color of a tone. The results of comparing time across different modalities suggest some sort of internal clock (Grondin and Rousseau, 1991; Westheimer, 1999; Ulrich et al., 2006). Behavioral data provide additional support for dedicated models. Individual difference in temporal acuity correlates with the difference between perception and action (Keele et al., 1985). Based on the assumption that this property arises from signal-dependent noise in a common system, these results suggest a dedicated system for timing (Ivry and Schlerf, 2008).
A neural instantiation of a dedicated model is the cerebellar timing hypothesis (Ivry et al., 2002). Patients with cerebellar pathology are impaired on a range of tasks that require precise timing, including perceptual tasks such as judging the duration of brief tones (Ivry and Keele, 1989; Mangels et al., 1998). Similar arguments have been developed for other neural regions that might serve as dedicated timing systems (Meck, 2005). These include the basal ganglia (Harrington et al., 1998a; Rao et al., 2001), supplementary motor area (Coull et al., 2004; Macar et al., 2006) and prefrontal cortex, especially in the right hemisphere (Harrington et al., 1998b; Lewis and Miall, 2006).
Nevertheless, it remains unclear whether dedicated models account for human timing across milliseconds and seconds in both perceptual and motor tasks.
7
C. Distributed models of temporal processing
A large body of recent studies has promoted a more generic view of timing, which is referred to as distributed models. Distributed models – also known as intrinsic models- offer a radically different perspective on the perception of time. These models assume that there is no specialized brain system for representing temporal information, asserting that time is inherent in neural dynamics in different brain areas.
Many studies have compared a single duration across timescales in each within-subjects (Rammsayer and Lima, 1991; Rammsayer, 1999; Droit-Volet, 2002; Lavoie and Grondin, 2004), whereas subsecond-ranges have been used for comparison of durations across tasks because within dedicated models of timing, the system can directly encode short intervals. By contrast, longer intervals require the recruitment of attentional and working-memory processes (Keele et al., 1985; Ivry and Hazeltine, 1995; Mangels et al., 1998; Merchant et al., 2008). In addition, auditory/visual differences were found when durations of auditory and visual stimuli were explicitly compared and when durations from both modalities were mixed in partition bisection (Wearden et al., 2006).
Some of the most compelling evidence for intrinsic timing has come from physiological studies that emphasize modality-specific local representations. In one study neurons in the lateral inferior parietal region (LIP) were recorded during a visual duration discrimination task (Leon and Shadlen, 2003). Two lights,
8
the first of a fixed duration (e.g. 316ms) and the second a variable duration , were presented at fixation. The animal judged the relative duration of the second by making a saccade to one of two peripheral targets. Perceptual judgments were well predicted by the activity of individual neurons. When the target for ‘shorter’ judgments fell within the neuron’s response field, it would exhibit high firing rates at the onset of the second light. If the stimulus persisted, this response dropped off. This parallel between behavior and single-unit activity has been seen with other visual attributes. For example, psychophysical performance on motion perception tasks can be predicted from the activity of neurons in area MT (middle temporal, also known as area V5) (Cohen and Newsome, 2004; Liu and Newsome, 2005). By analogy, Shadlen and colleagues suggest that LIP neurons code the time of behaviorally relevant visual events.
Although modality and task specificity of timing-related neural activity provides strong support for distributed timing, several crucial issues must be addressed. Intrinsic models have difficulty accounting for crossmodal transfer. It is unclear how training on an auditory duration discrimination task would facilitate performance for judging the duration of a visual stimulus. Humans (Warm, 1975) and rats (Roberts, 1982) both show transfer between timing of visual and auditory signals. However, these are not tests for assessing intrinsic models. It is possible that there are some non-temporal components for timing tasks.
9
D. Behavioral tasks for interval timing
Performance in time-perception tasks entails several component processes, many of which are not specific to time (Gibbon et al., 1984). To date few studies of intrinsic timing have addressed which of these processes are affected by training. Thus, many methods have been proposed for assessing the appropriateness of a method may well depend on the range of duratio n under investigation. Traditionally, there are for main methods (Bindra and Waksberg, 1956; Wallace and Rabin, 1960; Zakay, 1993). The method called verbal estimation entails the presentation of a target interval and the requirement that a participant provides a verbal estimation of its duration in the range of seconds or minutes. In the second method, termed reproduction, an experimenter presents a target interval with a continuous sound or flash, for instance, and a participant reproduces the length of the interval by some operation. In the third method, referred to as production, the experimenter specifies a target interval; then, a participant produces the specified interval. The production usually involves two finger ‘taps’ marking the beginning and end of the interval, or pushing a button for a duration that is judged equivalent to the target interval. The fourth method, called the method of comparison, is similar to those used in traditional psychophysics. A participant has to judge and indicate, by pressing the appropriate button, whether the second interval was shorter or longer than the first. The intervals are presented as continuous sounds or by continuous flashes, for instance
10
(Grondin, 2010).
There is a variant of the method of comparison, called the single -stimulus method. Instead of comparing directly two intervals that are presented consecutively, the participant makes a judgment after each in terval presentation, and this judgment involves assigning the interval to one of two categories: short or long. There are some specific variations of this method in the animal timing literature that have been adapted for human experimentation. In a classical one known as bisection method, the shortest and the longest intervals (anchors, or standards) of a series of intervals are first presented several times and are then followed by intervals, including the standards, that have to be categorized as being closer to one of the two anchored standards (Penney et al., 2008; Grondin, 2010). In another procedure, referred to as temporal generalization (Darcheville et al., 1992; Wearden et al., 2007), the central interval (a standard at midpoint) is initially presented several times, and participants should indicate (yes or no) whether subsequent intervals are of the same length as the standard.
Among these tasks, the interference task not only increased variability in time judgments, but also distorted time perception (i.e., affected mean temporal accuracy) in both the temporal reproduction and the generalization tasks. By contrast, any time distortion related to the interference task was not observed in the temporal bisection task (Rattat and Droit-Volet, 2012). This may be due to the fact that the bisection task is less demanding in terms of attentional and working
11
memory resources. Several studies have suggested that, in bisection, participants simply classify the duration as short or long (Rodriguez-Girones and Kacelnik, 2001; Allan, 2002; Droit-Volet and Rattat, 2007), rather than storing the standard durations in reference memory and basing their temporal judgment on the direct comparison of these standards with the probe stimulus duration (Rattat and Droit-Volet, 2012).
E. Neural mechanisms of interval timing
Although there is as yet no clear picture of the manner in which the brain codes elapsed time, there is a fair amount of evidence implicating certain structures in the requisite processing. Studies that are related to the interval timing use various techniques, which range from drug microinjection and ensemble recording in genetically modified and wild-type rodents to functional MRI (fMRI) and positron emission tomography (PET) in neurologically impaired and control humans. These data indicate that time might be represented in a distributed manner in the brain (Buhusi and Meck, 2005).
In humans, an impaired ability to process time in the seconds-to-minutes range is found in patients with disorders that invol ve dopaminergic pathways, such as Parkinson’s disease (Malapani et al., 1998; Malapani et al., 2002), Huntington’s disease (Paulsen et al., 2004) and Schizophrenia (Rammsayer, 1990; Tracy et al., 1998; Volz et al., 2001; Elvevag et al., 2004; Penney et al., 2005).
12
Also, patients with cerebellar damages show deficits in producing discontinuous, but not continuous, movements, indicating that the cerebellum might have a specific role in event-based timing (Ivry et al., 2002; Spencer et al., 2003; Ivry and Spencer, 2004).
To investigate neural mechanisms in humans about temporal processing, there are many types of methods, including the first (Macar et al., 2002) analyzed the imaging method (fMRI/PET), target duration (from 0.3s to 24s), timing procedure (discrimination, production, reproduction, generalization, synchronization, detection of deviants and reproduction of sequences), stimulus modality (visual or auditory) and control conditions of a number of studies. These studies found that many studies report activations of the basal ganglia (Meck et al., 2008), cerebellum (Coull and Nobre, 2008; Coull et al., 2011), the supplementary motor area (SMA) (Vidal et al., 1995; Macar et al., 1999; Ferrandez et al., 2003), and dorsolateral prefrontal cortex (DLPFC) (Jantzen et al., 2007; Wiener et al., 2010; Witt and Stevens, 2013). In other studies, hippocampus (Onuki et al., 2013) and thalamus (Belin et al., 2002; Jantzen et al., 2004; Lewis et al., 2004; Oullier et al., 2005) were found to play a role in the process of temporal memory formation and sub-second motor timing analysis, respectively.
In Animals, temporal control can be carefully studied using an interval timing task (Church, 1984), in which subjects estimate a discrete interval of time. Disrupting nigrostriatal dopamine (Meck, 2006) in the dorsal, but not the ventral
13
striatum (Kurti and Matell, 2011) impaired temporal control in rodents. Overexpression of D2 receptors in the striatum also diminished temporal control of behavior (Drew et al., 2007). Also, prefrontal dopamine from the VTA influences (Vidal et al., 1995) is crucial to timing and stimulation of D1 systems in prefrontal cortex can facilitate temporal control during fixed -interval timing task in rats (Narayanan et al., 2012).
In the search for a potential neural mechanism that underlies the representation of time, various studies using intracranial recordings in the brains of monkeys, rats and pigeons have revealed that climbing neural activation occurs during timing tasks. Single-cell recordings in monkey prefrontal and anterior cingulated cortex showed that, in an implicit timing task, a gradual increase or decrease occurred in the firing rate, which peaked at the time of a response (Niki and Watanabe, 1979). A similar neural activity that increases as a function of interval duration was recorded in the medial premotor cortex of rhesus monkeys (Merchant et al., 2011), posterior parietal cortex (Leon and Shadlen, 2003; Janssen and Shadlen, 2005), preSMA and SMA (Mita et al., 2009). Also, sensory thalamic neurons were shown the ramping activity during delay duration even after changing the delay (Komura et al., 2001; Komura et al., 2005) and time prediction from sequential neural activity in hippocampal CA1 neurons were indicated during a memory task (Itskov et al., 2011; MacDonald et al., 2011; Macdonald et al., 2013).
14
F. Hippocampus and thalamus in the interval timing
Mammals can reliably predict the time of occurrence of an expected event after a predictive stimulus. Sequential and climbing activities are prominent profiles of neural activity observed in brain areas that are related to interval timing (Durstewitz, 2003). Both activities were observed in hippocampus and thalamus in the present study.
It has been proposed that hippocampal pyramidal cells provide information for space (Eichenbaum, 1996; McNaughton et al., 1996; Clark et al., 2005; Shapiro et al., 2006; Jadhav et al., 2012). It is unclear whether hippocampus is involved in interval timing. Recently, several results suggest that hippocampus is related to the interval timing. The lesioned hippocampus in rats interferes working memory of temporal information but not the setting of an internal clock (Meck et al., 1984; Colombo et al., 2001; Kyd et al., 2008; Jacobs et al., 2013).
On the other hand, there are some results that hippocampal neuronal activity conveys temporal information in monkeys (Naya and Suzuki, 2011) and rats (Pastalkova et al., 2008; Itskov et al., 2011; MacDonald et al., 2011; Kraus et al., 2013; Macdonald et al., 2013). Specifically, one of these studies have provided evidence of cells that integrate time as well as dista nce traveled in rats running in place on a treadmill at different speeds. The majority of neurons active on the treadmill fired transiently at specific moments during running, rather than firing continuously the entire time the treadmill was active (Kraus et al., 2013). Also,
15
time cells bridge empty delays in a matching to sample task in head -fixed rats, thus precluding the possibility that time-related activity is due to small variations in location, coincident or planned movement, or path integration (Macdonald et al., 2013). This role in temporal processing may extend to influencing the accuracy and precision of timing in a broad range of situations (Yin and Troger, 2011).
Climbing activity can span widely different time intervals from hundreds of milliseconds (Rainer et al., 1999) up to tens of seconds (Quintana and Fuster, 1999) and has a number of properties that make it a plausible candidate for representing interval timing. Linearly climbing activity of thalamic neurons was found in rats in a trace conditioning protocol where a predictive stimulus precedes a reward by a fixed interval (Komura et al., 2001; Komura et al., 2005). That is, while the maximum firing rate around the expected time of occurrence and the onset time of climbing activity remain the same, the rate at which activity changes increases or decreases as the delay period is reduced or prolonged.
G. Aims of thesis
Understanding how sensory and motor processes are temporally integrated to control behavior in the seconds-to-minutes range is a fascinating problem given that the basic electrophysiological properties of neurons operate on a second timescale (Merchant et al., 2013). In addition, it is unclear that the neural mechanisms of interval timing are governed by dedicated models or distributed
16
models. A large body of studies has suggested that cell activity changes associated with temporal processing in behaving animals are found in the basal ganglia (Jin et al., 2009), prefrontal cortex (Kim et al., 2013), posterior parietal cortex (Leon and Shadlen, 2003), thalamus (Komura et al., 2001; Komura et al., 2005), and hippocampus (Pastalkova et al., 2008; Kraus et al., 2010; Kraus et al., 2013; Macdonald et al., 2013).
Although electrophysiological studies have shown that neural activities of hippocampus and thalamus in rats can be related to interval timing, none of these studies required the animals to keep track of the elapse of time and lacked evidences about timing models (dedicated vs. distributed models) . In the present study, to investigate how the hippocampus and thalamus processes temporal information and whether interval timing is governed by dedicated models or distributed models, I recorded hippocampal and thalamic neuronal activity in the same rats performing a temporal bisection task.
I found that both hippocampus and thalamus conveyed temporal information about the elapse of time, but they did so based on different neural processes. A larger proportion of neurons conveyed temporal information based on monotonically changing activity profiles in the posterior thalamus than hippocampus. On the other hand, hippocampus tended to convey temporal information based on sequential activation of multiple neurons compared with the posterior thalamus. These results suggest that temporal information processing might be ubiquitous across widespread
17
18
II. MATERIALS AND METHODS
A. Subjects
Experiments were performed with five young male Sprague -Dawley rats (approximately 9-11 weeks old, 300-380g). Upon arrival, the animals were individually housed in a colony room and initially allowed free access to food and water. They were then subjected to water deprivation (maintained at > 80% ad libitum body weight) with extensive handling for at least one week. Once behavioral training began, they were allowed to have access to water only during two daily behavioral sessions. The experimental protocol was approved by the Ethics Review Committee for Animal Experimentation of the Ajou University School of Medicine, Korea.
B. Behavioral task
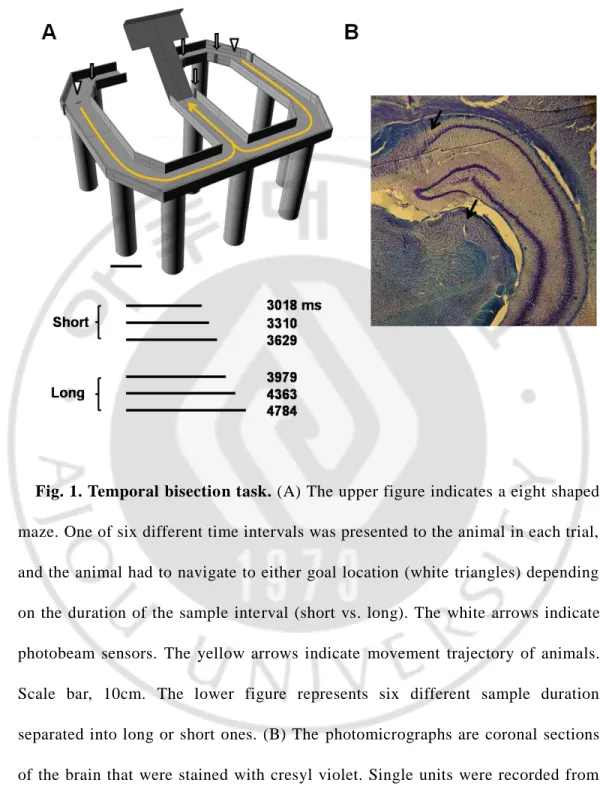
The animals performed temporal discrimination task on a modified T-maze (63 69 cm, elevated 30cm from the floor; 8cm wide track with 2.7cm walls around the track except the central connecting bridge; Fig. 1). Animals were required to discriminate six different durations of time intervals into short or long periods to obtain water reward (Kim et al., 2013). A new trial began when the animal came back from either goal location (Fig. 1, white triangles) to the central arm via the lateral alley and broke the central photobeam (Fig. 1, white arrows).
19
The beginning of a time interval was signaled by a brief auditory tone (2kHz, 200ms) when the animal broke the central photobeam. The end of a time interval was signaled by lowering the central bridge that allowed the animal to navigate to either goal location (Fig. 1, yellow arrows). Six different durations of the time interval, which were spaced evenly on a logarithmic scale, were programmed to be presented in equal probability for a total of 245 trials in random order, and the animals performed 179~260 (mean SD, 245.6 9.7) trials per session. The animal had to navigate to one designated goal (left, n = 2 animals; right, n = 3 animals) when a short (3018, 3310, 3629 ms) interval was presented, and navigate to the opposite goal when a long (3979, 4363, 4784 ms) interval was presented to obtain water reward (20㎕). The presentation of sample intervals, delivery of water, and raising/lowering of the central bridge were automatically controlled by a personal computer using LabView software (National Instruments). The animals were trained to perform the task as previously described (Kim et al., 2013) over the course of 30 days before electrode implantation. They were further trained for 14 days after recovery from the surgery. Thus, the animals were well trained in the task by the time unit recordings began. Also, before each recording session, the animals went through 10 practice trials that consisted of the shortest (3018ms) and the longest (4784 ms) intervals only (5 trials each).
20
Fig. 1. Temporal bisection task. (A) The upper figure indicates a eight shaped maze. One of six different time intervals was presented to the animal in each trial, and the animal had to navigate to either goal location (white triangles) depending on the duration of the sample interval (short vs. long). The white arrows indicate photobeam sensors. The yellow arrows indicate movement trajectory of animals. Scale bar, 10cm. The lower figure represents six different sample duration separated into long or short ones. (B) The photomicrographs are coronal sections of the brain that were stained with cresyl violet. Single units were recorded from the dorsal CA1 of hippocampus (upper black arrow) and posterior thalamus (lower black arrow).
21
C. Unit recording
Twelve tetrodes were chronically implanted in the left or right dorsal CA1 (5.3 mm posterior and 3.2 mm lateral to bregma) under deep anaesthesia with sodium pentobarbital (50 mg/kg). Unit signals were recorded from the dorsal CA1 (2 ~ 2.5 mm depth), posterior thalamus (4 ~ 6 mm depth; Fig. 1), while the animals were performing a temporal discrimination task.
Tetrodes were fabricated by twisting four strands of polyimide -insulated nichrome wires (H.P. Reid CO. INC. PALM COAST. FLA. 32137) together and gently heated to fuse the insulation (final overall diameter: ~40 ㎛). The electrode tips were cut and gold-plated to reduce impedance to 0.3 ~ 0.5 ㏁ measured at 1KHz. Unit signals were amplified with a gain of 10,000 filtered between 600 and 6000 Hz, digitized at 32 KHz and stored on a personal computer using a Cheetah data acquisition system (Neuralynx). Unit sign als were recorded with the animals placed on pedestal (resting period) for 10 min before experimental sessions to examine the stability of recorded unit signals. The
animal’s head position was monitored by tracking a set of light-emitting diodes mounted on the headstage at 30 Hz. When recordings were completed, small marking lesions were made by passing an electrolytic current (50 μA, 30s, cathodal) through one channel of each tetrode and recording locations were verified histologically as previously described (Baeg et al., 2001) (Fig. 1).
22
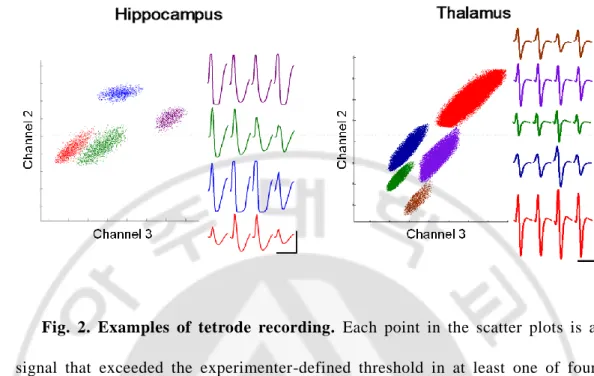
Fig. 2. Examples of tetrode recording. Each point in the scatter plots is a signal that exceeded the experimenter-defined threshold in at least one of four electrode channels. The abscissa and ordinate indicate the energy of spike signals recorded through two different electrode channels. Indi vidual clusters are indicated in different colors. Four-channel average spike waveforms are shown for each cluster in corresponding color on the right. Calibration: 1 ms and 0.1 mV.
23
D. Analysis
1. Choice behavior
Animal’s choice data were averaged according to sample interval duration across all sessions for each animal and subject to the following logistic regression:
Where is the proportion of long-target choice trials, T denotes the sample
interval duration, and a and b are constants.
2. Unit classification
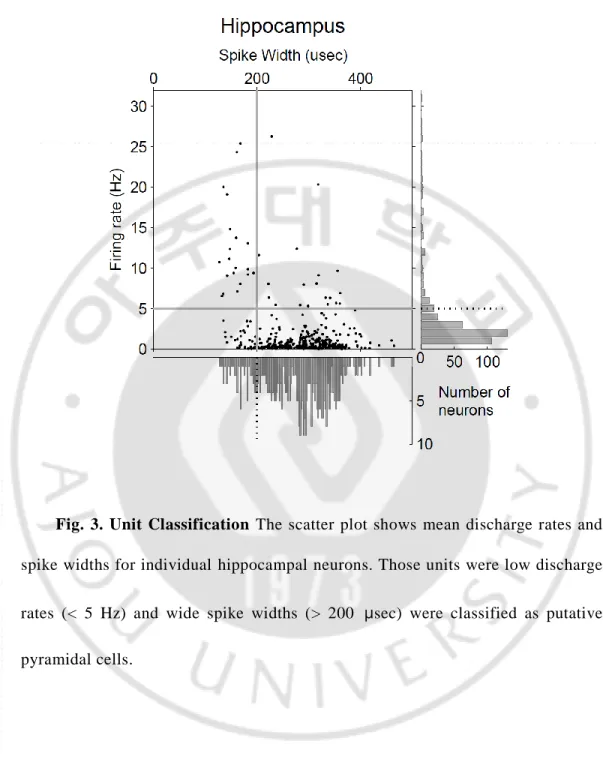
Unit signals were isolated by manual cluster cutting of various spike waveform parameters using the MClust software (A.D. Redish, Department of neuroscience, University of Minnesota, Minneapolis, USA) (Lee et al., 2009). Only those clusters that were clearly separable from each other and from background noise throughout the recording session were included in the analysis. Recorded unit signals in hippocampus were classified into putative pyramidal cells and putative interneurons based on mean discharge rate and spike width (Fig. 2). Although both types of neurons were included in the analysis, essentially the same results were obtained when putative interneurons were excluded from the analysis (data not shown). The proportion of GABAergic neurons in thalamus are less than 1 % (Winer and Larue, 1996). Therefore interneurons of thalamus were not classified.
24
Fig. 3. Unit Classification The scatter plot shows mean discharge rates and spike widths for individual hippocampal neurons. Those units were low discharge
rates (< 5 Hz) and wide spike widths (> 200 μsec) were classified as putative pyramidal cells.
25
3. Decoding temporal information
Temporal information transmitted by neural activity was assessed by examining (1) how well neural activity classified the length of sample intervals as either short or long (length classification) and (2) how well the neural activity kept track of the elapse of time (decoding elapsed time) using a linear discriminant analysis. For the former, neural activity during the last 500 ms of each sample interval was analyzed and, for the latter, each time interval was divided into 10 equal-duration bins (on a linear time scale; e.g., 478.4 ms each for the longest sample interval) and the order of the middle eight bins was decoded based on neural activity within each bin. Decoding of temporal information was based on individual neuronal activity (single neuron decoding) as well as neuronal ensemble activity (population decoding). For the latter, temporal information was decoded based on simultaneously recorded as well as all recorded units that were pooled across sessions (with mean firing rate 0.1Hz in hippocampus and posterior thalamus during sample interval presentation). For decoding elapsed time based on all recorded units, the number of correct trials was equalized across sessions according to the smallest number of correct trials per session for each interval duration (22∼50 trials for hippocampus; 19∼52 trials for thalamus; Fig. 7). For length classification based on all recorded units, the number of correct trials was additionally equalized across sample interval durations (n = 21 for hippocampus; n = 20 for thalamus). For the comparison of correct and error trials
26
based on all recorded units (Fig. 8), the numbers of correct as well as error trials were equalized across sessions.
A single trial was removed, and a linear discriminant function was generated based on the neural activity in the remaining correct trials separated according to the animal's goal choice (for length classification) or bin number (for decoding elapsed time). This procedure was repeated for all correct trials (and also error trials when comparing neural activity during correct and error trials) and the percentage of long-target choice (i.e., classification of a sample interval into a long duration, Plong; length classification) or decoding error (i.e., the distance
between the actual and decoded bin numbers; decoding elapsed time) was calculated. Neural population decoding was based on the assumption of independence among neurons unless noted otherwise. Behavioral decoding was performed in the same manner except that a behavioral index (mean X-position, mean Y-position, and/or overall displacement) was used instead of neural data.
4. Neuron-dropping analysis
To assess the relationship between the size of hippocampal and posterior thalamic neuronal ensemble and the amount of temporal information, the number of neurons in the ensemble was systematically reduced (Wessberg et al., 2000). The same decoding analyses were repeated 100 times after randomly dropping a given number of neurons from the original ensemble, and mean correct
27
classification of interval durations (percentage correct; length classification) or mean decoding error (the distance between the actual and predicted bins; decoding elapsed time) was calculated for each step of neuron dropping.
5. Sequential activation
To examine activity of hippocampal neural populations, a spike density function (σ = 100 ms) for the longest sample interval for each neuron was generated, and divided it into 50ms bins, and normalized by their maximum. Mean rate histograms of all neurons within each the longest sample interval trial were ordered according to the latencies of peak firing rates of individual neurons.
6. Multiple linear regression
Dependence of individual neuronal activity on time was examined in two different ways. First each sample interval was divided into 10 equal -duration bins on a linear time scale and mean discharge rate of a neuron within each time bin was related to time since interval onset. This analysis was repeated for each interval duration separately (n = 6). Second, mean discharge rate of a neuron during the last 500 ms of each sample interval was related to time since interval onset. For both analyses, to examine whether individual neuronal activity was better explained by the elapse of time on a linear or logarithmic time scale, neuronal activity was related to raw (to check linear time encoding) as well as
28
log-transformed (to check logarithmic time encoding) time since interval onset. To factor out potential influences of confounding behavioral variables, the regression model included movement-related variables and the animal's previous goal choice as represented the following multiple regression model;
S = a0 + a1T + a2PC + a3X + a4Y + a5D + , (eq.1)
Where S indicates trial-by-trial spike discharge rate of one neuron within a specific time window (during the last 500 ms or 1 of 10 equal -duration bins of a sample interval); T represents raw or log-transformed time since the interval onset;
X,Y and D denote animal’s mean lateral head position (X-position), mean vertical
head position (Y-position), and overall movement (displacement), respectively, in the corresponding analysis time window; PC represents the animal’s goal choice in the previous trial (dummy variable of -1 and 1 for the left and right goal choice, respectively); is error term; and a0~ a5are the regression coefficients.
7. Time field
Firing rate of profile of each neuron triggered at the beginning of sample intervals was calculated from action potentials generated during animal ’s behavior. In order to distinguish place field of hippocampal neurons, “time fields” were defined as the areas of an increased firing rate in a given sample interval. To
identify a time field, a spike density function (σ = 100 ms) for the longest time interval for each neuron was generated, and divided it into 50ms bins. A time field
29
was defined as the minimum 5 adjacent bins with mean firing rate in each bin > 1.5 SD above the mean. The width of individual fields was determined by the duration between the maximum and half-maximum of each neuron’s spike density function during the longest sample interval (4784 ms). When the maximal activity was located in the middle of the interval so that two estimates of maximal -half maximal duration were available, the longer one was taken.
E. Statistical tests
Student’s t tests were used to test statistical significance of mean decoding error and regression coefficients. Binomial tests were used to test significance of the fraction of correct neural classification and the number of neurons that significantly modulated their activity according to linear or logarithmic passage of time. 2tests were used to test whether numbers whose activity was preferentially explained by logarithmic versus linear passage of time significantly deviated from an even distribution. A p value < 0.05 was used as the criterion for a significant statistical difference. Data are expressed as mean SEM unless noted otherwise.
30
III.
RESULTS
A. Behavioral Performance
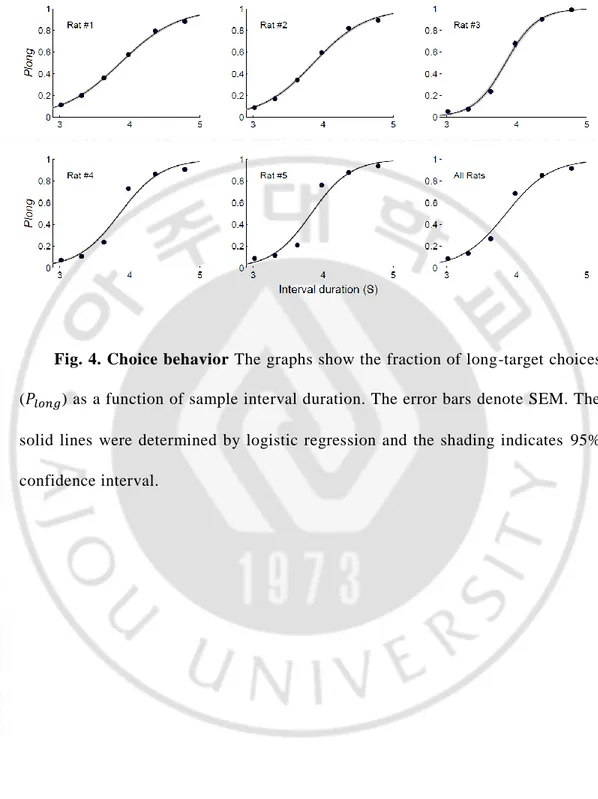
Activity of single neurons was recorded from the hippocampus and thalamus (Fig. 4) of five rats performing a time interval discrimination task (Fig. 1). In this task, the animals had to discriminate six different durations of time interval that were presented in random order into long (3979 ms) or short (3629 ms) ones and navigate to the corresponding goal locations to obtain water reward (Fig. 1). The probability for the animal to choose the long target ( ) increased as a function of the sample interval duration, which was well accounted for by a logistic regression model (R2 = 0.81±0.005; Fig. 4). The animals chose the correct target in 82.6 0.07% of trials.
B. Example of Neuronal responses
A total of 411 and 459 well isolated single units were recorded in this task and the majority were putative pyramidal cells (n = 330, 80.3%; Fig. 3) in hippocampus. Since, it is unclear to discriminate putative pyramidal cells from putative inhibitory neurons in thalamic single units, all 459 well isolated single units were used for all analyses. Of these, only those units with mean firing rate ≥ 0.1 Hz during sample interval presentation were subject to analysis. Diverse types of neuronal activity profiles were observed during sample interval
31
presentation in hippocampus and thalamus (Fig. 4-5, respectively). Of these, a number of single units were a monotonically changing activity profile (“ramping activity”) (Bodner et al., 1997; Durstewitz and Seamans, 2006); many neurons gradually increased or decreased their activity over time.
32
Fig. 4. Choice behavior The graphs show the fraction of long-target choices ( ) as a function of sample interval duration. The error bars denote SEM. The solid lines were determined by logistic regression and the shading indicates 95% confidence interval.
34
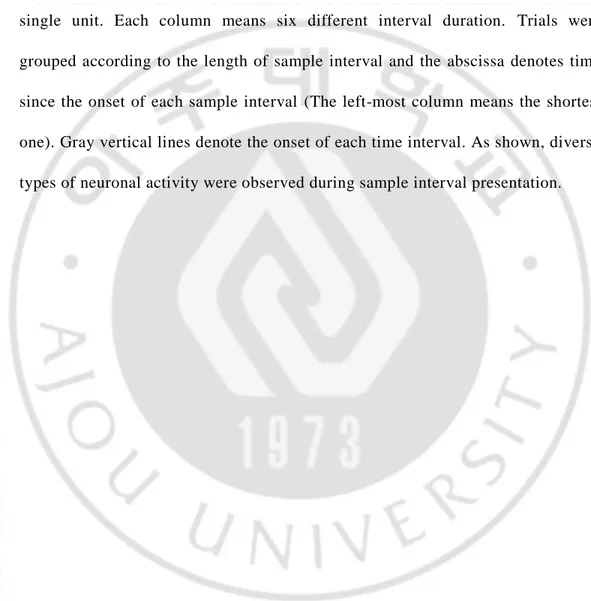
Fig. 5. Examples of individual activity of hippocampus Spike raster and
spike density functions (σ = 100 ms) are shown for example hippocampus. The two rows (upper row is raster plot; lower row is spike density functions) represent single unit. Each column means six different interval duration. Trials were grouped according to the length of sample interval and the abscissa denotes time since the onset of each sample interval (The left-most column means the shortest one). Gray vertical lines denote the onset of each time interval. As shown, diverse types of neuronal activity were observed during sample interval presentation.
36
Fig. 6. Examples of individual activity of thalamus Spike raster and spike
density functions (σ = 100 ms) are shown for example thalamus. The two rows (upper row is raster plot; lower row is spike density functions) represent single unit. Each column means six different interval duration. Trials were grouped according to the length of sample interval and the abscissa denotes time since the onset of each sample interval (The left-most column means the shortest one). Gray vertical lines denote the onset of each time interval. As shown, diverse types of neuronal activity were observed during sample interval presentation.
37
C. Temporal Information
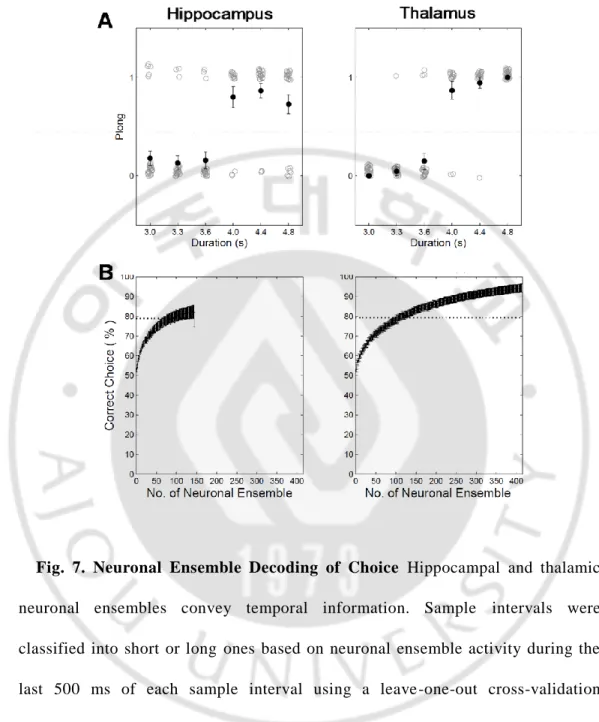
Hippocampal and thalamic neurons with mean firing rate ≥ 0.1 Hz during sample interval presentation (n = 147, 413; respectively) were subject to analysis, and only correct trials were analyzed unless noted otherwise. I examined whether hippocampal and thalamic neurons transmitted information on the elapse of time. This was done in two different ways. First, Sample intervals were classified into short or long ones based on neuronal ensemble activity during the last 500 ms of each sample interval using a leave one out cross validation procedure (length classification). Length classificationbased on all recorded units across sessions (n = 147, hippocampus; n = 413, thalamus) assuming independence among neurons was significantly above chance level (80.0% correct; binomial test, p << 0.01,hippocampus; 95.1% correct; binomial test, p << 0.01, thalamus ; Fig. 7A).
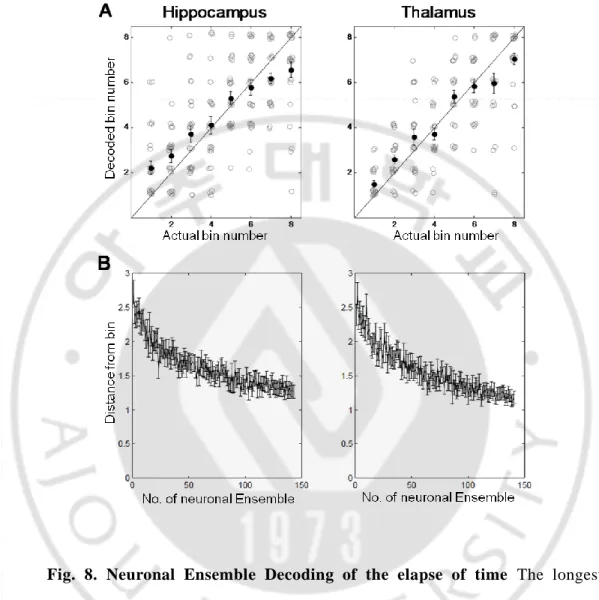
Second, I examined how well the hippocampal and thalamic neuronal ensemble kept track of the elapse of time (decoding elapsed time; each interval was divided into 10 equal-duration bins). All recorded units (n = 147, hippocampus; n = 413, thalamus) were used for decoding elapsed time assuming independence among neurons, the mean error (the distance between the actual and predicted bins) was 1.4±0.08 bin for the longest sample interval (4784 ms) in hippocampal neuronal ensemble, 1.1±0.08 bin in thalamic neuronal ensemble, which were well below chance level in both neuronal ensemble (paired t test, p <0.01, hippocampus; p < 0.01, thalamus; Fig. 8A).
38
Neuron dropping analyses revealed that > 150 neurons were needed for asymptotic performance of neural decoding (Fig. 7B, 8B). These results suggest that many more neurons are required to accurately keep track of elapsed time in the range of a few seconds compared with representing the animal’s choice in a simple binary-choice task.
39
Fig. 7. Neuronal Ensemble Decoding of Choice Hippocampal and thalamic neuronal ensembles convey temporal information. Sample intervals were classified into short or long ones based on neuronal ensemble activity during the last 500 ms of each sample interval using a leave -one-out cross-validation procedure. Only correct trials were included in the analysis. Gray, trial -by-trial decoding results (0, short-target choice; 1 long-target choice); black, their mean and SEM (A). Ensemble size, hippocampus n = 147; thalamus n = 413 neurons. (B) Results of a neurondropping analysis for A.
40
Fig. 8. Neuronal Ensemble Decoding of the elapse of time The longest sample interval (4784 ms) was divided into ten equal-duration bins, and the order of the middle eight bins was determined based on neuronal ensemble activity within each bin. Only correct trials were included in the analysis. Gray, trial -by-trial decoding results (0, short-target choice; 1 long-target choice); black, their mean and SEM. Thalamus-matched, decoding results based on randomly selected 147 neurons (A). (B) Results of a neurondropping analysis for A.
41
D. Individual Neuronal Responses
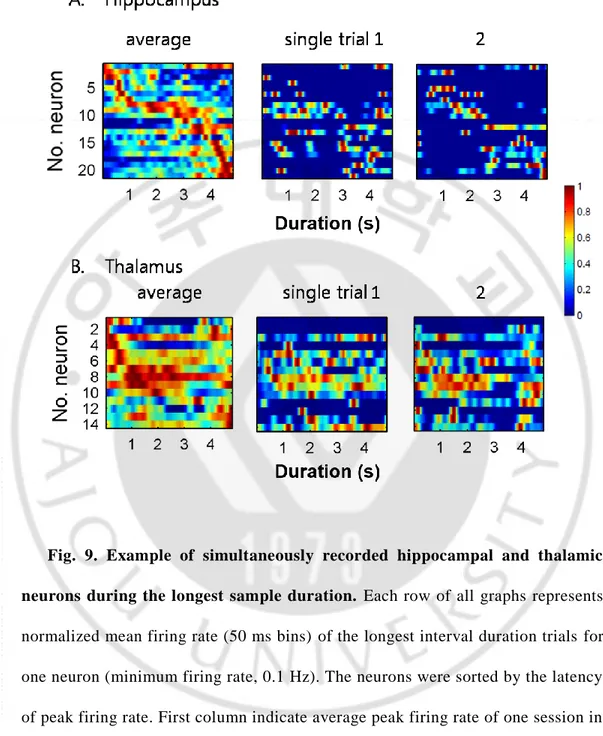
A reliable pattern of sequential activation of neuronal activity was observed in the CA1 region of hippocampus during the delay period of a memory task (Pastalkova et al., 2008; Gill et al., 2011; Itskov et al., 2011; MacDonald et al., 2011; Kraus et al., 2013). The pattern of sequential activation of simultaneously recorded neurons for the longest sample interval duration (Fig.9) was reliable across trials and lasted 4784 ms without repeating itself in hippocampus but not in thalamus. Therefore, I hypothesized that the population spiking activity of only hippocampal neurons at any point in time during a trial could be used to infer elapsed time.
To investigate the difference activity profiles between hippocampal and thalamic neurons, activity profiles of all recorded hippocampal and thalamic neurons during the longest sample duration were shown together (minimum firing rate, 0.1 Hz; Fig. 10). Hippocampal neurons tended to be active briefly, whereas thalamic neurons tended to be active largely for the entire interval duration.
42
Fig. 9. Example of simultaneously recorded hippocampal and thalamic neurons during the longest sample duration. Each row of all graphs represents normalized mean firing rate (50 ms bins) of the longest interval duration trials for one neuron (minimum firing rate, 0.1 Hz). The neurons were sorted by the latency of peak firing rate. First column indicate average peak firing rate of one session in hippocampus (A) and thalamus (B). Second and third column indicate examples of single trial for the first column. Scale bar’s range means normalized cell firing rate.
43
Fig. 10. Neuronal responses of all recorded neurons. Activity profiles of all recorded hippocampal and thalamic neurons during the longest sample duration are shown together (minimum firing rate, 0.1 Hz). Hippocampal neurons tended to be active briefly, whereas thalamic neurons tended to be active largely for the entire interval duration. Scale bar’s range means normalized cell firing rate.
44
E. Response Duration
To investigate individual neuronal response of hippocampal neurons is different from individual neuronal response of thalamic neurons during a given sample duration, the duration width between the maximum and half -maximum of each neuron’s spike density function and frequency histograms for the duration was quantified. Frequency of hippocampal neurons which have the most narrow width during the longest sample duration is larger than thalamic neurons. As the width is wider, the number of thalamic neurons are larger than that of hippocampal neurons (Fig. 11A). I also examined the duration width between the maximum and half-maximum for the each six different sample duration. In all of six sample interval, width of thalamic neurons is much wider than that of hippocampal neurons. These results suggest that hippocampal neurons convey temporal information sequentially, whereas thalamic neurons transport temporal information generally during the delay duration.
45
Fig. 11 Durations of neuronal response (A) Frequency histograms for the duration between the maximum and half-maximum of each neuron’s spike density
function (σ = 100 ms) during the longest sample interval (4784 ms; orange, hippocampus; green, thalamus). When the maximal activity was located in the middle of the interval so that two estimates of maximal -half maximal duration were available, the longer one was taken. (B) The mean duration between the maximum and half-maximum for all six sample interval durations.
46
F. Multiple linear regression
To explore whether there were cells that fired reliably during a particular period within the longest sample duration, a generalized linear model of firing rate during the delay period using a normal function was constructed (see Materials and Methods). The full model included dependence of neural activity on elapsed time (i.e., bin number, T) considering other confounding factors of the animal’s behavioral variations (X-position (X), Y-position (Y) and displacement (D)) during each bin and previous goal choice (PC). Significant fractions conveyed neural signals for the elapse of time in both brain region (T, hippocampus n = 55, 36.4%, binomial test p << 0.01; thalamus n = 206, 46.7%, p << 0.01). I also examined whether the amount of temporal information is different between hippocampal and thalamic neurons by χ2 test. Number of cells between hippocampal and thalamic neurons modulated by elapse of time is significantly different. (p = 0.049, Table 1). These results indicate that thalamic neurons convey temporal information with a climbing activity than hippocampal neurons.
47
48
G. Time Field
Firing rate of profile of each neuron triggered at the beginning of sample intervals was calculated from action potentials generated during animal ’s behavior. In order to distinguish place field of hippocampal neurons, “time fields” were defined as the areas of an increased firing rate in a given sample interval. To
identify a time field, a spike density function (σ = 100 ms) for the longest time interval for each neuron was generated, and divided it into 50ms bins. A time field was defined as the minimum 5 adjacent bins with mean firing rate in each bin > 1.5 SD above the mean. The width of individual fields was determined by the duration between the maximum and half-maximum of each neuron’s spike density function during the longest sample interval (4784 ms). When the maximal activity was located in the middle of the interval so that two estimates of maximal -half maximal duration were available, the longer one was taken.
To investigated whether the difference proportion of neurons between hippocampus and thalamus, χ2 test was performed. Significantly large proportion of hippocampal neurons have a time field compare to thalamic neurons (p = 0.0061, Table 2).
49
50
IV. DISCUSSION
I examined neuronal activity in the hippocampus and thalamus while rats were performing a temporal discrimination task, and obtained two major proposals. First, both hippocampal and thalamic neuronal populations convey information about the elapse of time. Second, neural processes underlying transmission of temporal information are different between the two areas. Thalamic neurons tended to transmit temporal information based on monotonically changing activity profiles, while hippocampal neurons tended to convey temporal information based on sequential activation of multiple neurons. Second, according to the different way of transportation of temporal information in both areas, different timing mechanisms might be adopted during duration’s encoding.
A. Role of hippocampus in interval timing
Conflicting results have been reported regarding the role of hippocampus in interval timing. Damage to the hippocampus in birds and rats had no effect on their timing ability or on their ability to discriminate visual stimuli on the basis of either orientation or size (Dietrich et al., 1997; Colombo et al., 2001). Also, following hippocampal damage, rats often respond haphazardly, that is, their response rate is not influenced by the time since the last response (Meck et al., 1984).
51
On the other hand, a large and growing body of literatures indicates a key role for the hippocampus in encoding and retrieving time in the range of seconds to minutes, in humans and animals and across a broad range of behavioral paradigms. Several studies suggested that the hippocampus is involved in maintaining and retrieving information about interval timing. Such evidence comes from individuals with selective hippocampal damage (Mayes and Montaldi, 2001; Spiers et al., 2001) and fMRI studies (Kumaran and Maguire, 2006; Staresina and Davachi, 2006; Ekstrom and Bookheimer, 2007; Lehn et al., 2009; Tubridy and Davachi, 2011).
A particularly striking example (MacDonald et al., 2011; Macdonald et al., 2013) showed that very large proportion of hippocampal neurons in rats encodes sequential events and hippocampal neuronal activity bridges and disambiguates the identical empty delay between the object and odor that compose each sequence. Hippocampal neurons fired at particular times during key events that occur reliably at particular moments (the objects and odors), and “time cells” encoded sequential moments during an extended discontiguity between those identifiable event. The evidence that neurons that fire at particular moments in the delay period are “time cells” parallels the evidence that hippocampal neurons that fire at particular locations in space are : “place cells”. Previous work on hippocampal neuronal activity in rats performing T-maze alternation tasks has shown that hippocampal neuronal ensembles similarly disambiguate overlapping
52
spatial routes (Frank et al., 2000; Wood et al., 2000; Shapiro et al., 2006). In an extension of these studies, Pastalkova et al. (2008) revealed the existence of hippocampal neurons that fire at specific moments as rats walk on a running wheel between trials, and some of these cells distinguished subsequent left and right turn trials. The present observation indicates that hippocampal neurons also encode specific times between non-spatial events and disambiguate non-spatial sequences.
Our examination of changes in hippocampal neuron’s firing patterns following discrimination of the sample duration reveals that hippocampal neurons respond in sequential ways. A previous study’s task for rats is object-delay odor sequences, in which animals are required to memorize the association between object and odor and recall it during the delay duration. Therefore, they named hippocampal neurons that fired at specific time as “time cells”, and the information of time cells can be mixed with memory for the association between object and odor. The present findings reveal that a large proportion of hippocampal neurons conveys temporal information based on sequential discharges in a purely temporal discrimination task.
B. Role of thalamus in interval timing
Animals can predict the time of occurrence of a forthcoming event relative to a preceding stimulus, i.e. the interval time between those two, given previous
53
learning experience with the temporal contingency between them. Accumulating evidence suggests that a particular pattern of neural activity observed during tasks involving fixed temporal intervals might carry interval time information; the activity of some cortical and subcortical neurons ramps up slowly and linearly during time intervals, like a temporal integrator, and peaks around the time at which an event is due to occur. The slope of this climbing activity, and hence also the peak time, adjust to the length of a temporal interval during repetitive experience with it (Durstewitz and Seamans, 2006).
Komura et al. (2004) found linearly climbing acti vity in thalamic neurons in a trace conditioning protocol where a predictive stimulus precede d a reward by a fixed interval. Climbing activity was triggered by the predictive (conditioned) stimulus and peaked around the time at which the reward was due. As the delay between the offset of the predictor and the delivery of reward was either increased or decreased, the slope of climbing activity adjusted within a few trials to the new temporal interval.
In present study, I found diverse types of neural activity during the sample duration including ramping activity for each of six different sample duration (Fig. 6). Significant fractions conveyed information on the elapse of time based on monotonically changing activity profiles (e.g., n = 206, 46.7% during the longest sample duration, Table 1). These results suggest that the posterior thalamic region might be involved in interval timing and that is conveys temporal information
54
largely based on ramping activity.
C. Relationship with the other brain regions
Timing-related neural activity has been found in many different areas of the brain, which is consistent with the view that the brain is equipped with multiple intrinsic clocks rather than a central dedicated clock (Mauk and Buonomano, 2004; Ivry and Schlerf, 2008). Numerous brain structures such as cerebellum (Ivry et al., 2002; Spencer et al., 2005), orbito frontal cortex (Tsujimoto et al., 2009), parietal cortex (Leon and Shadlen, 2003; Bueti and Walsh, 2009), prefrontal cortex (Kim et al., 2013), and supplementary motor area (Mita et al., 2009; Kotz and Schwartze, 2011; Shinomoto et al., 2011) transmit temporal information even though underlying mechanisms might differ (Matell and Meck, 2004; Buhusi and Meck, 2005). My results showed that hippocampal and thalamic neural signals related to interval timing were not particularly weak compared to those in the other brain regions. Considering these results and anatomical connection patterns among these brain subregions, I suggest that hippocampus and posterior thalamus provide separate temporal information signals to the cortico -striatal circuits. Cortical projections to the striatum are topographically ordered in a series of parallel anatomical ‘loops’ running from neocortex to the striatum, pallidum, thalamus, and back to neocortex (Pennartz et al., 2009). This loop has been proposed as the major site for interval timing (Matell and Meck, 2004; Mathai and