R E S E A R C H
Open Access
Predicting survival of patients with
idiopathic pulmonary fibrosis using GAP
score: a nationwide cohort study
Sang Hoon Lee
1, Song Yee Kim
2, Dong Soon Kim
3, Young Whan Kim
4, Man Pyo Chung
5, Soo Taek Uh
6,
Choon Sik Park
7, Sung Hwan Jeong
8, Yong Bum Park
9, Hong Lyeol Lee
10, Jong Wook Shin
11, Eun Joo Lee
12,
Jin Hwa Lee
13, Yangin Jegal
14, Hyun Kyung Lee
15, Yong Hyun Kim
16, Jin Woo Song
3, Sung Woo Park
7and
Moo Suk Park
2*Abstract
Background: The clinical course of idiopathic pulmonary fibrosis (IPF) varies widely. Although the GAP model is useful for predicting mortality, survivals have not yet been validated for each GAP score. We aimed to elucidate how prognosis is related to GAP score and GAP stage in IPF patients.
Methods: The Korean Interstitial Lung Disease Study Group conducted a national survey to evaluate various characteristics in IPF patients from 2003 to 2007. Patients were diagnosed according to the 2002 criteria of the ATS/ERS. We enrolled 1,685 patients with IPF; 1,262 had undergone DLCOmeasurement. Patients were stratified based on GAP score (0–7): GAP score Group 0 (n = 26), Group 1 (n = 150), Group 2 (n = 208), Group 3 (n = 376), Group 4 (n = 317), Group 5 (n = 138), Group 6 (n = 39), and Group 7 (n = 8).
Results: Higher GAP score and GAP stage were associated with a poorer prognosis (p < 0.001, respectively). Survival time in Group 3 was lower than those in Groups 1 and 2 (p = 0.043 and p = 0.039, respectively), and higher than those in groups 4, 5, and 6 (p = 0.043, p = 0.032, and p = 0.003, respectively). Gender, age, and DLCO(%) differed significantly between Groups 2 and 3. All four variables in the GAP model differed significantly between Groups 3 and 4.
Conclusion: The GAP system showed significant predictive ability for mortality in IPF patients. However, prognosis in IPF patients with a GAP score of 3 were significantly different from those in the other stage I groups and stage II groups of Asian patients.
Keywords: Idiopathic pulmonary fibrosis, GAP stage, Prognosis
Background
Idiopathic pulmonary fibrosis (IPF) is a specific form of diffuse interstitial lung disease (DILD) that mainly occurs in adults over the age of 50 [1]. It is a chronic, progressive, irreversible, fibrosing interstitial pneumonia, characterized by limited to the lungs [2]. While the etiology of IPF is unknown, it is related to a histological and/or radiological “usual interstitial pneumonia” (UIP) pattern [1]. Morbidity and mortality are high in IPF—the
median survival time is only 2.5 to 3.5 years—and the clin-ical course and prognosis vary widely among individual patients [3]. This high variability makes predicting progno-sis difficult, which in turn causes problems with treatment planning. Therefore, physicians must be better equipped to predict the clinical course of IPF if they are to provide precise prognoses and adequate treatment to patients.
Previous studies have shown that age, gender, lung function change, radiological pattern, histological vari-ability, dyspnoea, cough, pulmonary artery hypertension, amount of elastic fiber, and some molecular biomarkers are associated with prognosis [4–10]. Some investigators have attempted to predict clinical course using these prognostic factors [11]. However, none of these predictive
* Correspondence:[email protected]
2Division of Pulmonology, Department of Internal Medicine, Severance
Hospital, Institute of Chest Diseases, Yonsei University College of Medicine, 50-1, Yonsei-ro, Seodaemun-gu, Seoul 120-752, South Korea
Full list of author information is available at the end of the article
© 2016 The Author(s). Open Access This article is distributed under the terms of the Creative Commons Attribution 4.0 International License (http://creativecommons.org/licenses/by/4.0/), which permits unrestricted use, distribution, and reproduction in any medium, provided you give appropriate credit to the original author(s) and the source, provide a link to the Creative Commons license, and indicate if changes were made. The Creative Commons Public Domain Dedication waiver (http://creativecommons.org/publicdomain/zero/1.0/) applies to the data made available in this article, unless otherwise stated.
models have been widely adopted, as they are difficult to use or lack external validation. In 2012, Ley et al. sug-gested a novel system for staging IPF that is similar to those used in asthma, chronic obstructive pulmonary dis-ease (COPD), and lung cancer [12]. The so-called GAP index and staging system uses of four variables: gender (G), age (A), and two pulmonary physiological parameters (P)—percentage predicted forced vital capacity (FVC [%]), and percentage predicted diffusion capacity of the lungs for carbon monoxide (DLCO[%]). These four variables are
commonly measured at the initial visit and are easily followed up. This system has helped clinicians to predict prognosis and decide on management strategies. Although this GAP model is simple-to-use for predicting mortality, prognoses have not yet been evaluated for each GAP score. The purpose of our study was to validate, using na-tional survey data, how prognosis is related to GAP score and GAP stage in patients with IPF.
Methods
Patient selection
The study involved patients who had been diagnosed with idiopathic interstitial pneumonia (IIP) at 54 university and teaching hospitals between January 1, 2003 and December 31, 2007. At each hospital, pulmonary specialists (pulmonologists, chest radiologists, and pathologists) had confirmed the diagnoses, and data were reviewed by the Scientific Committee at the Korean Academy of Tuberculosis and Respiratory Diseases. IPF was diagnosed on the basis of the 2002 criteria of the American Thoracic Society/European Respiratory Society (ATS/ERS) [13]. Initially, we excluded patients who had a history of connective tissue disease, pneumoconiosis, or inges-tion of either a cytotoxic agent or amiodarone, and all of which are well-known to cause interstitial lung disease. Additionally, we excluded patients with sus-pected chronic hypersensitivity pneumonitis; such de-cisions were made on the basis of history, laboratory data, and committee conference.
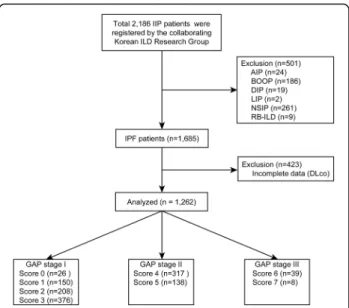
In total, 2,186 patients with idiopathic interstitial pneumonia (IIP) were registered; of these, patients with other forms of ILD than IPF (n = 501) were excluded from the study, as were patients who had not undergone
pulmonary function testing (PFT) that included DLCO
measurement (n = 423). Ultimately, 1,262 patients were included in the study: 760 at GAP stage I, 455 at stage II, and 47 at stage III (Fig. 1). We reviewed the clinical, radiological, and physiological data of all the included patients. With regard to physiological data, we investi-gated FVC, FVC (%), forced expiratory volume in one second (FEV1), percentage predicted FEV1 (FEV1 [%]),
total lung capacity (TLC), percentage predicted TLC (TLC [%]), DLCO, and percentage predicted DLCO(DLCO
[%]). In addition, we evaluated patients’ C-reactive
protein (CRP) levels, and examined their blood for the positivity of antinuclear antibody (ANA) and rheumatoid factor (RF). The composite physiologic index (CPI), which is a predictive model for IPF prognosis, was calculated as Well et al. reported [14]. All hospital data were entered into the ILD web-based registry (http://www.ild.or.kr/).
GAP model
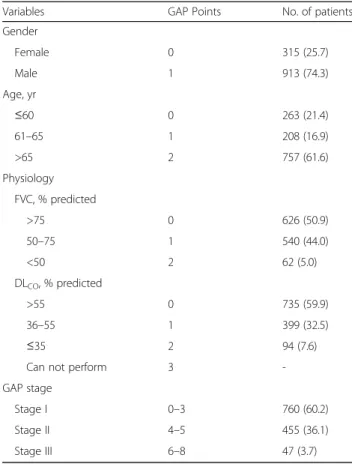
Total GAP score was calculated using the method sug-gested by Ley et al [12] (Table 1). All four clinical vari-ables were examined: gender (woman: 0 points, man: 1 point), age (0–2 points), FVC (%) (0–2 points), and DLCO(%) (0–3 points). We then divided the patients on
the basis of GAP score (Groups 0–7): Group 0 (n = 26), Group 1 (n = 150), Group 2 (n = 208), Group 3 (n = 376), Group 4 (n = 317), Group 5 (n = 138), Group 6 (n = 39), and Group 7 (n = 8). In the physiological category, the “cannot perform” classification (3 points) of DLCO
meas-urement had not been recorded in the data used. For this reason, the total GAP score of 8 was not investi-gated in the current study. Additionally, we excluded pa-tients with total GAP scores of 0 (n = 26), and 7 (n = 8), as these two groups contained much fewer patients than
Fig. 1 Flow chart showing inclusion and exclusion of patients in the study. A total of 1262 IPF patients were analysed in this study, excluding 501 with other interstitial lung disease and 423 who had not undergone pulmonary function testing that had included DLCO. Note: Groups with a
total GAP score of 0 and 7 were excluded because they contained too few patients and because the baseline characteristics of patients with GAP score 0 were significantly different (all women, never smokers). No patients with a GAP score of 8 were included, because the“unable to perform” category in DLCOwas not checked in this study. Definition of
abbreviations: IIP, idiopathic interstitial pneumonia; ILD, interstitial lung disease; AIP, acute interstitial pneumonia; BOOP, bronchiolitis obliterans organizing pneumonia; DIP, desquamative interstitial pneumonia; LIP, lymphocytic interstitial pneumonia; NSIP, non-specific interstitial pneumonia; RB-ILD, respiratory bronchiolitis-associated interstitial lung disease
the other groups. The characteristics in Group 0, which contained only women who had never smoked, were sig-nificantly different from those in the other groups.
Statistical analysis
Information was obtained from web-based question-naires and medical records; it was stored and analysed using the Excel™ computer program. Analysis of variance (ANOVA) was used to compare continuous variables, and Bonferroni’s correction was used for post-hoc ana-lysis. Pearson’s chi-squared test or Fisher’s exact test were used to compare categorical variables. Continuous variables were presented as mean ± standard deviation, or proportions within each group as a percentage.
To compare the GAP score groups in terms of survival times, Kaplan-Meier survival analysis and the log-rank test were used. In addition, multivariate analysis was conducted with Cox proportional hazard model. C-statistic was also performed for the GAP model at 1-year, 2-year, and 3-year. When performing the survival analysis, we censored the following conditions: (1) still alive at last visit (at last visit date), (2) lost to follow-up loss and (3) had undergone lung transplantation (at sur-gery date). Statistics were analysed using SPSS™ Version
20 (SPSS, Chicago, IL, USA). An adjusted p-value less than 0.05 was regarded as statistically significant.
Results
Demographic characteristics
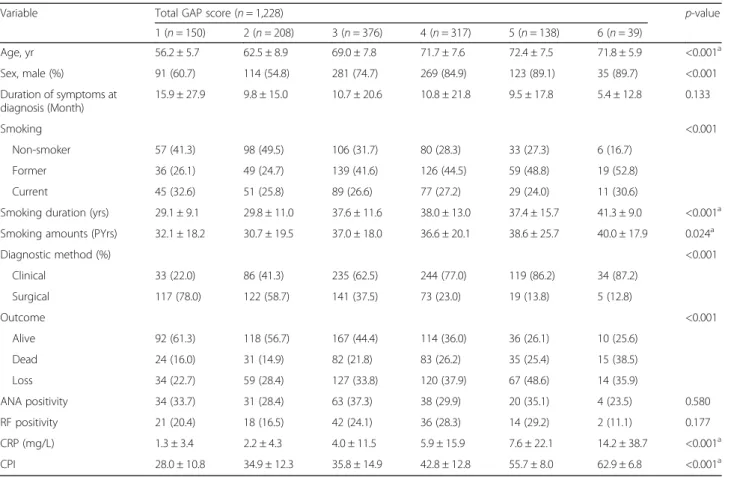
There were 1,228 patients with a GAP score from 1 to 6. The baseline characteristics of these patients are summa-rized in Table 2. The mean age of the study population was 67.5 ± 9.3 years and was lowest in Group 1. The high-est proportion of men occurred in Group 6 (p < 0.001). Although the patients in Group 1 had experienced the longest duration of respiratory symptoms at diagnosis, and those in Group 6 had experienced the shortest, this was not statistically significant (p = 0.133). With regard to smoking status, 83.3 % of patients in Group 6 were ever-smokers; the equivalent values in Groups 1 and 2 were 58.7 and 50.5 %, respectively. Furthermore, smoking dur-ation and amount were higher in Group 6 than in the other score groups (p < 0.001 and p = 0.024, respectively). Patients with a higher GAP score tended to have been diagnosed using the clinical method rather than surgical lung biopsy. Specifically, the proportion of clinically diag-nosed patients was 87.2 % in Group 6, whereas it was 22.0 % Group 1. The percentages of ANA and RF positiv-ity did not differ significantly among the groups (p = 0.580 and p = 0.177, respectively). Increased CRP level was sig-nificantly associated with higher GAP score (p < 0.001). CPI also tended to increase as GAP score increased (p < 0.001). The mean value of CPI was significantly differ-ent between Group 3 and Group 4, although there was no significant difference between Group 2 and Group 3 after Bonferroni’s correction. The mean follow-up duration of the study population was 19.0 ± 16.0 months.
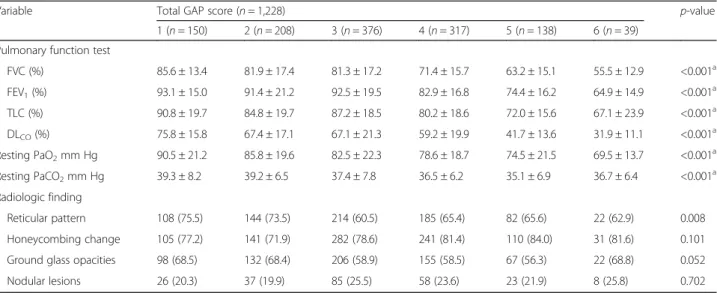
Physiological and radiological parameters
We investigated pulmonary function, ABGA results, and HRCT findings in IPF patients (Table 3). In Group 1,
FVC (%) and DLCO (%) were, respectively, 85.6 and
75.8 %, while in Group 6 the values were 55.5 and 31.9 %. ABGA also differed significantly among groups. Resting pulmonary oxygen tension (PaO2) was highest in
Group 1, and higher GAP score was significantly associ-ated with lower pulmonary oxygen tension (p < 0.001). In terms of radiological findings, the groups did not differ in any parameter other than reticular pattern.
Comorbidities and initial respiratory symptoms
Co-morbidities and initial presenting respiratory symp-toms are shown in Additional file 1: Tables S1 and S2. The most common co-morbidities were past history of tuberculosis, diabetes mellitus, and hypertension; specif-ically, past history of tuberculosis was in 147 patients (12.0 %), diabetes mellitus in 234 (19.1 %), and hyperten-sion in 271 (22.1 %). Furthermore, 74 patients (6.0 %)
Table 1 GAP index and number (%) of patients
Variables GAP Points No. of patients Gender Female 0 315 (25.7) Male 1 913 (74.3) Age, yr ≤60 0 263 (21.4) 61–65 1 208 (16.9) >65 2 757 (61.6) Physiology FVC, % predicted >75 0 626 (50.9) 50–75 1 540 (44.0) <50 2 62 (5.0) DLCO, % predicted >55 0 735 (59.9) 36–55 1 399 (32.5) ≤35 2 94 (7.6)
Can not perform 3
-GAP stage
Stage I 0–3 760 (60.2)
Stage II 4–5 455 (36.1)
Stage III 6–8 47 (3.7)
Note: Values in parentheses are percentages
had lung cancer. These co-morbidities were not signifi-cantly different among groups. Fourteen patients (1.1 %) had a family history of IPF (data not shown). Cough,
sputum, and hemoptysis were significantly more
frequent at higher GAP scores (p = 0.004, p < 0.001, and p = 0.021, respectively). Although the proportion of pa-tients who suffered dyspnoea of exertion increased as GAP score increased, this association was not statisti-cally significant.
Survival analysis on the basis of GAP score
All GAP variables showed significant association with prognosis except gender (G) (Table 4, Additional file 1: Table S3). The C-statistic values for the GAP stage at 1, 2, and 3 years were 0.59 (CI 0.537–0.638), 0.59 (CI 0.544– 0.631), and 0.57 (CI 0.530–0.611), respectively. The GAP score showed a similar C statistic value with GAP stage. It was 0.61 (CI 0.556–0.653), 0.61 (CI 0.566–0.649), and 0.59 (0.549–0.627), respectively. Kaplan-Meier analysis was performed to compare survival among groups, as well as
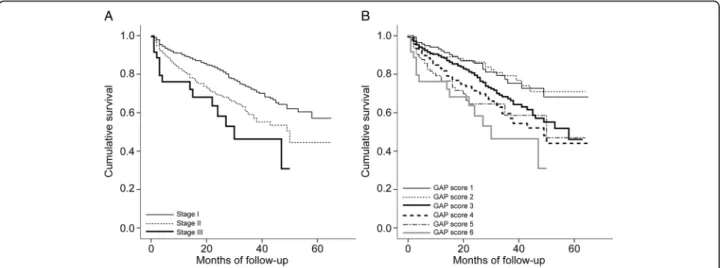
among GAP stages (Fig. 2a and b). Advanced GAP stage was associated with poor prognosis (p < 0.001). At GAP stages I and II (Groups 1–5), Group 3 differed significantly from all other groups in terms of cumulative survival
(Group 3 vs. Group 1, p = 0.027; Group 3 vs. Group
2, p = 0.022; Group 3 vs. Group 4, p = 0.025; Group 3
vs. Group 5, p = 0.001). The causes of death are shown in Table 5. Respiratory failure (42.3 %) and infection (34.2 %) were the most common causes of death in study population.
Sub-analysis by GAP score
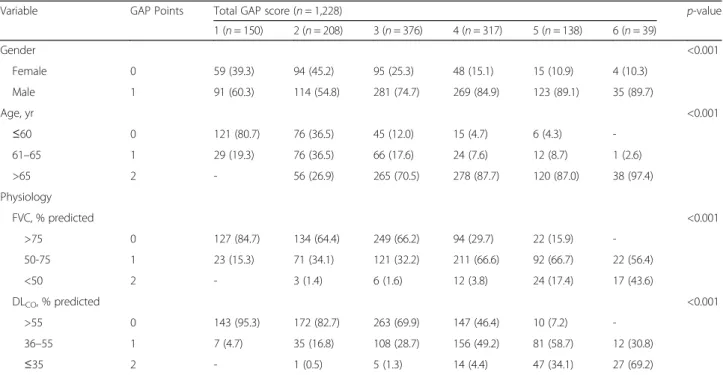
Table 6 shows the distribution of GAP points in each group in terms of predictive variables. Higher GAP scores were significantly associated with male predomin-ance, aging, and poorer lung function, same as the ori-ginal definition of the GAP model. Furthermore, gender, age, and DLCO(%) differed significantly between Groups
2 and 3, and all four variables in the GAP model differed significantly between Groups 3 and 4.
Table 2 Baseline characteristics of study population according to total GAP score
Variable Total GAP score (n = 1,228) p-value
1 (n = 150) 2 (n = 208) 3 (n = 376) 4 (n = 317) 5 (n = 138) 6 (n = 39) Age, yr 56.2 ± 5.7 62.5 ± 8.9 69.0 ± 7.8 71.7 ± 7.6 72.4 ± 7.5 71.8 ± 5.9 <0.001a Sex, male (%) 91 (60.7) 114 (54.8) 281 (74.7) 269 (84.9) 123 (89.1) 35 (89.7) <0.001 Duration of symptoms at diagnosis (Month) 15.9 ± 27.9 9.8 ± 15.0 10.7 ± 20.6 10.8 ± 21.8 9.5 ± 17.8 5.4 ± 12.8 0.133 Smoking <0.001 Non-smoker 57 (41.3) 98 (49.5) 106 (31.7) 80 (28.3) 33 (27.3) 6 (16.7) Former 36 (26.1) 49 (24.7) 139 (41.6) 126 (44.5) 59 (48.8) 19 (52.8) Current 45 (32.6) 51 (25.8) 89 (26.6) 77 (27.2) 29 (24.0) 11 (30.6)
Smoking duration (yrs) 29.1 ± 9.1 29.8 ± 11.0 37.6 ± 11.6 38.0 ± 13.0 37.4 ± 15.7 41.3 ± 9.0 <0.001a Smoking amounts (PYrs) 32.1 ± 18.2 30.7 ± 19.5 37.0 ± 18.0 36.6 ± 20.1 38.6 ± 25.7 40.0 ± 17.9 0.024a
Diagnostic method (%) <0.001 Clinical 33 (22.0) 86 (41.3) 235 (62.5) 244 (77.0) 119 (86.2) 34 (87.2) Surgical 117 (78.0) 122 (58.7) 141 (37.5) 73 (23.0) 19 (13.8) 5 (12.8) Outcome <0.001 Alive 92 (61.3) 118 (56.7) 167 (44.4) 114 (36.0) 36 (26.1) 10 (25.6) Dead 24 (16.0) 31 (14.9) 82 (21.8) 83 (26.2) 35 (25.4) 15 (38.5) Loss 34 (22.7) 59 (28.4) 127 (33.8) 120 (37.9) 67 (48.6) 14 (35.9) ANA positivity 34 (33.7) 31 (28.4) 63 (37.3) 38 (29.9) 20 (35.1) 4 (23.5) 0.580 RF positivity 21 (20.4) 18 (16.5) 42 (24.1) 36 (28.3) 14 (29.2) 2 (11.1) 0.177 CRP (mg/L) 1.3 ± 3.4 2.2 ± 4.3 4.0 ± 11.5 5.9 ± 15.9 7.6 ± 22.1 14.2 ± 38.7 <0.001a CPI 28.0 ± 10.8 34.9 ± 12.3 35.8 ± 14.9 42.8 ± 12.8 55.7 ± 8.0 62.9 ± 6.8 <0.001a
Note: Values in parentheses are percentages. CPI = 91.0– (0.65a
percent predicted DLCO)– (0.53 a
percent predicted FVC) + (0.34a
percentage predicted FEV1)
GAP gender, age, and 2 lung physiology variables (FVC and DLCO), ANA antinuclear antibody, RF rheumatoid factor, CPI composite physiologic score a
the following post hoc comparisons were significant at the p = 0.05 level; all other comparisons were non-significant: Score 1 group versus Score 2, 3, 4, 5, 6 groups, Score 2 group versus Score 3, 4, 5, 6 groups, and Score 3 group versus Score 4, 5 groups (age); Score 1 group versus Score 3, 4, 5, 6 groups and Score 2 group versus Score 3, 4, 5, 6 groups (smoking duration); Score 1 group versus Score 6 group, Score 2 group versus Score 6 group, and Score 3 group versus Score 6 group (CRP); Score 1 group versus Score 2, 3, 4, 5, 6 groups, Score 2 group versus Score 4, 5, 6 groups, Score 3 group versus Score 4, 5, 6 groups, Score 4 group versus Score 5, 6 groups and Score 5 group versus Score 6 group (CPI)
Discussion
The GAP model is simple to use in planning treatment or providing prognosis information to IPF patients. However, prognosis in relation to individual score groups have not been studied until now. This study attempted to undertake external validation of the GAP model in a relatively large cohort of IPF patients. Herein, we found that GAP score groups differed in terms of survival: in particular, survival in Group 3 patients dif-fered from the other stage I groups, as well as the stage II groups.
For a long time, clinicians who care for IPF patients have been struggling to make accurate prognoses, because IPF is a heterogeneous disease that lacks a vali-dated predictive model [11, 15]. Many previous re-searchers have aimed to find an ideal model for predicting clinical outcome in IPF patients [14, 16–22].
In 2001, for instance, King et al. [16] created an upgraded version of a previously existing clinical, radio-logical, and physiological scoring system, known as the “CRP system”, [17] to predict survival in IPF patients. This model took into account age, smoking status, club-bing of the fingertips, HRCT score, HRCT score for
pul-monary hypertension score, TLC (%), and PaO2at max
exercise. However, it did not make clear that gender was significantly associated with mortality. Furthermore, it was too complex to use in a clinical setting, and cardio-pulmonary exercise testing was essential to calculating the score. Wells et al. [14] then proposed the composite physiological index (CPI), which used a combination of
three factors to make a prediction—FVC (%), FEV1(%),
and DLCO (%); these factors are determined using
pul-monary function testing (PFT). Physicians could calculate CPI using PFT results only, rendering CT findings un-necessary in predicting prognosis. Besides these models, du Bois et al. [21] developed a predictive system that was based on IPF diagnostic criteria, and Richards et al. [22] used biomarkers to create another predictive model. How-ever, these models have also been criticized because they are complicated to use or lack external validation.
Ley et al. developed the GAP model in 2012. Its straightforward nature has allowed the GAP index to be widely studied, [23–28] and it has been validated in the United States, Italy, and South Korea [12, 23]. In fact, the system showed robust predictive power in patients
Table 4 Survival analysis with Cox proportional hazard model
Variable Univariate Multivariate
HR 95 % CI p-value HR 95 % CI p-value Age 1.015 1.002–1.028 0.028 1.018 1.005–1.031 0.006 Sex (M/F) 1.184 0.890–1.575 0.245 1.264 0.949–1.684 0.109 FVC (%) 0.985 0.978–0.992 <0.001 0.986 0.979–0.993 <0.001 DLCO(%) 0.987 0.981–0.993 <0.001 0.989 0.983–0.995 0.001
FVC forced vital capacity, % pred percentage of the predicted value, DLCO,
diffusing capacity of the lung for carbon monoxide
Table 3 Initial physiologic and radiologic characteristics according to total GAP score
Variable Total GAP score (n = 1,228) p-value
1 (n = 150) 2 (n = 208) 3 (n = 376) 4 (n = 317) 5 (n = 138) 6 (n = 39) Pulmonary function test
FVC (%) 85.6 ± 13.4 81.9 ± 17.4 81.3 ± 17.2 71.4 ± 15.7 63.2 ± 15.1 55.5 ± 12.9 <0.001a FEV1(%) 93.1 ± 15.0 91.4 ± 21.2 92.5 ± 19.5 82.9 ± 16.8 74.4 ± 16.2 64.9 ± 14.9 <0.001a TLC (%) 90.8 ± 19.7 84.8 ± 19.7 87.2 ± 18.5 80.2 ± 18.6 72.0 ± 15.6 67.1 ± 23.9 <0.001a DLCO(%) 75.8 ± 15.8 67.4 ± 17.1 67.1 ± 21.3 59.2 ± 19.9 41.7 ± 13.6 31.9 ± 11.1 <0.001a Resting PaO2mm Hg 90.5 ± 21.2 85.8 ± 19.6 82.5 ± 22.3 78.6 ± 18.7 74.5 ± 21.5 69.5 ± 13.7 <0.001a Resting PaCO2mm Hg 39.3 ± 8.2 39.2 ± 6.5 37.4 ± 7.8 36.5 ± 6.2 35.1 ± 6.9 36.7 ± 6.4 <0.001a Radiologic finding Reticular pattern 108 (75.5) 144 (73.5) 214 (60.5) 185 (65.4) 82 (65.6) 22 (62.9) 0.008 Honeycombing change 105 (77.2) 141 (71.9) 282 (78.6) 241 (81.4) 110 (84.0) 31 (81.6) 0.101 Ground glass opacities 98 (68.5) 132 (68.4) 206 (58.9) 155 (58.5) 67 (56.3) 22 (68.8) 0.052 Nodular lesions 26 (20.3) 37 (19.9) 85 (25.5) 58 (23.6) 23 (21.9) 8 (25.8) 0.702
Note: Values in parentheses are percentages
GAP gender, age, and 2 lung physiology variables (FVC and DLCO), FVC forced vital capacity, % pred percentage of the predicted value, FEV1forced expiratory
volume, TLC total lung capacity, DLCOdiffusing capacity of the lung for carbon monoxide, PaO2arterial oxygen tension, PaCO2arterial carbon dioxide tension a
the following post hoc comparisons were significant at the p = 0.05 level; all other comparisons were non-significant: Score 1 group versus Score 4, 5, 6 groups, Score 2 group versus Score 4, 5, 6 groups, Score 3 group versus Score 4, 5, 6 groups and Score 4 group versus Score 5, 6 groups (FVC (%)); Score 1 group versus Score 4, 5, 6 groups, Score 2 group versus Score 4, 5, 6 groups, Score 3 group versus Score 4, 5, 6 groups and Score 4 group versus Score 5, 6 groups (FEV1(%));
Score 1 group versus Score 4, 5, 6 groups, Score 2 group versus Score 5, 6 groups, Score 3 group versus Score 4, 5, 6 groups, and Score 4 group versus Score 5, 6 groups (TLC (%)); Score 1 group versus Score 2, 3, 4, 5, 6 groups, Score 2 group versus Score 4, 5, 6 groups, Score 3 group versus Score 4, 5, 6 groups, and Score 4 versus Score 5,6 groups (DLCO(%)); Score 1 group versus Score 3, 4, 5, 6 groups, Score 2 group versus Score 4, 5, 6 groups, and Score 3 group versus Score 5, 6
with chronic ILD (ILD-GAP model) and IPF related to occupational dust exposure [26, 28]. Furthermore, the model is more powerful and accurate when follow-up PFT results are taken into account, [26, 27] and it has
been found that DLCOcan be replaced by HRCT fibrosis
score in the GAP model (CT-GAP model) [25].
Interestingly, the duration of respiratory symptoms at diagnosis was longest in Group 1 and shortest in Group 6, although this was not a significant difference. This may be due to variations in individual perception of respiratory symptoms [29]. Hiwatari et al. [30] reported that IPF patients with mucous hypersecretion had significantly poor prognosis. In our study, the high score group showed sputum production significantly more often than score 1 or 2 group. This could mean that the patients with a higher GAP score could be more vulner-able to respiratory infection, which could be a cause of death. In our study, patients with a score over 3 showed a higher mortality rate due to infection than score 1 or 2 group. Variables related to smoking were significantly related to GAP score in this study; the proportion of
ever-smokers, as well as smoking amount, were highest in Group 6. In other studies however, results have con-flicted regarding the association between smoking and prognosis in IPF. Such results are easily influenced by gender, as well as the“healthy smoker effect” [16, 31]. In our study, smoking was not significantly associated with mortality in both univariate and multivariate analyses (Additional file 1: Table S3). Some investigations have shown that elevated CRP levels are related to poor prog-nosis [2, 32]. In the present study, CRP levels were high-est in Group 6, and GAP score was significantly associated with CRP level (p < 0.001).
The most common cause of death in IPF patients is respiratory failure, which results from the progression of lung fibrosis, rather than comorbidities [3]. Furthermore, our study revealed no significant differences among the groups in terms of comorbidities. This suggests that mortality in IPF can be predicted, because the majority of mortalities are caused by the IPF itself.
In the present study, prognosis in Group 3 differed significantly from that in the other score groups, as Fig. 2 Kaplan-Meier estimates of survival of IPF patients based on (a) GAP stage, and (b) total GAP score. a Advanced GAP stages were significantly associated with poor prognosis (p < 0.001). b Cumulative survival in GAP score group 3 was significantly different from that in the other GAP score groups: GAP score 3vs. GAP score 1, p = 0.043; GAP score 3 vs. GAP score 2, p = 0.039; GAP score 3 vs. GAP score 4, p = 0.043; GAP score 3 vs. GAP score 5, p = 0.032; GAP score 3 vs. GAP score 6, p = 0.003). Definition of abbreviations: GAP, gender, age, and two pulmonary physiology variables (FVC and DLCO)
Table 5 Causes of death in the study population according to total GAP score
Variable Total GAP score Total
1 (n = 11) 2 (n = 21) 3 (n = 60) 4 (n = 63) 5 (n = 28) 6 (n = 13) Respiratory failure 8 (72.7) 11 (52.4) 21 (35.0) 25 (39.7) 12 (42.9) 6 (46.2) 83 Infection 2 (18.2) 6 (28.6) 19 (31.7) 26 (41.3) 10 (35.7) 4 (30.8) 67 Heart failure 6 (1.0) 5 (7.9) 2 (7.1) 1 (7.7) 14 Lung cancer 1 (9.1) 4 (19.0) 9 (15.0) 5 (7.9) 2 (7.1) 1 (7.7) 22 Othersa 5 (8.3) 2 (3.2) 2 (7.1) 1 (7.7) 10
Note: Values in parentheses are percentages
The cause of death was investigated in 196 mortality cases GAP gender, age, and two lung physiology variables (FVC and DLCO) a
shown using Kaplan-Meier analysis. This result suggests that the GAP score of 3 could be divided from the other stage I scores, thus creating a more refined prognostic system. Although the GAP model is simple to use and has proven effective in other chronic ILDs, the staging system amounts basically to a rough grouping of the GAP scores (stage I: 0–3 points, stage II: 4–5 points, and stage III: 6–8 points); the GAP stages I, II, and III were designed to have lowest 40 % risk, middle 40 % risk, and highest 20 % risk, respectively. In our study, Group 3 differed significantly from the other stage I groups, and from the stage II groups, in terms of all four predictive variables that contribute to GAP score; the only exception was FVC (%), which did not differ be-tween Groups 2 and 3. Although the mean value of lung function results was similar, age and gender composition were significantly different between Group 2 and 3. Ley et al. [12] mentioned that one of the limitations of the GAP model is its overestimation of risk in lower-risk groups, and this may be the reason for the lack of sig-nificant difference in FVC (%) mentioned between Group 2 and 3. Although the mean value of CPI signifi-cantly increased as GAP score increased, the difference of CPI between Groups 2 and 3 was not significant in our study, unlike GAP score. This might be explained by a difference in study design between the GAP model and CPI: GAP uses more clinical data in its model, such as
age and gender, while CPI was created using only PFT results [12, 14].
Our study did have some limitations. Firstly, patients were diagnosed using the 2002 ATS/ERS guidelines, which place more importance on surgical lung biopsy results than do the 2011 updated guidelines. Also in this study, the HRCT findings were not quantified as scores, or classified according to updated guidelines. In addition, in radiologic findings, traction bronchiectasis was not investigated. However, Ley et al. [12] created the GAP model using a derivation cohort and validation cohort that had been diagnosed between 2000 and 2010. Additionally, Kim et al. [23] demonstrated that the GAP model was effective (except in predicting the 3-year risk of death) in Korean IPF patients who had been diagnosed between 2005 and 2009. Another limitation is that Groups 0 and 7 were excluded from the study because they contained much fewer patients than the other score groups. In fact, patients in Group 0 (all women, never smokers) differed significantly from the other score groups in terms of base-line characteristics. Furthermore, no patients were enrolled who had a GAP score of 8, which requires the
inclusion of an “unable to perform” category in DLCO
measurement. We also excluded patients who had not
undergone PFT that included DLCO. This considerable
number of excluded groups may have led to selection bias. Finally, the Korean ILD group did not investigate the
Table 6 Distribution of GAP points by each predictor according to total GAP score
Variable GAP Points Total GAP score (n = 1,228) p-value
1 (n = 150) 2 (n = 208) 3 (n = 376) 4 (n = 317) 5 (n = 138) 6 (n = 39) Gender <0.001 Female 0 59 (39.3) 94 (45.2) 95 (25.3) 48 (15.1) 15 (10.9) 4 (10.3) Male 1 91 (60.3) 114 (54.8) 281 (74.7) 269 (84.9) 123 (89.1) 35 (89.7) Age, yr <0.001 ≤60 0 121 (80.7) 76 (36.5) 45 (12.0) 15 (4.7) 6 (4.3) -61–65 1 29 (19.3) 76 (36.5) 66 (17.6) 24 (7.6) 12 (8.7) 1 (2.6) >65 2 - 56 (26.9) 265 (70.5) 278 (87.7) 120 (87.0) 38 (97.4) Physiology FVC, % predicted <0.001 >75 0 127 (84.7) 134 (64.4) 249 (66.2) 94 (29.7) 22 (15.9) -50-75 1 23 (15.3) 71 (34.1) 121 (32.2) 211 (66.6) 92 (66.7) 22 (56.4) <50 2 - 3 (1.4) 6 (1.6) 12 (3.8) 24 (17.4) 17 (43.6) DLCO, % predicted <0.001 >55 0 143 (95.3) 172 (82.7) 263 (69.9) 147 (46.4) 10 (7.2) -36–55 1 7 (4.7) 35 (16.8) 108 (28.7) 156 (49.2) 81 (58.7) 12 (30.8) ≤35 2 - 1 (0.5) 5 (1.3) 14 (4.4) 47 (34.1) 27 (69.2)
Note: Values in parentheses are percentages
“Cannot perform” in DLCOwas not recorded in this study
Total GAP score 3 group was compared with each group 2 and group 4 by Bonferroni adjustment. The following post hoc comparisons were significant at the adjusted p value = 0.05; Score 3 group versus Score 2 group (Gender, age, and DLCO, % predicted); Score 3 group versus Score 4 group (Gender, age, FVC, %
predicted and DLCO, %predicted)
radiologic scoring of fibrosis, dyspnea scale, and pulmon-ary artery hypertension, which could have provided more information on prognosis in IPF patients.
Conclusion
In summary, this study was designed as a national valid-ation study to evaluate GAP scores in relvalid-ation to the prognosis of patients with IPF. On the basis of our study results, we suggest that Group 3 could be separated from other GAP stage I patients and that reporting this score separately would improve mortality prediction.
Additional file
Additional file 1: Table S1. Comorbidities of idiopathic pulmonary fibrosis patients according to GAP score. Table S2. Initial presenting symptoms of study population. Table S3. Survival analysis with Cox proportional hazard model including age, sex, FVC (%), DLCO(%), and smoking. (DOCX 23 kb)
Abbreviations
% pred:Percentage of the predicted value; ABGA: Arterial blood gas analysis; CPI: Composite physiologic index; DLCO: Diffusing capacity of the lung for
carbon monoxide; FEV1: Forced expiratory volume; FVC: Forced vital capacity;
GAP: Gender, age, and 2 lung physiology variables (FVC and DLCO);
HRCT: High-resolution computed tomography; ILD: Interstitial lung disease; IPF: Idiopathic pulmonary fibrosis; PaCO2: Arterial carbon dioxide tension;
PaO2: Arterial oxygen tension; PFT: Pulmonary function test; TLC: Total lung capacity
Acknowledgements
We are grateful to all the members of The Korean Interstitial Lung Disease Research Group, as well as to the pulmonologists, radiologists, and pathologists at the 54 hospitals who helped to gather the data for analysis. Funding
None.
Availablity of data and materials
All data were available in the ILD web-based registry (www.ild.or.kr). Authors’ contributions
MSP and SHL conceived and designed the study. All authors contributed to participant recruitment, and data collection/acquisition. SYK and DSK analyzed the data and performed the statistical analysis. MSP and SHL wrote the first draft of the manuscript. All authors critically evaluated the data, reviewed the manuscript, and approved the final version.
Competing interests
The authors declare that they have no competing interests. Consent for publication
Not applicable.
Ethics approval and consent to participate
The study protocol was reviewed and approved by the Institutional Review Board (IRB) of Yonsei University Health Service, Severance Hospital (IRB approval number: 4-2009-0372); the IRB deemed that, because of the retrospective cohort nature of the study, informed consent was not necessary. Author details
1Department of Internal Medicine, Seoul National University College of
Medicine, Division of Pulmonary and Critical Care Medicine, Seoul National University Bundang Hospital, 166, Gumi-ro, Bundang-gu, 463-707 Seongnam-si, Gyeonggi-do, Republic of Korea.2Division of Pulmonology, Department of Internal Medicine, Severance Hospital, Institute of Chest Diseases, Yonsei University College of Medicine, 50-1, Yonsei-ro, Seodaemun-gu, Seoul 120-752, South Korea.3Division of Pulmonary and
Critical Care Medicine, University of Ulsan College of Medicine, Asan Medical Center, Seoul, South Korea.4Division of Pulmonary and Critical Care
Medicine, Department of Internal Medicine and Lung Institute, Seoul National University College of Medicine, Seoul, South Korea.5Division of Pulmonary and Critical Care Medicine, Samsung Medical Center,
Sungkyunkwan University School of Medicine, Seoul, South Korea.6Division
of Allergy and Respiratory Medicine, Department of Internal Medicine, Soonchunhyang University Seoul Hospital, Seoul, South Korea.7Division of Allergy and Respiratory Medicine, Department of Internal Medicine, Soonchunhyang University Bucheon Hospital, Seoul, South Korea.8Division
of Pulmonology, Department of Internal Medicine, Gachon University Gil Medical Center, Incheon, South Korea.9Division of Pulmonary, Allergy & Critical Care Medicine, Department of Internal Medicine, Hallym University Kangdong Sacred Heart Hospital, Chuncheon, South Korea.10Pulmonary
Division, Department of Internal Medicine, Inha University Hospital, Incheon, South Korea.11Division of Pulmonary Medicine, Department of Internal medicine, Chung Ang University College of Medicine, Seoul, South Korea.
12Division of Respiratory and Critical Care Medicine, Department of Internal
Medicine, Korea University Anam Hospital, Korea University College of Medicine, Seoul, South Korea.13Department of Internal Medicine, Ewha Womans University School of Medicine, Ewha Medical Research Institute, Seoul, South Korea.14Division of Pulmonary Medicine, Department of
Internal Medicine, Ulsan University Hospital, University of Ulsan College of Medicine, Ulsan, South Korea.15Division of Critical Care and Pulmonary Medicine, Department of Internal Medicine, Inje University Pusan Paik Hospital, Gimhae, South Korea.16Division of Allergy and Pulmonology,
Department of Internal Medicine, Bucheon St. Mary’s Hospital, The Catholic University of Korea School of Medicine, Seoul, South Korea.
Received: 15 July 2016 Accepted: 14 October 2016
References
1. Raghu G, Collard HR, Egan JJ, Martinez FJ, Behr J, Brown KK, Colby TV, Cordier JF, Flaherty KR, Lasky JA, et al. An official ATS/ERSARS/ALAT statement: idiopathic pulmonary fibrosis: evidence-based guidelines for diagnosis and management. Am J Respir Crit Care Med. 2011;183:788–824. 2. Lee SH, Shim HS, Cho SH, Kim SY, Lee SK, Son JY, Jung JY, Kim EY, Lim JE,
Lee KJ, et al. Prognostic factors for idiopathic pulmonary fibrosis: clinical, physiologic, pathologic, and molecular aspects. Sarcoidosis Vasc Diffuse Lung Dis. 2011;28:102–12.
3. Ley B, Collard HR, King TE. Clinical course and prediction of survival in idiopathic pulmonary fibrosis. Am J Respir Crit Care Med. 2011;183:431–40. 4. Caminati A, Harari S. IPF: New insight in diagnosis and prognosis. Respir
Med. 2010;104:S2–S10.
5. Ryerson CJ, Abbritti M, Ley B, Elicker BM, Jones KD, Collard HR. Cough predicts prognosis in idiopathic pulmonary fibrosis. Respirology. 2011;16:969–75. 6. American Thoracic Society. Idiopathic pulmonary fibrosis: diagnosis and
treatment. International consensus statement. American Thoracic Society (ATS), and the European Respiratory Society (ERS). Am J Respir Crit Care Med. 2000;161:646–664.
7. Swigris JJ, Kuschner WG, Jacobs SS, Wilson SR, Gould MK. Health-related quality of life in patients with idiopathic pulmonary fibrosis: a systematic review. Thorax. 2005;60:588–94.
8. Flaherty KR, Mumford JA, Murray S, Kazerooni EA, Gross BH, Colby TV, Travis WD, Flint A, Toews GB, Lynch 3rd JP, Martinez FJ. Prognostic implications of physiologic and radiographic changes in idiopathic interstitial pneumonia. Am J Respir Crit Care Med. 2003;168:543–8.
9. Romei C, Tavanti L, Sbragia P, De Liperi A, Carrozzi L, Aquilini F, Palla A, Falaschi F. Idiopathic interstitial pneumonias: do HRCT criteria established by ATS/ERS/JRS/ALAT in 2011 predict disease progression and prognosis? Radiol Med. 2015;120:930–40.
10. Enomoto N, Suda T, Kono M, Kaida Y, Hashimoto D, Fujisawa T, Inui N, Nakamura Y, Imokawa S, Funai K, Chida K. Amount of elastic fibers predicts prognosis of idiopathic pulmonary fibrosis. Respir Med. 2013;107:1608–16. 11. Rozanski C, Mura M. Multi-dimensional indeces to stage idiopathic
pulmonary fibrosis: a systematic review. Sarcoidosis Vasc Diffuse Lung Dis. 2014;31:8–18.
12. Ley B, Ryerson CJ, Vittinghoff E, Ryu JH, Tomassetti S, Lee JS, Poletti V, Buccioli M, Elicker BM, Jones KD, et al. A Multidimensional Index and Staging System for Idiopathic Pulmonary Fibrosis. Ann Intern Med. 2012;156:684–U658.
13. Agusti C. American thoracic society/European respiratory society international multidisciplinary consensus classification of the idiopathic interstitial pneumonias (vol 165, pg 277, 2002). Am J Respir Crit Care Med. 2002;166:426.
14. Wells AU, Desai SR, Rubens MB, Goh NSL, Cramer D, Nicholson AG, Colby TV, du Bois RM, Hansell DM. Idiopathic pulmonary fibrosis - A composite physiologic index derived from disease extent observed by computed tomography. Am J Respir Crit Care Med. 2003;167:962–9.
15. Ley B, Collard HR. Risk prediction in idiopathic pulmonary fibrosis. Am J Respir Crit Care Med. 2012;185:6–7.
16. King TE, Tooze JA, Schwarz MI, Brown KR, Cherniack RM. Predicting survival in idiopathic pulmonary fibrosis: Scoring system and survival model. Am J Respir Crit Care Med. 2001;164:1171–81.
17. Watters LC, King TE, Schwarz MI, Waldron JA, Stanford RE, Cherniack RM. A clinical, radiographic, and physiologic scoring system for the longitudinal assessment of patients with idiopathic pulmonary fibrosis. Am Rev Respir Dis. 1986;133:97–103.
18. Best AC, Meng JF, Lynch AM, Bozic CM, Miller D, Grunwald GK, Lynch DA. Idiopathic pulmonary fibrosis: Physiologic tests, quantitative CT indexes, and CT visual scores as predictors of mortality. Radiology. 2008;246:935–40. 19. Gay SE, Kazerooni EA, Toews CB, Lynch JP, Gross BH, Cascade PN, Spizarny
DL, Flint A, Schork MA, Whyte RI, et al. Idiopathic pulmonary fibrosis -Predicting response to therapy and survival. Am J Respir Crit Care Med. 1998;157:1063–72.
20. Mogulkoc N, Brutsche MH, Bishop PW, Greaves SM, Horrocks AW, Egan JJ, Fibro GMP. Pulmonary function in idiopathic pulmonary fibrosis and referral for lung transplantation. Am J Respir Crit Care Med. 2001;164:103–8. 21. du Bois RM, Weycker D, Albera C, Bradford WZ, Costabel U, Kartashov A,
Lancaster L, Noble PW, Raghu G, Sahn SA, et al. Ascertainment of individual risk of mortality for patients with idiopathic pulmonary fibrosis. Am J Respir Crit Care Med. 2011;184:459–66.
22. Richards TJ, Kaminski N, Baribaud F, Flavin S, Brodmerkel C, Horowitz D, Li K, Choi J, Vuga LJ, Lindell KO, et al. Peripheral blood proteins predict mortality in idiopathic pulmonary fibrosis. Am J Respir Crit Care Med. 2012;185:67–76. 23. Kim ES, Choi SM, Lee J, Park YS, Lee CH, Yim JJ, Yoo CG, Kim YW, Han SK,
Lee SM. Validation of the GAP score in Korean patients with idiopathic pulmonary fibrosis. Chest. 2015;147:430–7.
24. Kishaba T, Shimaoka Y, Fukuyama H, Nagano H, Nei Y, Yamashiro S, Tamaki H. Clinical characteristics of idiopathic pulmonary fibrosis patients with gender, age, and physiology staging at Okinawa Chubu Hospital. J Thorac Dis. 2015;7:843–9. 25. Ley B, Flicker BM, Hartman TE, Ryerson CJ, Vittinghoff E, Ryu JH, Lee JS,
Jones KD, Richeldi L, King TE, Collard HR. Idiopathic pulmonary fibrosis: CT and risk of death. Radiology. 2014;273:570–9.
26. Ryerson CJ, Vittinghoff E, Ley B, Lee JS, Mooney JJ, Jones KD, Elicker BM, Wolters PJ, Koth LL, King TE, Collard HR. Predicting survival across chronic interstitial lung disease the ILD-GAP model. Chest. 2014;145:723–8. 27. Ley B, Bradford WZ, Weycker D, Vittinghoff E, du Bois RM, Collard HR.
Unified baseline and longitudinal mortality prediction in idiopathic pulmonary fibrosis. Eur Respir J. 2015;45:1374–81.
28. Lee SH, Kim DS, Kim YW, Chung MP, Uh ST, Park CS, Jeong SH, Park YB, Lee HL, Song JS, et al. Association between occupational dust exposure and prognosis of idiopathic pulmonary fibrosis a Korean national survey. Chest. 2015;147:465–74.
29. Raghu G, Collard HR, Egan JJ, Martinez FJ, Behr J, Brown KK, Colby TV, Cordier JF, Flaherty KR, Lasky JA, et al. An official ATS/ERS/JRS/ALAT statement: idiopathic pulmonary fibrosis: evidence-based guidelines for diagnosis and management. Am J Respir Crit Care Med. 2011;183:788–824. 30. Hiwatari N, Shimura S, Sasaki T, Aikawa T, Ando Y, Ishihara H, Sekizawa K,
Sasaki H, Takishima T. Prognosis of idiopathic pulmonary fibrosis in patients with mucous hypersecretion. Am Rev Respir Dis. 1991;143:182–5. 31. Bednarek M, Gorecka D, Wielgomas J, Czajkowska-Malinowska M, Regula J,
Mieszko-Filipczyk G, Jasionowicz M, Bijata-Bronisz R, Lempicka-Jastrzebska M, Czajkowski M, et al. Smokers with airway obstruction are more likely to quit smoking. Thorax. 2006;61:869–73.
32. Kataoka K, Taniguchi H, Kondoh Y, Nishiyama O, Kimura T, Matsuda T, Yokoyama T, Sakamoto K, Ando M. Recombinant human thrombomodulin in acute exacerbation of idiopathic pulmonary fibrosis. Chest. 2015;148:436–43.
• We accept pre-submission inquiries
• Our selector tool helps you to find the most relevant journal
• We provide round the clock customer support
• Convenient online submission
• Thorough peer review
• Inclusion in PubMed and all major indexing services
• Maximum visibility for your research Submit your manuscript at
www.biomedcentral.com/submit