Assessment of Right Ventricular
Function and Lung Volumes using
Multi-detector Row Computed
Tomography in Chronic Obstructive
Pulmonary Disease Patients
Jin Hur
Department of Medicine
Assessment of Right Ventricular
Function and Lung Volumes using
Multi-detector Row Computed
Tomography in Chronic Obstructive
Pulmonary Disease Patients
비교
Directed by Professor Sang Jin Kim
The Master's Thesis
Submitted to the Department of Medicine
and the Graduate School of Yonsei University
in partial fulfillment of the
requirements for the degree of
Master of Medical Science
Jin Hur
This certifies that the Master's Thesis
of Jin Hur is approved.
───────────────────
Thesis Supervisor: Sang Jin Kim
─────────────────── Thesis Committee Member: Tae Hoon Kim
─────────────────── Thesis Committee Member: Choon Sik Yoon
The Graduate School Yonsei University
Acknowledgements
Over the past two years, many people have given me the support that has enabled me to obtain my degree. Without them, I couldn't possibly have survived the often difficult times. More importantly, it was their constructive criticism, insightful comments and refreshing perspectives on many subjects that have helped me to grow as a person. First, I would like to thank my advisor Sang Jin Kim for his support and confidence in my academic ability. Second, I would like to thank Tae Hoon Kim, he has shown me what it takes to be a great teacher, from explaining physical concepts for cardiac MDCT that were at first not obvious to me to correcting mistakes in my paper.
I am grateful to past and present staff members of our group who gave me continual advice when I was struggling with the demands of my residency. Many colleagues that I had known and have made while here at Yongdong Severance hospital were another source of strength and consolation when I was in pain going through hard times in my residency. Jae Hoon, Ki Hong, Eun Suk, Woo Suk, Sung Ho, Byung Jong, Chang Uk, Sang Min, Yu Jin, Chul Whan. Thank you all.
Last but certainly not least, I would like to thank my family for all the love and support they have given me over the past few years. Mom, Dad, Seok, and my lovely wife Kyoung Hee. Thank you.
Table of Contents
List of Figures ···
ⅱ
List of Tables ···
ⅲ
Abstract ··· 1
I. Introduction ··· 4
II. Materials and method ··· 7
1. Patients Selection ··· 7
2. Pulmonary Function Test ··· 7
3. MDCT examination ··· 8
4. MDCT data analysis ··· 10
5. Volumetric assessment technique (densitometry) ··· 11
6. Statistical analysis ··· 13
III. Results ··· 15
IV. Discussion ··· 23
V. Conclusion ··· 28
References ··· 29
List of Figures
Figure 1 Short-axis MPR images in end-diastolic,
and end-systolic phase ··· 10
Figure 2 Measurement of RV myocardial volume ··· 11
Figure 3 Lung volumetric assessment methods ··· 12
Figure 4A Interobserver agreement for measurements
of RV ejection fractions ··· 19
Figure 4B Interobserver agreement for measurements
of RV wall mass ··· 20
Figure 5A Bland-Altman-plot for the difference
of RV ejection fractions ··· 21
Figure 5B Bland-Altman-plot for the difference
List of Tables
Table 1 Results of pulmonary function test ··· 16
Table 2 Results of right ventricular measurements ··· 17
Table 3 Results of CT densitometry ··· 18
Abstract
Assessment of Right Ventricular Function and Lung Volumes using
Multi-detector Row Computed Tomography in Chronic Obstructive
Pulmonary Disease Patients
Jin Hur
Department of Medicine
The Graduate School, Yonsei University
Directed by Professor Sang Jin Kim
The purposes of this study was to evaluate the clinical usefulness of Multi-detector row computed tomography (MDCT) for the assessment of right ventricle (RV) function and lung volumes and to assess MDCT results and disease severity determined by pulmonary function test (PFT) in chronic obstructive pulmonary disease (COPD) patients.
PFT and cardiac MDCT were obtained in thirty-three COPD patients. Using the GOLD classification, patients were divided into three groups according to disease severity; stage I (mild, n=4), stage II (moderate, n=15), and stage III (severe, n=14). RV volumes, ejection fraction (EF) and wall mass were obtained by cardiac MDCT using a two-phase reconstruction method based on ECG. By analysis of histogram, the proportions of lung volumes with attenuation values below -910 and -950 HU were measured. Results were compared among groups using a one-way analysis of variance (ANOVA) with the Student-Newman-Keuls method. Pearson's correlation
was used to evaluate the relationship between RVEF and wall mass results with PFT results. P-values less than 0.05 were considered statistically significant.
The mean FEV1 (% of predicted) and FEV1/FVC were 82.2 ± 2% and 65.2 ± 2% in stage I, 53.5 ± 11% and 52 ± 6% in stage II, and 32.3 ± 7% and 44.2 ± 13% in stage III, respectively. The RVEF and mass were 47 ± 3% and 41 ± 2g in stage I, 46 ± 6% and 46 ± 5g in stage II, and 35 ± 5% and 55 ± 6g in stage III, respectively. The RVEDV was significantly lower in stage III than in stage I and II (p<0.01), whereas the RVESV was not significantly different among the three stages (p>0.05). In concordance, the RVEF was significantly lower in stage III than in stage I and II (p<0.01). The RV mass was significantly different among the three stages according to disease severity of COPD (p<0.05). There were no significant differences in RVEDV, RVESV, RVSV, and RVEF (p>0.05) between stage I and stage II. Correlation was excellent between MDCT results and FEV1 (r=.797 for RVEF and r=-.769 for RV mass) and FEV1/FVC (r=.745 for RVEF and r=-.718 for RV mass). Values for the lower attenuation volume at thresholds of -950 HU at inspiration were 11.2 ± 3% in stage I, 21.6 ± 8% in stage II, and 39.3 ± 12% in stage III. Values for the lower attenuation volume at thresholds of -910 HU at inspiration were 22.5 ± 5% in stage I, 37.7 ± 10% in stage II, and 51.6 ± 11% in stage III. Differences of percentages of lung volumes at thresholds of -950 HU and -910 HU among the three stages were statistically significant (11.2 ± 3% vs 21.6 ± 8% vs 39.3 ± 12%, P<0.01, and 22.5 ± 5% vs 37.7 ± 10% vs 51.6 ± 11%, P<0.01). The percentage lung volumes correlated well with the FEV1 (% of predicted) and FEV1/FVC (r=-.789 and r=-.812).
According to our study, cardiac MDCT has the potential to become a useful modality in assessment of RV function and RV myocardial hypertrophy in patients
with COPD. Our results showed that the mean RV wall mass measured by cardiac MDCT correlates well with COPD disease severity determined by PFT, and that the mean RVEF eventually decreased in patients with severe COPD. In addition, volumetric measurement obtained by MDCT can provide an accurate means of quantification of pulmonary emphysema.
Key words : Multi-detector row CT, Chronic obstructive pulmonary diseases, Heart
Assessment of Right Ventricular Function and Lung
Volumes using Multi-detector Row Computed
Tomography in Chronic Obstructive Pulmonary Disease
Patients
Jin Hur
Department of Medicine
The Graduate School, Yonsei University
Directed by Professor Sang Jin Kim
I. Introduction
The evaluation of the right ventricle function of the heart is clinically important for management of chronic obstructive pulmonary disease (COPD) because this disease is known to be complicated by the development of cor pulmonale.
Cor pulmonale is defined by the World Health Organization (WHO) as right ventricular (RV) hypertrophy resulting from a disorder that affects either the structure or the function of the lungs.1 For patients with COPD, a rapid, reproducible, and noninvasive technique for RV function assessment is clinically essential, because the development of cor pulmonale in these patients is related to mortality rate, and proper treatment may improve a patient's quality of life and prolong the survival.2,3
Although, RV function is defined as the ratio of the RV stroke volume (RVSV) and the RV end-diastolic volume (RVEDV), reliable measurement of RV volumes and mass, either by echocardiography, or radionuclide studies, has proven difficult because of the complex geometry of right ventricle.4,5 An additional problem in COPD patients is that emphysema often encountered in these patients, may disturb the transmission of echocardiographic or echo-doppler signals, especially when emphysema extends between the heart and thorax wall.6
Recently introduced multi-detector row computed tomography (MDCT) with subsecond rotation times and dedicated cardiac reconstruction algorithms has the ability to acquire thin-section spiral CT coronary angiograms.7,8 Using a helical scan technique, image data are continuously acquired throughout the entire cardiac cycle. Thus, additional end-diastolic and end-systolic images can be reconstructed retrospectively from the same MDCT data for functional analysis. Previous reports have shown that using cardiac MDCT for RV function assessment is a possible and acceptable technique.9,10
In COPD, assessment of the normal lung volume is important for monitoring the course of disease and the disease severity as well as evaluation of right ventricle function. Because, in COPD, it is mainly destruction (or failure to repair) of the lung parenchyma that leads to emphysema and there are also important structural alterations that occur in varying degrees to small bronchi and membranous bronchioli (i.e., airways <2 mm in diameter).11 The structural alterations at these two sites are considered as the most important contributors to the airflow limitation and to the accelerated decline of FEV1 in COPD. So, sequential measurements of FEV1 are mostly used for monitoring the progress of the disease. However, no single pulmonary function test exists to evaluate all the parameters considering the
diagnosis, assessment of severity, prognosis and the course of the disease.
High-resolution computed tomography (HRCT) is known as a useful method for quantifying the extent of emphysema. Several reports have mentioned the relationship between HRCT scan and pulmonary function test in COPD.12-16 As the range of CT values in the lung is strongly influenced by the content of air per voxel, quantitative volumetric CT assessment of emphysema entities by an analysis of the range, frequency, and distribution of the CT values using MDCT at a certain threshold may reflect the accurate extent of the emphysema.
The purpose of this study was to evaluate the clinical usefulness of MDCT for the assessment of RV function and lung volumes and to assess the relationship between these results and COPD disease severity as determined by pulmonary function test (PFT).
II. Materials and method
1. Patients Selection
Thirty-three patients with COPD underwent PFT and cardiac MDCT. Patients
are composed of 29 men and 4 women, aged from 50 to 71 years (mean age, 62 years).
The diagnosis of COPD was made by clinical examination, chest radiographs, and lung function parameters based on the Global Initiative for Chronic Obstructive Lung Disease (GOLD) Workshop Report.17 The following patients were excluded from our study: patients who had severe cardiac disease, diffuse or focal parenchymal abnormalities affecting more than one segment, and pleural effusion.
This study was approved by the institutional review boards, and informed consent was obtained from all patients for PFT and cardiac MDCT.
2. Pulmonary Function Test
PFT was performed in a dedicated pulmonary function laboratory, under the supervision of a certified pulmonary technologist, before cardiac MDCT
examinations. For all patients, the interval between PFT and cardiac MDCT was less than 1 weeks.
The PFT indexes were measured using a spirometer (Vmax 229, Sensormedics, USA). PFT parameters included the vital capacity (VC), the forced
expiratory volume in 1 sec (FEV1), the ratio of the forced expiratory volume in 1 sec to the forced vital capacity (FEV1/FVC), and diffusing capacity of the lung for carbon monoxide (DLCO). Values for VC, FEV1, FEV1/FVC, and DLCO were expressed as the percentages of predicted values (percentage of predicted).
All patients were divided in three groups according to disease severity based on GOLD workshop report17; stage I: (n=4, mild, FEV1/FVC < 70% of predicted, FEV1/predicted FEV1 > 0.8), stage II: (n=15, moderate, FEV1/FVC < 70% of predicted, 0.3 ≤ FEV1/predicted FEV1 < 0.8) and stage III:(n=14, severe, FEV1/FVC < 70% of predicted, FEV1/predicted FEV1 < 0.3 or FEV1/predicted FEV1 < 0.5 with respiratory failure or clinical signs of right heart failure).
3. MDCT examination
The cardiac MDCT scan was performed using a sixteen-slice helical CT (Somatom Sensation 16, software version VA20, Siemens Medical Solutions, Forchheim, Germany) in the caudo-cranial direction within a single breath-hold. The patient's ECG trace was simultaneously recorded. The scan parameters were as follows: 420 ms gantry rotation time, 120 kV, 500 mAs, 0.75 mm slice collimation, 1 mm slice width, and 2.8 mm table feed/rotation. IV administration of contrast solution, composed of 100 ml of contrast media (Ultravist 300; Schering, Berlin, Germany) mixed with 20 ml of normal saline, was administered intravenously at a rate of 4.5 ml for the first 20 seconds followed by rate of 1.5 ml for 20 seconds using a power injection (Envision CT, Medrad, USA). As a single head power injector was used, the contrast media was diluted with saline in order to reduce streaky artifact
caused by high concentration of contrast media in the right heart.
Image reconstruction was performed on the scanner's workstation using commercially available software (Syngo, Somaris/5, Siemens Medical Solutions, Germany). We used a partial scan algorithm, which provided a heart rate dependent temporal resolution between 70 msec and 210 msec from a 420-millisecond gantry rotation. The reconstruction parameters were as follows: a 1 mm slice thickness, a 0.5 mm increment, a 512 x 512 pixels image matrix, a medium smooth kernel, and a 20 cm field of view.
In order to identify the maximum systolic constriction and diastolic relaxation phases, we reconstructed two image sets based on the retrospective EGC triggering. The end-systolic phase was reconstructed when the reconstruction window was located at the halfway point of the ascending T-wave on ECG, and the end-diastolic phase was reconstructed when the window was at the start-point of the QRS complex on ECG.
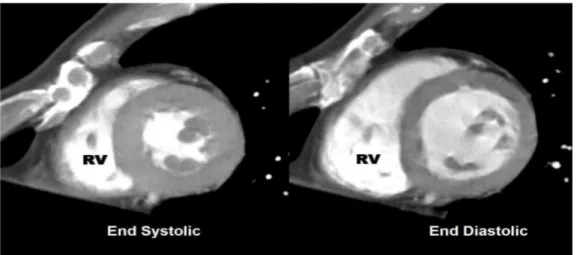
Multiplanar reformation (MPR) images in a 4-chamber view, and long and short axis orientation were reformatted using the scanner's standard 3D-software (Fig. 1). From the short axis orientation, MPR images with section thickness of 6 mm and without gap were produced to encompass the entire RV from base to apex.
The HRCT scan was performed before the cardiac CT scan using the same scanner without intravascular contrast material administration. The CT scan was performed in supine from the lung apices to the level of adrenal gland during inspiration with a slice thickness of 1 mm, taken at 10 mm intervals. The acquisition time is 1 second for each 1-mm thick section, and technical parameters are 120 Kvp and 174 mAs.
Figure 1. Short-axis MPR images in end-diastolic and end-systolic phase.
4. MDCT data analysis
Two radiologist independently evaluated the RVESV and RVEDV using commercially available software (Argus, Wizard, Siemens Medical Solutions, Germany). The endocardial contours of all the systolic and diastolic short-axis reformation images were manually traced on the screen of the analysis software. Both papillary muscles and trabeculations were considered part of the RV cavity. The areas containing a recognizable RV outflow tract below the pulmonary valve were included in the ventricular portion. The RVSV and RVEF were obtained by the analysis the software. Measurement of the RV myocardial volume was performed from a short-axis plane as described in the previous report.8 Endocardial and epicardial volumes were obtained using commercially available software, by tracing
endocardial and epicardial contours manually (Fig. 2). The ventricular septum was not considered part of the RV and not included in the mass measurements. Myocardial volume was assessed using the following equation: myocardial volume = (epicardial volume - endocardial volume) *1.05 (the specific gravity of heart).
Figure 2.Measurement of RV myocardialvolume.End systolic MPR (A) and end diastolic MPR (B) images in short-axis sections with markers indicating how endocardialandepicardialbordersofthesesectionsweretraced.Myocardialvolumewas assessed using the following equation: myocardial volume = (epicardial volume -endocardialvolume)*1.05(thespecificgravityofheart).
5. Volumetric assessment technique(densitometry)
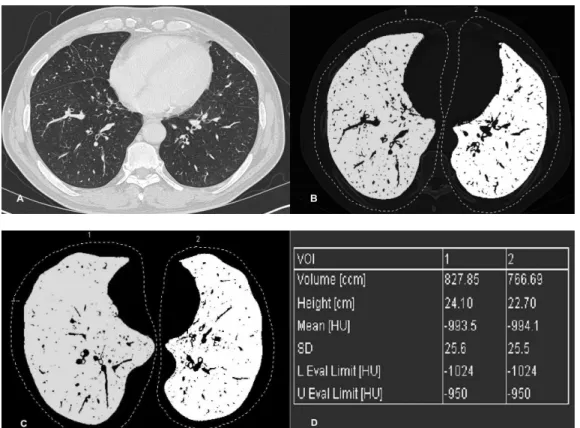
The HRCT scans were evaluated using a software program (Pulmo, Wizard, Siemens Medical Solutions, Germany) (Fig. 3A, 3B). The boundaries of each lung
were determined automatically by a density-discriminating computer program. Manual corrections of lung contour tracing were usually needed at the carina level due to irregular shape of the hilar bronchovascular structures. The trachea, mainstem bronchi, and air in the gastrointestinal structures were selectively removed.
Figure 3. Lung volumetric assessment methods. (A) Axial CT image from a 57-year-old man with COPD. (B) Image indicates the lung volume of attenuation at threshold from -600 to -1024 HU to exclude soft tissue surrounding the lung and large vessels within the lung. (C) Image indicates the lower attenuation volume of right (1) and left (2) lung at thresholds of -950HU. (D) Results obtained from the data set indicate the total lung volume of right (1) and left (2) lung below -950HU, mean attenuation, and SD of attenuation of the whole lung volume.
Threshold limits were from -600 to -1024 to exclude soft tissue surrounding the lung and large vessels within the lung. The volume, attenuation distribution, mean attenuation, and SD of attenuation of the whole lung volume were shown by a histogram display. The histogram provided a frequency of voxels with specific attenuation numbers (in HU) in the lung. The percentage of voxels with attenuation values below a specific level was defined as the lower attenuation volume at that threshold. Values for the lower attenuation volume at thresholds of -950, -910HU at inspiration were measured by moving the boundary line on the histogram (Fig. 3C, 3D). Thresholds for assessment of abnormally low attenuation of the lung were made on the basis of previous studies.11-14
Percentages of abnormally low attenuation of lung volumes were calculated using the following formulas: percentage of low attenuation of lung volume = 100 * [hypoattenuating volume (l)/total lung volume (l)].
6. Statistical analysis
Mean volumetric measurements by two observers were used for analysis. To evaluate the statistical significant differences in RV volumes, EF, and mass among the three COPD groups, we used one-way ANOVA with the Student-Newman-Keuls method. The RVEF and mass results were correlated with PFT results using Pearson's correlation. P-values less than 0.05 were considered statistically significant.
Percentages of abnormally low attenuation of lung volumes were compared among the three COPD groups using one-way ANOVA with the Student-Newman-
Keuls method. The percentages of abnormal low attenuation lung volumes were correlated with PFT results using Pearson's correlation. P-values less than 0.05 were considered statistically significant.
Pearson's correlation and Bland-Altman analysis were used to determine the correlation and limits of agreement between the two observers who used two-phase reconstruction method of cardiac MDCT for RVEF and mass measurements. Wilcoxon signed rank test was used to evaluate statistically significant differences in RVEF and mass between the two observers. P-values less than 0.05 were considered statistically significant.
SPSS software (Version 10.0 Statistical Package for the Social Sciences, Chicago, IL) was used for the statistical evaluations.
III. Results
Cardiac MDCT short axis reformations allowed a clear delineation of the endocardial contours of the RV in all COPD patients. In some patients, stair-step artifacts were visualized, which were more prominent in stage III than in stage I or II. However, there were no obstacles in the RV volume and mass evaluation.
The PFT results of 33 COPD patients are summarized in Table 1. There were four patients in stage I, fifteen in stage II, and fourteen in stage III. The mean FEV1 (% of predicted) and FEV1/FVC in stage I, stage II, and stage III was 82.2 ± 2% and 65.2 ± 2%, 53.5 ± 11% and 52 ± 6%, and 32.3 ± 7% and 44.2 ± 13% respectively.
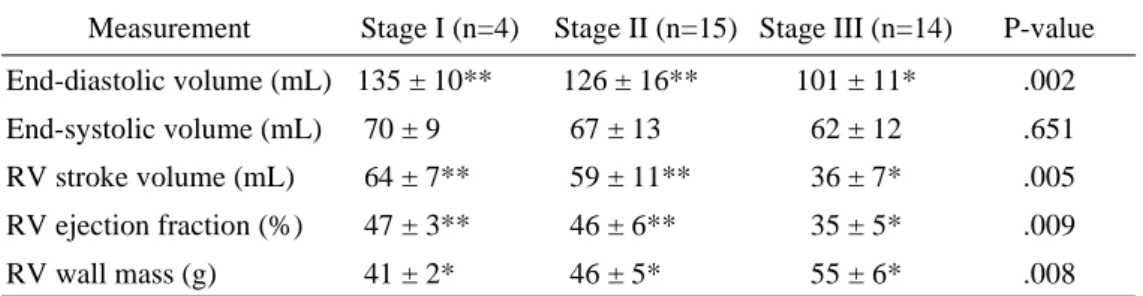
Table 2 shows the results of the of the RVEDV, RVESV, RVSV, RVEF, and RV mass in 33 patients with COPD. The RVEDV was significantly lower in stage III than in stage I and II (p<0.01), whereas the RVESV was not significantly different among the three stages (p>0.05). In concordance, the RVEF was significantly lower in stage III than in stage I and II (p<0.01). The RV mass was significantly different among the three stages according to COPD disease severity (p<0.05). There were no significant differences between stage I and stage II in RVEDV, RVESV, RVSV, and RVEF (p>0.05). Correlation was excellent between MDCT results and FEV1 (r=.797 for RVEF and r=-.769 for RV mass) and FEV1/FVC (r=.745 for RVEF and r=-.718 for RV mass).
Table 1. Results of Pulmonary Function Tests in 33 patients with Chronic Obstructive Pulmonary Disease
Parameter Stage I (n=4) Stage II (n=15) Stage III (n=14) VC (% of predicted) 97.3 ± 4 85.4 ± 13 71.9 ± 15 FEV1(% of predicted) 82.2 ± 2 53.5 ± 11 32.3 ± 7 FEV1/FVC(% of predicted) 65.2 ± 2 52.0 ± 6 44.2 ± 13 DLCO(% of predicted) 71.3 ± 2 48.3 ± 10 36.7 ± 12
VC: Vital capacity, FEV1: forced expiratory volume in 1 second, FEV1/FVC: the ratio of the forced expiratory volume in 1 second to the forced vital capacity, DLCO: diffusing capacity of the lung for carbon monoxide.
Stage I: (FEV1/FVC <70% of predicted, FEV1/predicted FEV1 >0.8) Stage II: (FEV1/FVC <70% of predicted, 0.3=FEV1/predicted FEV1 <0.8)
Stage III: (FEV1/FVC <70% of predicted, FEV1/predicted FEV1 <0.3 or FEV1/predicted FEV1 <0.5 with respiratory failure or clinical signs of right heart failure
n= number of patients
Table 2. Right Ventricular Measurements Obtained with Multi-detector CT Imaging in 33 Patients with Chronic Obstructive Pulmonary Disease
Measurement Stage I (n=4) Stage II (n=15) Stage III (n=14) P-value End-diastolic volume (mL) 135 ± 10** 126 ± 16** 101 ± 11* .002 End-systolic volume (mL) 70 ± 9 67 ± 13 62 ± 12 .651 RV stroke volume (mL) 64 ± 7** 59 ± 11** 36 ± 7* .005 RV ejection fraction (%) 47 ± 3** 46 ± 6** 35 ± 5* .009 RV wall mass (g) 41 ± 2* 46 ± 5* 55 ± 6* .008
Stage I: (FEV1/FVC <70% of predicted, FEV1/predicted FEV1 >0.8) Stage II: (FEV1/FVC <70% of predicted, 0.3=FEV1/predicted FEV1 <0.8)
Stage III: (FEV1/FVC <70% of predicted, FEV1/predicted FEV1 <0.3 or FEV1/predicted FEV1 <0.5 with respiratory failure or clinical signs of right heart failure)
n= number of patients
* - Significant differences among three stages. ** - No significant differences between two stages.
Note: Mean values +/- standard deviation (SD) are indicated. One-way ANOVA with Student-Newman-Keuls method was performed to evaluate the difference among the three stages, differences are considered significant at P <0.05 level.
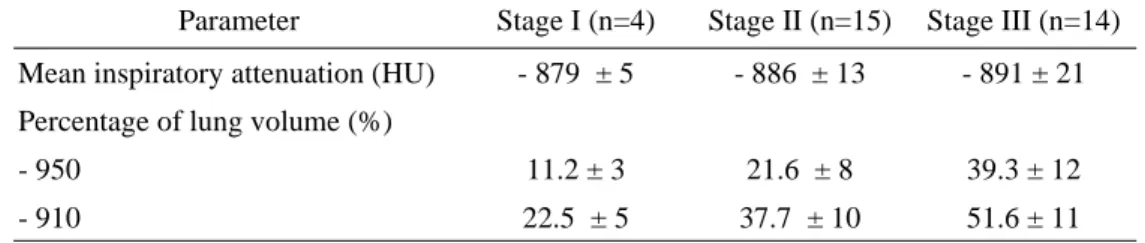
Table 3 shows the results of CT densitometry in 33 patients with COPD. Values for the lower attenuation volume at thresholds of -910 and -950 HU at inspiration were 22.5 ± 5% and 11.2 ± 3% in stage I, 37.7 ± 10% and 21.6 ± 8% in stage II, and 51.6 ± 11% and 39.3 ± 12% in stage III, respectively. Differences of percentages of lung volumes at thresholds of -910 and -950 HU among three stages were statistically significant (22.5 ± 5%, 37.7 ± 10%, and 51.6 ± 11%, p<0.01, 11.2 ± 3%, 21.6 ± 8%, and 39.3 ± 12%, p<0.01). The percentage lung volumes correlated well with the FEV1 (% of predicted) and FEV1/FVC (r=-.789 and r=-.812).
Table 3. Results of CT Densitometry in 33 Patients with Chronic Obstructive Pulmonary Disease
Parameter Stage I (n=4) Stage II (n=15) Stage III (n=14) Mean inspiratory attenuation (HU) - 879 ± 5 - 886 ± 13 - 891 ± 21 Percentage of lung volume (%)
- 950 11.2 ± 3 21.6 ± 8 39.3 ± 12
- 910 22.5 ± 5 37.7 ± 10 51.6 ± 11
Stage I: (FEV1/FVC <70% of predicted, FEV1/predicted FEV1 >0.8) Stage II: (FEV1/FVC <70% of predicted, 0.3=FEV1/predicted FEV1 <0.8)
Stage III: (FEV1/FVC <70% of predicted, FEV1/predicted FEV1 <0.3 or FEV1/predicted FEV1 <0.5 with respiratory failure or clinical signs of right heart failure)
n= number of patients
Note: Mean values plus or minus standard deviation (SD) are indicated.
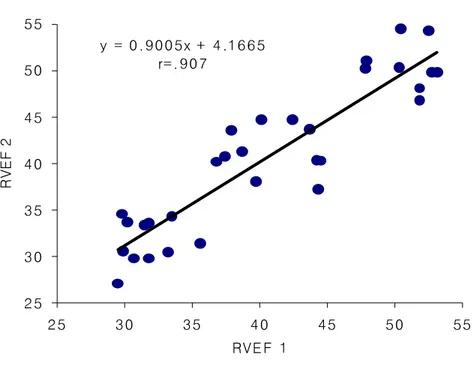
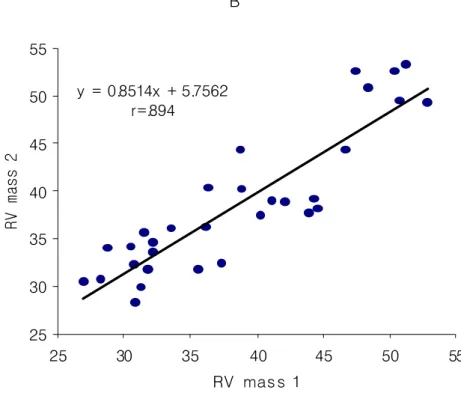
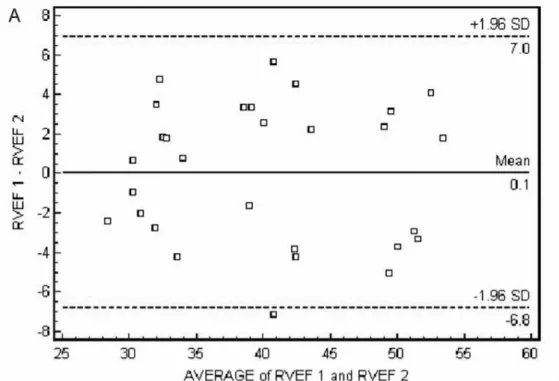
Interobserver agreement was good, with a correlation coefficient of .907 for RVEF, and a correlation coefficient of .894 for RV wall mass (Fig. 4). Mean differences between the two observers were 0.1 ± 6.9 for RVEF, and 0.1 ± 5.7 for RV mass, respectively (Fig. 5). There were no significant differences for RVEFand RV mass (p=0.74 for RVEF, and p=0.71 for RV mass, respectively) (Table 4).
Table 4. Interobserver Variability of Right Ventricular Measurements with Multidetector CT in 33 Patients with Chronic Obstructive Pulmonary Disease
n= number of patients
B-A Analysis. = Bland-Altman Analysis, W = Wilcoxon signed ranks test
Measurement (n=33) r P-value B-A Analysis W (P)
RV ejection fraction (%) .907 .001 0.1 ± 6.9 .74
A y = 0.9005x + 4.1665 r=.907 25 30 35 40 45 50 55 25 30 35 40 45 50 55 RVE F 1 R V E F 2
Figure 4A. Interobserver agreement of measurements of RV ejection fractions in 33 patients with COPD. Interobserver variation of RV ejection fraction measurements by two observers. Regression lines for measurements of RV ejection fraction was y = 0.9005x + 4.1665, with a correlation coefficient of 0.907.
B y = 0.8514x + 5.7562 r=.894 25 30 35 40 45 50 55 25 30 35 40 45 50 55 RV mas s 1 R V m a s s 2
Figure 4B. Interobserver agreement of measurements of RV wall mass in 33 patients with COPD. Interobserver variation of RV wall mass measurements by two observers. Regression lines for measurements of RV mass was y = 0.8514x + 5.7562, with a correlation coefficient of 0.894.
Figure 5A. Bland-Altman-plot for the difference of RV ejection fraction measurements between two observers in 33 patients with chronic obstructive pulmonary disease. The mean difference (bold line) ± 2SD (dash line) was 0.1 ± 6.9%.
Figure 5B. Bland-Altman-plot for the difference of RV mass measurements between two observers in 33 patients with chronic obstructive pulmonary disease. The mean difference (bold line) ± 2SD (dash line) was 0.1 ± 5.7g.
IV. Discussion
This study showed that the mean RV wall mass and, EF, measured by MDCT scan correlate with COPD disease severity.
It is known that RV hypertrophy occurs in numerous conditions, including valvular disease, lung disease and chronic left-sided heart failure.18,19 Chronic hypoxemia, which occurs in patients with COPD, leads to hypoxic pulmonary vasoconstriction and later to structural changes in the pulmonary vasculature. This contributes to the development of pulmonary arterial hypertension and causes increased RV afterload.4 RV hypertrophy may results from a response to this RV pressure overload.20,21 However, RVEF is well preserved in most patients with advanced emphysema during rest.4,22-24 A previous study by MacNee4 has shown that patients with COPD had normal RV ejection fractions when they were clinically stable, even though they had experienced episodes of right heart failure due to cor pulmonale. Pattynama et al,22 described that RVEF is not decreased in COPD patients, and that it is well preserved in most stable COPD patients. Biernacki et al.24 also demonstrated this in patients with stable COPD, despite the presence of pulmonary hypertension. In our study, RVEF between stage I (mild COPD patients) and stage II (moderate COPD patients) was not significantly different (47 ± 3% vs 46 ± 6%, P>0.05), whereas it was significantly lower in stage III (severe COPD patients). These results may reflect that with persistent RV pressure overload, compensated RV function falls and eventually results in RV failure.4
In addition, it has been strongly suggested that even in a hypertrophied RV the EF is preserved until relatively late in the course of the disease.24,25 However, if RV hypertrophy progresses and RVEDV decreases, compensated RV function can
eventually fall. In our study, RV mass was significantly different among the three stages of disease severity. It gradually increased with preservation of RVEF in stage I and stage II (mild and moderate COPD patients), however in stage III (severe COPD patients), RVEF eventually fell although RV mass increased.
Several imaging modalities, including echocardiography, angio-cardiography, and radionuclide imaging, have been used to evaluate RVEF and mass, however the success of these techniques is limited. Because of the complex shape and substernal location of the RV, it is difficult to estimate RV mass and function with most imaging techniques.26 RV visualization may be difficult with echocardiography because of its irregular shape.4 Furthermore, in patients with COPD, emphysema is often encountered, and may disturb the transmission of echocardiographic signals, especially when the emphysema extends between the heart and the thorax wall.6
Recently, magnetic resonance imaging (MRI) has been introduced for more accurate measurements of RV function and wall mass in COPD patients.22,23 Pattynama et al.22 used MRI to evaluated RV function and wall mass in 17 patients with moderate COPD and concluded that detection of RV myocardial hypertrophy with MRI may aid in early diagnosis of cor pulmonale complicating COPD. Advantages of cardiac MRI compared to MDCT are lack of radiation exposure, avoidance of iodinated contrast media, and improved temporal resolution in the evaluation of RV volumes and mass. Furthermore, short-axis images are readily available, and secondary reformations required in cardiac MDCT are not needed. However, cardiac MRI cannot evaluate lung parenchyma and is difficult in patients with dyspnea and heart failure due to a much longer examination time.
Recently introduced MDCT scanners have demonstrated their ability to perform RV function and wall mass assessment.9.10 Koch et al.9 demonstrated that the
mean RVEDV, RVESV, and RVSV determined with MPR by 16-detector-row CT correlated well with those measured by cardiac MRI. However, to our knowledge, there are no studies that evaluate RV function using MDCT in COPD patients.
Although cardiac MDCT can be used as a modality to evaluate RV volume, function, and wall mass in COPD patients, it has some limitations for routine use. Cardiac MDCT requires contrast media to discriminate the ventricular cavity, and its temporal resolution is inferior to either electron beam CT or MRI.27 Ritchie et al.28 reported that a temporal resolution of about 20 milliseconds is needed to completely avoid any motion artifact in cardiac imaging by CT. Thus, the limited temporal resolution used in our study may have been insufficient to acquire precise end systolic volume. Furthermore, in COPD patients, dyspnea often limits breath-holding for more than 10 seconds, and stair step artifact can affect ventricular function evaluation. It is hoped that, with technological developments, image quality will further improve and imaging time will be shortened. Another limitation is radiation exposure. Total radiation dose was calculated to be approximately 4 to 6 mSv depending on scan range and patient's body weight.
Advancement of the MDCT and workstation made it possible to obtain and analyze the lung volume data in order to generate histograms of attenuation in Housfield units for the lung.29 Measurement of CT pixel attenuation values provides an objective method for quantitating emphysema. Various techniques have been performed to separate the lung from other soft tissues in order to reduce the time involved for this analysis, but with use of these techniques available on most modern workstations, 3D lung models can be generated with volumetric data acquired in the MDCT. Measurement of voxel attenuation values is now possible without the need to transfer data to other computer systems. The lungs are easily separated from the
soft-tissue structures including trachea, main stem bronchi, and esophagus, with minimal postprocessing. With this model, the range of emphysema is readily determined by moving a boundary line to the defined threshold on a histogram of attenuation values that present whole lung.
By previous studies,12,13 the severity of anatomical emphysematous changes in HRCT correlate with PFT. By Arakawa A et al,13 their results showed good correlation of inspiratory and expiratory volumetric abnormally low attenuation of lung measurements to percentage of FEV1, FEV1/FVC, and DLCO. Our results also showed good correlation of inspiratory volumetric abnormally low attenuation of lung measurement to disease severity which reflect the physiologic values of pulmonary function test. We believe that volumetric scanning of the entire lung with MDCT can be useful and representative of underlying pulmonary function.
The low attenuation thresholds that have been used most widely to identify emphysema on conventional 10-mm-thick CT sections are -900 or -910 HU.30 Using thin section CT scans at 1-mm collimation without intravenous administration of contrast material. Gevenois et al 14,15 found that a lower attenuation threshold of -950 HU correlated best with morphologic emphysema. In our study, the low attenuation thresholds that were used are -910 and -950 HU using thin section CT scans at 1-mm collimation without intravenous administration of contrast material.
Our study includes the following limitations. First, the study population was too small to generalize results, especial for stage I (mild COPD patients). Second, we did not include normal control subjects for correlation of RV function. Third, MDCT results were not compared to cardiac MRI, which is the accepted gold standard modality. These problems will need to be solved in future studies.
application, radiation exposure, and limited temporal resolution, it provides an opportunity to assess RV function and wall mass in one breath-hold for patients with COPD, and allows direct depiction of coronary artery images in cases of suspected coronary artery disease. Furthermore, MDCT is a known useful method for quantifying the extent of emphysema. As the range of CT values in the lung is strongly influenced by the content of air per voxel, quantitative volumetric CT assessment of emphysema entities by an analysis of the range, frequency, and distribution of the CT values using MDCT at a certain threshold may reflect the accurate extent of the emphysema.
V. Conclusion
Our results showed that the mean RV wall mass measured by cardiac MDCT correlates well with COPD disease severity as determined by PFT and that the mean RVEF eventually decreased in patients with severe COPD. Thus despite several limitations, we believe that cardiac MDCT has the potential to become a useful modality in assessment of RV function and RV myocardial hypertrophy in COPD patients. In addition, we conclude that volumetric measurement obtained by MDCT can provide an accurate means of quantification of lung volume in COPD patients and the quantitative lung volumes measured by MDCT correlate well with disease severity determined by PFT. In the near future, cardiac MDCT with three dimensional technique can be useful for assessment of RV function and myocardial hypertrophy, allowing assessment of distribution and accurate extent of pulmonary emphysema in COPD patients.
References
1. World Health Organization. Chronic cor pulmonale: a report of the expert committee. Circulation 1963; 27:594-598.
2. Traver GA, Cline MG, Burrows B. Predictors of mortality in chronic obstructive pulmonary disease. A 15 year follow-up study. Am Rev Respir Dis 1979; 119: 895-902.
3. Medical Research Council Working Party. Long term domiciliary oxygen therapy in chronic hypoxic cor pulmonale complicating chronic bronchitis and emphysema. Lancet 1981; 1:681-686.
4. MacNee W. Right ventricular function in cor pulmonale. Cardiology 1988; 75 (suppl1):30-40.
5. Sechtem U, Pflugfelder PW, Gould RG, Cassidy MM, Higgins CB. Measurement of right and left ventricular volumes in healthy individuals with cine MR imaging. Radiology 1987; 163:697-702.
6. Berger HJ, Matthay RA. Noninvasive radiographic assessment of cardiovascular function in acute and chronic respiratory failure. Am J Cardiol 1981; 47:950-962. 7. Giesler T, Baum U, Ropers D, et al. Noninvasive visualization of coronary arteries
using contrast-enhanced multidetector CT: influence of heart rate on image quality and stenosis detection. AJR 2002; 179:911-916.
8. Achenbach S, Ulzheimer S, Baum U, et al. Noninvasive coronary angiography by retrospectively ECG-gated multislice spiral CT. Circulation 2000; 102:2823- 2828. 9. Koch K, Oellig F, Oberholzer K, et al. Assessment of right ventricular function by
16-detector-row CT: comparison with magnetic resonance imaging. Eur Radiol 2005; 15:312-318.
10. Kim TH, Hur J, Kim SJ, et al. Evaluation of right ventricular volume and mass using retrospective ECG-gated cardiac multidetector computed tomography: comparison with first-pass radionuclide angiography. Eur Radiol 2005 (in press) 11. Jeffery P. Remodeling in asthma and chronic obstructive lung disease. Am J Crit
Care Med 2001; 164:S28-S38.
12. Spiropoulos K, Trakada G, Kalamboka D, et al. Can high resolution computed tomography predict lung function in patients with chronic obstructive pulmonary disease? Lung 2003; 181:169-181.
13. Arakawa A, Yamashita Y, Nakayama Y, et al. Assessment of lung volumes in pulmonary emphysema using multidetector helical CT: comparison with pulmonary function tests. Computerized medical Imaging and Graphics 2001; 25: 399-404.
14. Gevenois PA, de Maertelaer V, De Vuyst P, et al. Comparison of computed density and macroscopic morphometry in pulmonary emphysema. Am J Respir Crit Care Med 1995; 152:653-657.
15. Gevenois PA, De Vuyst P, de Maertelaer V, et al. Comparison of computed density and microscopic morphometry in pulmonary emphysema. Am J Respir Crit Care Med 1996; 154:187-192.
16. Gevenois PA, De Vuyst P, Sy M, et al. Pulmonary emphysema: quantitative CT during expiration. Radiology 1996; 199:825-829.
17. Pauwels RA, Buist AS, Calverley PM, Jenkins CR, Hurd SS; GOLD Scientific Committee. Global strategy for the diagnosis, management, and prevention of chronic obstructive pulmonary disease. NHLBI/WHO Global Initiative for Chronic Obstructive Lung Disease (GOLD) Workshop summary. Am J Respir Crit Care Med 2001; 163:1256-12
18. Frab A, Burke AP, Virmani R. Anatomy and pathology of the right ventricle (including acquired tricuspid and pulmonary valve disease). Cardiol Clin 1992; 10:1-21.
19. Lee FA. Hemodynamics of the right ventricle in normal and disease states. Cardiol Clin 1992; 10:59-67.
20. Vlahakes GJ, Turley K, Hoffman JI. The pathophysiology of failure in acute right ventricular hypertension: hemodynamic and biochemical correlations. Circulation 1981; 63:87-95.
21. Vonk Noordegraaf A, Marcus JT, Roseboom B, Postmus PE, Faes TJ, de Vries PM. The effect of right ventricular hypertrophy on left ventricular ejection fraction in pulmonary emphysema. Chest 1997; 112:640-645.
22. Pattynama PM, Willems LN, Smit AH, van der Wall EE, de Roos A. Early diagnosis of cor pulmonale with MR imaging of the right ventricle. Radiology 1992; 182:375-379.
23. Marcus JT, Vonk Noordegraaf A, De Vries PM, et al. MRI evaluation of right ventricular pressure overload in chronic obstructive pulmonary disease. J Magn Reson Imaging 1998; 8:999-1005.
24. Biernacki W, Flenley DC, Muir AL, MacNee W. Pulmonary hypertension and right ventricular function in patients with COPD. Chest 1988; 94:1169-1175. 25. Oliver RM, Fleming JS, Dawkins KD, Waller DG. Right ventricular function at
rest and during exercise in chronic obstructive pulmonary disease. Comparison of two radionuclide techniques. Chest 1993; 103:74-80.
26. Boxt LM. Radiology of the right ventricle. Radiol Clin North Am 1999; 37:379-400.
27. Grude M, Juergens KU, Wichter T, et al. Evaluation of global left ventricular myocardial function with electrocardiogram-gated multidetector computed tomography: comparison with magnetic resonance imaging. Invest Radiol 2003; 38:653-661.
28. Ritchie CJ, Godwin JD, Crawford CR, Stanford W, Anno H, Kim Y. Minimum scan speeds for suppression of motion artifacts in CT. Radiology 1992; 185: 37-42.
29. Hu H, He HD, Foley WS, Fox SH. Four multidetector-row helical CT: image quality and volume coverage. Radiology 2000; 215:55-62.
30. Reinmuller RK, Behr J Kalender WA et al. Standarized quantitative high resolution CT in lung disease. J Comput Assist Tomogr 1991; 15:742-749.
Abstract (in Korea)
만성 폐쇄성폐질환 환자에서
Multi-detector Helical
CT
를이용한 우심실 기능 및 폐용적 평가의 유용성
지도 교수 : 김김김 상상상 진진진 연세대학교 대학원 의학과허
허
허
진
진
진
본 연구의 목적은 만성폐쇄성폐질환 (COPD) 환자에서 다절편 전산 화 단층촬영 (multi-detector row CT, 이하 MDCT 라함 )을 이용한 우심실 기 능 및 폐용적 평가의 임상적 유용성에 대하서 알아보고 폐기능 검사에 따 른 질병의 중증도와 MDCT를 이용한 우심실 기능 및 폐용적 측정치 간의 상관관계를 알아보고자 하였다 . 연구 대상은 폐기능 검사 및 심장 MDCT를 시행한 33명의 COPD 환 자들을 대상으로 하였다 . 폐기능 검사 결과를 기초로 Chronic ObstructiveLung Disease (GOLD) 분류 기준에 따라 33명의 COPD 환자들을 질병의 중증
도에 따라 다음과 같이 세 군으로 분류하였다 . 1군 : 경증의 COPD (n=4,
FEV1/FVC < 70%, FEV1 > 추정치의 80%), 2군 : 중등증의 COPD (n=15, FEV1/ FVC < 70%, 추정치의 30% ≤ FEV1 < 추정치의 80%), 그리고 3군 : 중증의 COPD (n=14, FEV1/FVC < 70%, FEV1 < 추정치의 30% 혹은 FEV1 < 50% 이면서
호흡부전 혹은 우심부전의 임상징후 동반 ).
영상과 수축기 말 정지영상을 획득한 후에 다면 구성영상 (Multi-planar
Reformation; MPR)을 재구성하는 방법을 이용하여 우심실의 용적 , 우심실의 근
량 , 그리고 우심실 구출율 (Ejection fraction)을 측정하였다 . 또한 고해상 전산화 단층촬영 (High Resolution CT; HRCT)으로 얻은 영상을 토대로 한 히스토그램
(histogram)을 분석하여 -910 HU 와 -950 HU 이하의 폐용적 비율을 측정하였다 .
이렇게 얻은 결과 값들을 일원분산분석 (one-way ANOVA)법 중 Student-
Newman-Keuls 검증을 이용하여 질병의 중증도에 따른 세 군 간의 차이를 비교 분석하였다 . 또한 환자 군들 간의 폐기능 검사 측정치와 심장 MDCT를 이용하 여 측정한 우심실 구출율 및 우심실의 근량간의 상관성을 Pearson 상관관계분석 을 이용하여 분석하였다 . Pearson 계수의 유의수준은 0.05 이하로 하였다 . 폐기능 검사 결과 평균 FEV1 (추정치 %)과 FEV1/FVC 측정치는 각각 경 증 COPD 환자 군에서는 82.2 ± 2% 와 65.2 ± 2%였으며 중등증 COPD 환자 군에 서는 53.5 ± 11% 와 52 ± 6%였으며 중증의 COPD 환자 군에서는 32.3 ± 7% 와 44.2 ± 13%였다 . 우심실 구출율 및 우심실의 근량은 각각 경증의 COPD 환자 군 에서는 47 ± 3% 와 41 ± 2g이었으며 중등증 COPD 환자 군에서는 46 ± 6% 와 46 ± 5g이였으며 중증의 COPD 환자 군에서는 35 ± 5% and 55 ± 6g이였다 . 우심실 이완기말 용적은 중증의 COPD 환자 군에서 경증 및 중등증 COPD 환자 군에 비 해서 유의하게 적었다 (p<0.01). 반면에 우심실 수축기말 용적은 세 환자군 간에 유의한 차이가 없었다 (p>0.05). 우심실 구출율은 중증의 COPD 환자 군에서 경 증 및 중등증 COPD 환자 군에 비해서 유의하게 낮았다 (p<0.01). 우심실의 근량 은 세 환자군 간에 유의한 차이가 있었다 (p<0.05). 우심실 이완기말 용적, 우심 실 수축기말 용적, 우심실 박출량, 그리고 우심실 구출율은 경증의 COPD 환자 군과 증등증의 COPD 환자 군 간에는 유의한 차이가 없었다 (p>0.05). MDCT 결 과 치와 FEV1 및 FEV1/FVC 측정치 간에는 높은 상관성을 보였다 (우심실 구출 율 r=.745, 그리고 우심실 근량 r= -.718).
히스토그램을 이용한 측정 결과 -950 HU 이하의 페용적 비율은 경증 COPD 환자 군에서는 11.2 ± 3%였으며 중등증 COPD 환자 군에서는 21.6 ± 8% 였으며 중증의 COPD 환자 군에서는 39.3 ± 12%였다 . -910 HU 이하의 페용적 비 율은 경증 COPD 환자 군에서는 22.5 ± 5%였으며 중등증 COPD 환자 군에서는 37.7 ± 10%였으며 중증의 COPD 환자 군에서는 51.6 ± 11%였다 . 세 환자군 간의 -950 HU 및 -910 HU 이하의 폐용적 비율은 유의한 차이를 보였다 (11.2 ± 3% vs 21.6 ± 8% vs 39.3 ± 12%, p<0.01, 그리고 22.5 ± 5% vs 37.7 ± 10% vs 51.6 ± 11%, p<0.01). 히스토그램을 이용하여 측정한 페용적 비율과 FEV1 (추정치 %) 및 FEV1/FVC 측정치 간에는 높은 상관성을 보였다 (r=-.789 그리고 r=-.812). 결론적으로 COPD 환자들에서 심장 MDCT를 이용한 우심실 기능 평가 및 우심실의 근량 측정은 유용하였다 . 본 연구에서는 COPD의 질병 중증도와 MDCT를 이용한 우심실 근량 측정치 간에는 유의한 연관성이 있음을 알 수 있 었다 . 아울러 MDCT를 이용한 폐용적 비율의 측정은 페기종의 정도를 객관적으 로 평가 할 수 있는 척도로 이용 될 수 있을 것이다 . 핵 핵핵심심심 되되되는는는 말말말 : 다절편 전산화 단층촬영 (MDCT), 만성폐쇄성폐질환 , 우심실 기능 , 폐 용적