국민건강영양조사 구강검사 현황 및 구강질환
유병률
질병관리본부 질병예방센터 건강영양조사과 우경지, 김혜진, 김윤정, 오경원*
*교신저자 : [email protected], 043-719-7460
Oral health examination of the Korea National Health and Nutrition
Examination Survey and prevalence of oral disease
Woo Gyeong-Ji, Kim Hye-Jin, Kim Yoonjung, Oh Kyung-Won
Division of Health and Nutrition Survey, Centers for Disease Prevention, KCDC
The Korea National Health and Nutrition Examination Survey (KNHANES) is a national surveillance system that has been assessing the health and nutritional status of Koreans since 1998. Based on the National Health Promotion Act, the surveys have been conducted by the Korea Centers for Disease Control and Prevention (KCDC). The oral health component of KNHANES obtained data to assess the oral health status of Koreans, determine the prevalence of dental caries and periodontal disease. The prevalence of dental caries in male declined from 41.6% in 2007 to 33.4% in 2015. The prevalence of dental caries was higher in 20s than in 70s among male and female. And the prevalence of periodontal disease in female declined from 29.4% in 2007 to 22.1% in 2015. The prevalence of periodontal disease was higher in 70s than in 20s among male and female. The prevalences of dental caries and periodontal disease increased with lower household income levels.
Key Words: Korea National Health and Nutrition Examination Survey(KNHANES), Oral examination, Dental caries,
들어가는 말
구강건강을 위협하는 대표적인 구강상병은 치아우식증과 치주질환으로 생애 전반에 걸쳐 발생하는 다빈도 질병이다. 치아우식증은 구강 내 세균에 의해 생긴 산에 의해 치아의 법랑질과 상아질이 탈회되는 과정으로, 아동 및 학령기에 구강건강에 대한 인식 부족, 구강관리 습관 등으로 인해 빈번하게 발생한다[1]. 치주질환은 치아표면에 형성되는 치면세균막과 이에 대한 숙주의 반응에 의해 치주조직이 파괴되어 치아 상실을 유발하는 만성 염증성 질환으로 성인에서 치아를 상실하는 주된 원인으로 알려져 있다[2]. 이로 인해 연령이 증가할수록 치아 상실로 이어지고, 저작 불편 및 발음 불편 등과 같이 구강기능에 영향을 준다. 국민의 구강건강 상태를 파악하고, 국민건강증진종합계획 (HP2020) 성과 평가를 위한 자료를 산출하기 위해 2007년부터 국민건강영양조사를 통해 구강검사를 실시하고 있다[3]. 이에 이 연구에서는 국민건강영양조사에서 수행하는 구강검사 항목, 질 관리 방법 및 우리나라 구강질환 현황을 파악하고자 하였다.몸 말
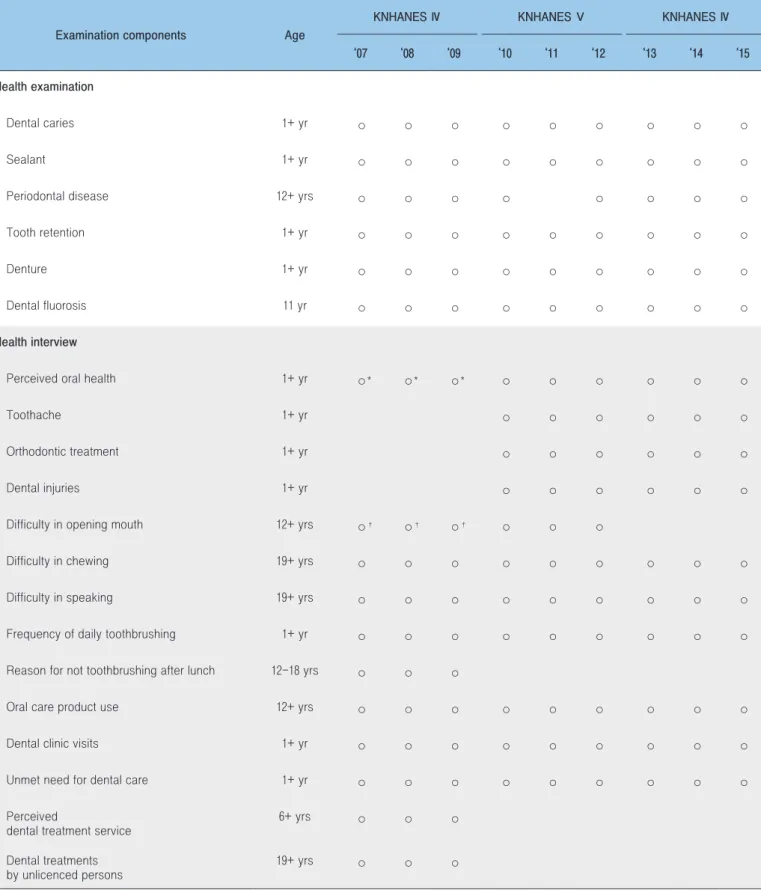
국민건강영양조사는 전국 연중 192개 조사구 4,416가구의 만1세 이상을 대상으로 건강설문, 검진 및 영양항목을 조사하고 있다[4]. 제6기 3차년도(2015) 검진조사 참여율은 73.4%이며 구강검사 참여율은 65.6%로 최근 3년간 검진조사 참여율은 큰 변화가 없으나 구강검사 참여율은 감소하였다. 국민건강영양조사 구강검사는 이동검진센터에서 질병관리본부 및 시ㆍ도에 배치되어 있는 공중보건치과의가 멸균된 치경(Dental mirror)과 치주탐침(Periodontal probe)을 이용하여 조사를 수행한다(Figure 1). 구강검사는 검진조사와 설문조사로 구성되어 있으며, 설문조사는 만1세 이상에서 칫솔질 빈도 및 만12세 이상 점심식사 후 칫솔질 미실천 이유와 구강위생용품 사용 여부 등을 조사하였으며, 연도별 조사항목은 표 1과 같다. 검진조사 항목은 WHO 구강검사 지침을 기반으로 만1세 이상 치아 및 보철물 상태, 치료 필요 및 보철물 필요를 측정하며, 만11세는 반점치 검사를 추가하였고, 만12세 이상은 치주탐침을 이용하여 치주 상태를 측정한다. 모든 치아검사는 치면단위로 검사하고, 만10세 미만은 유치와 영구치를 모두 측정하고, 만10세 이상은 영구치만 조사하며, 이에 관한한 자세한 지침은 구강검사 지침서에 상세히 기록되어 있다[5].A
B
Table 1. Oral health examination and interview components
Examination components Age
KNHANES Ⅳ KNHANES Ⅴ KNHANES Ⅳ
‘07 ‘08 ‘09 ‘10 ‘11 ‘12 ‘13 ‘14 ‘15
Health examination
Dental caries 1+ yr ○ ○ ○ ○ ○ ○ ○ ○ ○
Sealant 1+ yr ○ ○ ○ ○ ○ ○ ○ ○ ○
Periodontal disease 12+ yrs ○ ○ ○ ○ ○ ○ ○ ○
Tooth retention 1+ yr ○ ○ ○ ○ ○ ○ ○ ○ ○
Denture 1+ yr ○ ○ ○ ○ ○ ○ ○ ○ ○
Dental fluorosis 11 yr ○ ○ ○ ○ ○ ○ ○ ○ ○
Health interview
Perceived oral health 1+ yr ○* ○* ○* ○ ○ ○ ○ ○ ○
Toothache 1+ yr ○ ○ ○ ○ ○ ○
Orthodontic treatment 1+ yr ○ ○ ○ ○ ○ ○
Dental injuries 1+ yr ○ ○ ○ ○ ○ ○
Difficulty in opening mouth 12+ yrs ○† ○† ○† ○ ○ ○
Difficulty in chewing 19+ yrs ○ ○ ○ ○ ○ ○ ○ ○ ○
Difficulty in speaking 19+ yrs ○ ○ ○ ○ ○ ○ ○ ○ ○
Frequency of daily toothbrushing 1+ yr ○ ○ ○ ○ ○ ○ ○ ○ ○
Reason for not toothbrushing after lunch 12-18 yrs ○ ○ ○
Oral care product use 12+ yrs ○ ○ ○ ○ ○ ○ ○ ○ ○
Dental clinic visits 1+ yr ○ ○ ○ ○ ○ ○ ○ ○ ○
Unmet need for dental care 1+ yr ○ ○ ○ ○ ○ ○ ○ ○ ○
Perceived
dental treatment service
6+ yrs ○ ○ ○ Dental treatments by unlicenced persons 19+ yrs ○ ○ ○ *6 years over †19 years over
Prevalence of dental caries and periodontal disease, 2007-2015 Male Female ‘07 ‘08 ‘09 ‘10 ‘11 ‘12 ‘13 ‘14 ‘15 ‘07 ‘08 ‘09 ‘10 ‘11 ‘12 ‘13 ‘14 ‘15 † 41.6 37.6 37.4 37.5 36.3 37.9 36.9 34.5 33.4 36.7 33.8 31 30.7 29.5 32.1 29.5 28.3 24.9 57.8 46.8 44.9 41.6 42.0 44.4 40.0 38.1 39.8 48.4 42.3 35.7 35.3 36.7 34.0 31.2 28.0 28.9 45.6 40.3 44.6 42.2 38.3 43.1 39.0 38.7 37.0 37.5 36.4 32.1 34.1 26.1 37.1 33.2 33.8 24.8 33.2 33.8 34.1 37.0 34.5 36.5 35.5 33.3 29.8 34.1 32.4 29.3 30.7 32.9 32.4 28.1 25.6 23.1 32.8 29.8 28.3 30.7 32.4 30.5 32.6 32.0 31.7 26.2 25.1 29.8 26.3 23.9 28.5 27.5 24.6 25.1 27.2 33.2 29.4 32.5 30.8 28.3 33.2 27.5 24.4 36.0 29.5 25.3 23.1 24.7 22.5 25.3 24.9 21.7 41.5 33.0 29.5 31.3 33.3 32.1 38.1 27.6 28.2 27.5 26.6 28.4 25.0 25.4 28.7 25.8 31.0 22.5 † 40.8 44.8 46.4 43.1 43.2 43.6 46.0 41.0 41.9 47.8 40.4 35.2 33.4 34.8 40.2 35.6 33.7 33.2 45.1 39.0 39.9 38.3 35.3 38.7 34.7 38.3 33.9 37.8 35.8 33.5 32.4 30.6 33.5 28.8 31.4 25.2 41.1 36.6 34.1 32.2 36.6 33.2 36.3 30.3 30.6 35.8 34.1 29.4 30.1 31.1 25.7 30.8 26.5 24.1 41.1 29.9 28.5 36.2 29.7 34.7 30.5 27.5 27.4 25.1 25.7 25.9 26.1 20.7 27.6 22.8 20.7 17.8 ‡ † 40.7 38.4 35.4 28.4 -25.7 30.8 33.1 31.0 29.4 25.9 23.4 17.3 -15.9 19.7 20.0 22.1 9.7 5.9 7.3 8.0 -3.5 4.6 5.5 5.9 9.5 4.7 5.3 2.5 -1.4 3.1 3.0 4.3 30.5 27.7 24.7 18.5 -13.1 18.4 20.5 16.5 18.2 14.7 12.9 7.0 -8.4 10.9 12.7 14.5 49.1 49.8 48.0 36.3 -37.0 37.9 43.2 39.2 36.5 27.8 25.9 19.4 -15.1 21.7 20.4 20.8 63.6 59.9 57.2 46.8 -40.2 54.1 59.0 54.1 40.0 46.5 41.2 27.0 -29.2 30.9 31.6 40.2 64.8 64.1 53.8 44.6 -40.1 54.6 55.4 53.5 51.4 51.0 42.4 38.6 -32.9 39.6 44.8 42.2 66.9 61.9 50.9 41.3 -51.5 52.8 47.2 54.6 54.9 48.3 45.3 41.5 -39.0 44.6 38.1 42.9 † 45.2 43.5 37.1 29.2 -30.0 29.8 35.2 35.9 30.7 30.8 25.5 18.3 -20.3 24.7 22.3 26.7 43.2 40.8 40.3 29.2 -26.2 29.4 35.7 34.0 31.8 26.9 26.8 19.1 -17.3 19.9 22.0 24.1 38.2 34.9 35.0 29.7 -24.3 34.0 31.8 28.7 28.8 24.3 21.1 16.0 -13.7 18.1 17.7 19.4 38.6 35.6 29.5 24.8 -20.7 30.4 29.4 26.3 26.6 22.6 20.6 15.0 -11.3 15.7 17.9 18.0
l caries untreated filling or not pulled out teeth method, based on a 2005 population projection. one periodontal site with 4 millimeters or more of pocket dept
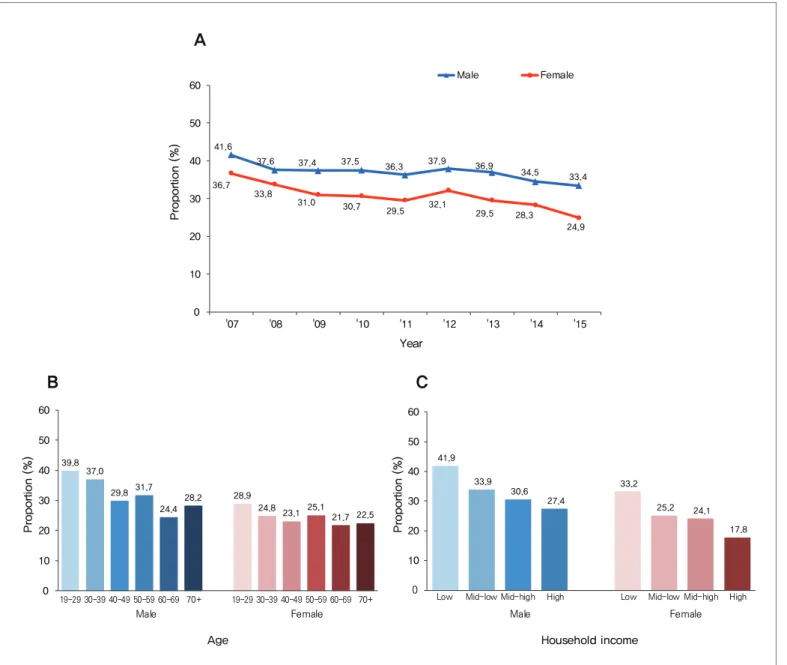
환류하고, 해당 조사원이 다음 조사에 참여할 경우 추가 현장 질 관리를 실시하였다. 구 강조 사 를 통해 영구치우식유병률, 치주질환 유병률, 구강기능제한율의 주요 지표를 연령별 및 소득수준에 따라 연도별로 제시하였다(Table 2). 영구치우식유병률(만19세 이상, 표준화)은 남자 2007년 41.6%에서 2015년 33.4%, 여자는 2007년 36.7%에서 2015년 24.9%로 2007년 이후 남녀 모두 지속적으로 감소 경향이었다. 남녀 모두 20대에 가장 높았으나 연령이 높을수록 조 사 수행 전 과 정의 질 관리를 위해 대한 예방치과· 구강보건학회 소속 역학조사위원회(치과대학 및 치의학전문대학원 교수진)가 주관하여 공중보건치과의 교육(연 2회, 회당 5일 이론, 모형교육, 모의검진) 및 현장 질 관리를 실시하였다. 현장 질 관리는 대상자 최소 5인 이상을 대상으로 역학조사위원과 조사원이 반복검사를 시행하여 조사항목별 일치도를 평가한 후 항목별 일치도가 낮은 경우(Kappa 기준: 치아상태 0.6 미만, 치주상태 0.5 미만) 현장에서 구강검사 조사원에게 결과 를 A B C 39.8 37.0 29.8 31.7 24.4 28.2 28.9 24.8 23.1 25.1 21.7 22.5 0 10 20 30 40 50 60 19-29 30-39 40-49 50-59 60-69 70+ 19-29 30-39 40-49 50-59 60-69 70+ Male Female P ro p o rt io n (% ) P ro p o rt io n (% ) P ro p o rt io n (% ) Age 41.9 33.9 30.6 27.4 33.2 25.2 24.1 17.8 0 10 20 30 40 50 60
Low Mid-low Mid-high High Low Mid-low Mid-high High
Male Female Household income 41.6 37.6 37.4 37.5 36.3 37.9 36.9 34.5 33.4 36.7 33.8 31.0 30.7 29.5 32.1 29.5 28.3 24.9 0 10 20 30 40 50 60 '07 '08 '09 '10 '11 '12 '13 '14 '15 Year Male Female
Figure 2. Prevalence of dental caries among adults aged 19 and over, by year, sex and age, and household income level, 2015
*Dental caries: proportion of people having at least one dental caries untreated filling or not pulled out teeth ※Proportions were calculated using the direct standardization method, based on a 2005 population projection.
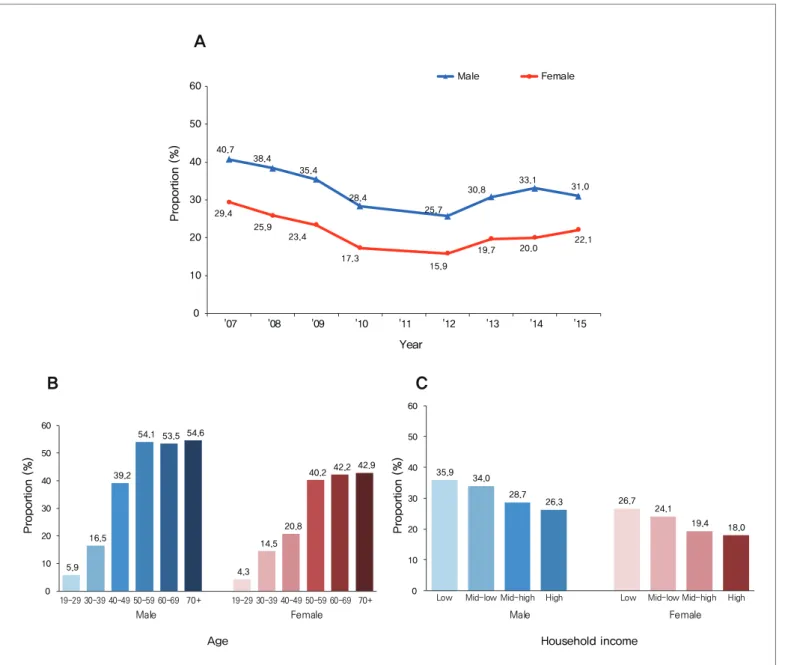
40.7 38.4 35.4 28.4 25.7 30.8 33.1 31.0 29.4 25.9 23.4 17.3 15.9 19.7 20.0 22.1 0 10 20 30 40 50 60 '07 '08 '09 '10 '11 '12 '13 '14 '15 Male Female A P ro p o rt io n (% ) P ro p o rt io n (% )
Low Mid-low Mid-high High Low Mid-low Mid-high High
Male P ro p o rt io n (% ) Year 5.9 16.5 39.2 54.1 53.5 54.6 4.3 14.5 20.8 40.2 42.2 42.9 0 10 20 30 40 50 60 19-29 30-39 40-49 50-59 60-69 70+ 19-29 30-39 40-49 50-59 60-69 70+ Male Female 35.9 34.0 28.7 26.3 26.7 24.1 19.4 18.0 0 10 20 30 40 50 60 B C
Age Household income
Female
Figure 3. Prevalence of periodontal disease among adults aged 19 and over, by year, sex and age, and household income level, 2015
*Periodontal disease: proportion of people having at least one periodontal site with 4 millimeters or more of pocket depth ※Proportions were calculated using the direct standardization method, based on a 2005 population projection.
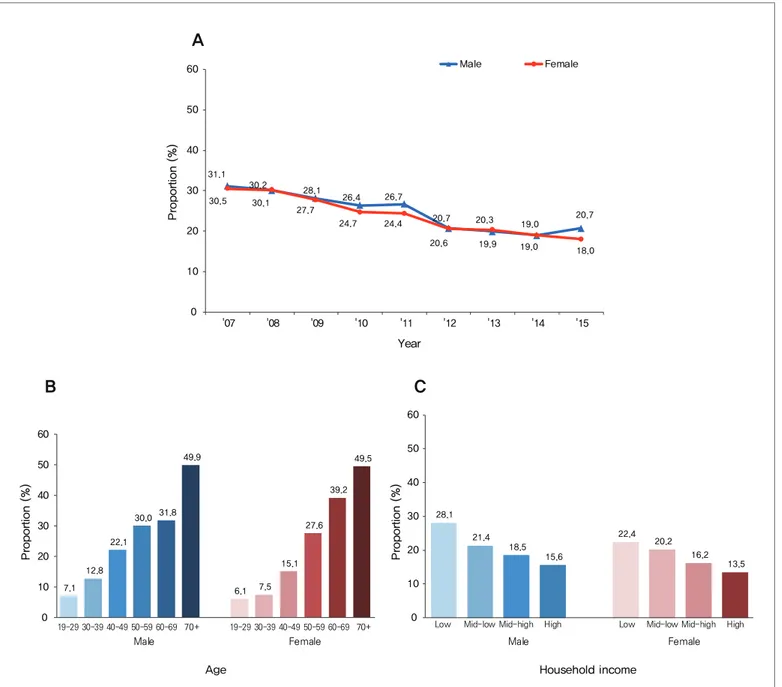
영구치우식유병률은 감소 경향이었다(Figure 2). 치주질환 유병률(만19세 이상, 표준화)은 남자의 경우 2007년 40.7%에서 2015년 31.0%, 여자는 2007년 29.4%에서 2015년 22.1%로 감소하는 경향을 보였다. 남녀 모두 연령이 높을수록 높아져, 70세 이상에서 가장 높았으며 50대부터 급격하게 증가하는 경향을 보였다(Figure 3). 저작 또는 발음이 불편한 구강기능제한율(만19세 이상, 표준화)은 남녀 각각 2007년 31.1%, 30.5%에서 2012년 20.7%, 20.6%로 감소한 이후 약 20% 수준을 유지하였다. 남녀 모두 연령이 높을수록 높으며, 70세 이상에서 가장 높았다(Figure 4). 영구치우식 및 치주질환 유병률, 구강기능제한율의 소득수준별 분포는 남녀 모두 소득수준이 낮을수록 높은 경향이었다.
맺는 말
국민건강영양조사 구강검사를 통해 2007년부터 국가단위 구강질환 유병률을 산출하고 있으며, 그 결과 치아우식증, 치주질환 유병률과 구강기능제한율은 2007년 이후 감소 경향을 보였다. 그러나 연령별로는 치아우식증 유병률은 20대에서 가장 높았고, 치주질환 유병률은 50대 이후 증가하였으며, 구강기능제한율의 경우 70세 이상에서 높았다. 우리나라 성인의 구강질환 유병률은 감소하고 있으나, 여전히 소득수준이 낮은 집단에서 유병률이 높아 소득수준별 격차가 크고, 70세 이상의 경우 치주질환 유병률과 구강기능제한율이 약 50% 수준을 보이므로 구강질환이 발생하지 않도록 전 생애에 걸친 예방관리 사업과 취약계층 대상의 맞춤형 A P ro p o rt io n (% ) P ro p o rt io n (% )Low Mid-low Mid-high High Low Mid-low Mid-high High
Male P ro p o rt io n (% ) Year 19-29 30-39 40-49 50-59 60-69 70+ 19-29 30-39 40-49 50-59 60-69 70+ Male Female 31.1 30.1 28.1 26.4 26.7 20.7 19.9 19.0 20.7 30.5 30.2 27.7 24.7 24.4 20.6 20.3 19.0 18.0 0 10 20 30 40 50 60 '07 '08 '09 '10 '11 '12 '13 '14 '15 Male Female 7.1 12.8 22.1 30.0 31.8 49.9 6.1 7.5 15.1 27.6 39.2 49.5 0 10 20 30 40 50 60 28.1 21.4 18.5 15.6 22.4 20.2 16.2 13.5 0 10 20 30 40 50 60 B C
Age Household income
Female
Figure 4. Percentage of problem chewing or pronunciation among adults aged 19 and over, by year, sex and age, and household income level, 2015
*Problem chewing or pronunciation: proportion of people reporting current chewing or pronunciation difficulty because of problems with teeth, mouth or dentures ※Proportions were calculated using the direct standardization method, based on a 2005 population projection.
구강보건 사업의 지속적 추진이 필요하다. 질병관리본 부 는 국민건강영양조사를 통해 구강정책 및 사업의 근거자료 생산을 위한 구강건강 현황을 모니터링 할 계획이다.
참고문헌
1. Kim JH, et al. The comparison of the characteristics of Streptococcus mutans isolated from caries free and high careis children. J Korean Acad Oral Health 2012;36:1-6.
2. Woo DH, et al. Risk indicators of periodontal disease in Korea adults. J Korean Acad Oral Health 2013;37:95-102.
3. Ministry of Health & Welfare, Korea Centers for Disease Control & Prevention. Korea health statistics 2015: Korea national health and nutrition examination survey (KNHANES VI-3). Cheongju: Korea Centers for Disease Control & Prevention. 2016;1-20.
4. Kweon SY, et al. Data resource profile: The Korea national health and nutrition examination survey (KNHANES). Int J Epidemiol. 2014;43(1):69-77.
5. Ministry of Health & Welfare, Korea Centers for Disease Control & Prevention. The sixth Korea national health and nutrition examination survey (2013-2015) guideline. Cheongju: Korea Centers for Disease Control and Prevention. 2015;167-218.