저작자표시 2.0 대한민국 이용자는 아래의 조건을 따르는 경우에 한하여 자유롭게 l 이 저작물을 복제, 배포, 전송, 전시, 공연 및 방송할 수 있습니다. l 이차적 저작물을 작성할 수 있습니다. l 이 저작물을 영리 목적으로 이용할 수 있습니다. 다음과 같은 조건을 따라야 합니다: l 귀하는, 이 저작물의 재이용이나 배포의 경우, 이 저작물에 적용된 이용허락조건 을 명확하게 나타내어야 합니다. l 저작권자로부터 별도의 허가를 받으면 이러한 조건들은 적용되지 않습니다. 저작권법에 따른 이용자의 권리는 위의 내용에 의하여 영향을 받지 않습니다. 이것은 이용허락규약(Legal Code)을 이해하기 쉽게 요약한 것입니다. Disclaimer 저작자표시. 귀하는 원저작자를 표시하여야 합니다.
A THESIS FOR THE DEGREE OF MASTER OF SCIENCE
Comparative Evaluation of Antioxidative
and Antibacterial Activities of Erythorbyl
Laurate in Oil-in-Water Emulsions with
Different Emulsifiers and Droplet Sizes
유화제와 입자크기가 다른 수중유적형
유화액내에서 erythorbyl laurate의
항산화 및 항균력 비교
February, 2018
Department of Agricultural Biotechnology Seoul National University
I
Abstract
Erythorbyl laurate (EL) is a multi-functional emulsifier with antioxidative and antibacterial activities for simultaneously controlling the lipid oxidation and microbial contamination in emulsion-based food. In the previous study, the antioxidative activity of EL in emulsion was enhanced since EL was located in the interface where lipid oxidation occurred in the emulsion. In addition, EL showed no inhibitory effect in aqueous system, but showed the inhibitory effect in emulsion against gram-negative bacteria. Hence, it was expected that emulsifying properties could affect the antioxidative and antibacterial activities of EL.
Emulsions were prepared with different emulsifiers and droplet sizes. Tween-series emulsifiers were used and sonication time was controlled to prepare emulsions with different droplet sizes. Then the antioxidative and antibacterial activities of EL in the emulsions were compared.
Concentrations of lipid peroxides in Tween 20-, Tween 40-, Tween 60-, and Tween 80-stabilized emulsions with EL after 9 days were determined to be 35.95±4.05, 49.17±4.55, 51.74±9.18, and 70.79±0.59 mmol/kg oil, respectively. The result could be explained in terms of the quantity of EL caused by different packing of EL in the interface according to type of
II
emulsifier. EL could be densely packed in the interface of Tween 20-stabilized emulsion since Tween-20 has lauric acid as a fatty acid with the same as EL. In contrast, EL could not be packed densely in Tween 80-stabilized emulsion due to a double bond kink structure in fatty acid of Tween 80. Concentrations of lipid peroxides in Tween 20-stabilized emulsions with EL containing droplet sizes of 261.80, 430.67, and 688.55 nm after 12 days were found out to be 65.97±3.23, 51.92±2.16, and 35.79±5.71 mmol/kg oil, respectively. It was reported that interfacial area of emulsion increased by reduction of droplet size and consequently oxidation occurs rapidly. Thus, there was no effect of droplet size on antioxidative activity of EL in emulsion.
Minimum bactericidal concentrations of Tween 20-, Tween 40-, Tween 60-, and Tween 80-stabilized emulsions with EL after treatment for 12 h were 0.040±0.000, 0.057±0.006, 0.087±0.012, and 0.090±0.010%, respectively. EL in Tween 20- and Tween 80-stabilized emulsions showed the highest and the lowest antibacterial activity, respectively, due to the different amount of EL in the interface. Effect of droplet size on antibacterial activity of EL in emulsion was difficult to investigate due to micelle formation formed by the remaining emulsifiers in the continuous phase.
Consequently, this study revealed that the antioxidative and antibacterial activities of EL in emulsion were affected by hydrophobic tail length and
III
double bond of the emulsifier mixed with EL. Therefore, when applying EL to emulsion-based food, hydrophobic tail length and double bond of the emulsifier mixed with EL should be considered. When EL mixed with an emulsifier structurally similar to EL, such as Tween 20, which composed of the lauric acid (12:0), the functionality of EL can be improved.
Keywords: Erythorbyl laurate, Antioxidative activity, Antibacterial activity, Emulsifier, Droplet size, O/W emulsion
IV
Contents
Abstract∙∙∙∙∙∙∙∙∙∙∙∙∙∙∙∙∙∙∙∙∙∙∙∙∙∙∙∙∙∙∙∙∙∙∙∙∙∙∙∙∙∙∙∙∙∙∙∙∙∙∙∙∙∙∙∙∙∙∙∙∙∙∙∙∙∙∙∙∙∙∙∙∙∙∙∙∙∙∙∙∙∙∙∙∙∙∙∙∙∙∙∙∙∙∙∙∙∙∙∙∙∙∙∙∙∙∙∙I Contents∙∙∙∙∙∙∙∙∙∙∙∙∙∙∙∙∙∙∙∙∙∙∙∙∙∙∙∙∙∙∙∙∙∙∙∙∙∙∙∙∙∙∙∙∙∙∙∙∙∙∙∙∙∙∙∙∙∙∙∙∙∙∙∙∙∙∙∙∙∙∙∙∙∙∙∙∙∙∙∙∙∙∙∙∙∙∙∙∙∙∙∙∙∙∙∙∙∙∙∙∙∙∙∙∙IV List of tables∙∙∙∙∙∙∙∙∙∙∙∙∙∙∙∙∙∙∙∙∙∙∙∙∙∙∙∙∙∙∙∙∙∙∙∙∙∙∙∙∙∙∙∙∙∙∙∙∙∙∙∙∙∙∙∙∙∙∙∙∙∙∙∙∙∙∙∙∙∙∙∙∙∙∙∙∙∙∙∙∙∙∙∙∙∙∙∙∙∙∙∙∙∙∙∙∙∙VII List of figures ∙∙∙∙∙∙∙∙∙∙∙∙∙∙∙∙∙∙∙∙∙∙∙∙∙∙∙∙∙∙∙∙∙∙∙∙∙∙∙∙∙∙∙∙∙∙∙∙∙∙∙∙∙∙∙∙∙∙∙∙∙∙∙∙∙∙∙∙∙∙∙∙∙∙∙∙∙∙∙∙∙∙∙∙∙∙∙∙∙∙∙∙∙∙VIII 1. Introduction∙∙∙∙∙∙∙∙∙∙∙∙∙∙∙∙∙∙∙∙∙∙∙∙∙∙∙∙∙∙∙∙∙∙∙∙∙∙∙∙∙∙∙∙∙∙∙∙∙∙∙∙∙∙∙∙∙∙∙∙∙∙∙∙∙∙∙∙∙∙∙∙∙∙∙∙∙∙∙∙∙∙∙∙∙∙∙∙∙∙∙∙∙∙∙∙∙∙1 2. Materials and methods∙∙∙∙∙∙∙∙∙∙∙∙∙∙∙∙∙∙∙∙∙∙∙∙∙∙∙∙∙∙∙∙∙∙∙∙∙∙∙∙∙∙∙∙∙∙∙∙∙∙∙∙∙∙∙∙∙∙∙∙∙∙∙∙∙∙∙∙∙∙∙∙∙∙∙∙∙∙∙∙∙∙4 2.1. Materials∙∙∙∙∙∙∙∙∙∙∙∙∙∙∙∙∙∙∙∙∙∙∙∙∙∙∙∙∙∙∙∙∙∙∙∙∙∙∙∙∙∙∙∙∙∙∙∙∙∙∙∙∙∙∙∙∙∙∙∙∙∙∙∙∙∙∙∙∙∙∙∙∙∙∙∙∙∙∙∙∙∙∙∙∙∙∙∙∙∙∙∙∙∙∙∙4 2.2. Production of erythorbyl laurate∙∙∙∙∙∙∙∙∙∙∙∙∙∙∙∙∙∙∙∙∙∙∙∙∙∙∙∙∙∙∙∙∙∙∙∙∙∙∙∙∙∙∙∙∙∙∙∙∙∙∙∙∙∙∙∙∙∙∙∙5 2.3. Preparation of O/W emulsion∙∙∙∙∙∙∙∙∙∙∙∙∙∙∙∙∙∙∙∙∙∙∙∙∙∙∙∙∙∙∙∙∙∙∙∙∙∙∙∙∙∙∙∙∙∙∙∙∙∙∙∙∙∙∙∙∙∙∙∙∙∙∙∙7 2.3.1. Composition and manufacturing process of O/W emulsion∙∙∙∙∙∙∙∙7 2.3.2. Factors affecting droplet size and optimum conditions of emulsification∙∙∙∙∙∙∙∙∙∙∙∙∙∙∙∙∙∙∙∙∙∙∙∙∙∙∙∙∙∙∙∙∙∙∙∙∙∙∙∙∙∙∙∙∙∙∙∙∙∙∙∙∙∙∙∙∙∙∙∙∙∙∙∙∙∙∙∙∙∙∙∙∙∙∙∙∙8 2.3.3. O/W emulsion preparation with different emulsifying properties∙∙∙∙∙∙∙∙∙∙∙∙∙∙∙∙∙∙∙∙∙∙∙∙∙∙∙∙∙∙∙∙∙∙∙∙∙∙∙∙∙∙∙∙∙∙∙∙∙∙∙∙∙∙∙∙∙∙∙∙∙∙∙∙∙∙∙∙∙∙∙∙∙∙∙∙∙∙∙∙∙∙∙8 2.4. Measurement of droplet size∙∙∙∙∙∙∙∙∙∙∙∙∙∙∙∙∙∙∙∙∙∙∙∙∙∙∙∙∙∙∙∙∙∙∙∙∙∙∙∙∙∙∙∙∙∙∙∙∙∙∙∙∙∙∙∙∙∙∙∙∙∙∙∙∙∙9 2.5. Comparative evaluation of antioxidative activity of erythorbyl laurate in O/W emulsion∙∙∙∙∙∙∙∙∙∙∙∙∙∙∙∙∙∙∙∙∙∙∙∙∙∙∙∙∙∙∙∙∙∙∙∙∙∙∙∙∙∙∙∙∙∙∙∙∙∙∙∙∙∙∙∙∙∙∙∙∙∙∙∙∙∙∙∙∙∙∙∙∙∙∙∙∙∙∙∙∙10
V
2.6. Comparative evaluation of antibacterial activity of erythorbyl laurate in O/W emulsion∙∙∙∙∙∙∙∙∙∙∙∙∙∙∙∙∙∙∙∙∙∙∙∙∙∙∙∙∙∙∙∙∙∙∙∙∙∙∙∙∙∙∙∙∙∙∙∙∙∙∙∙∙∙∙∙∙∙∙∙∙∙∙∙∙∙∙∙∙∙∙∙∙∙∙∙∙∙∙∙∙∙∙∙∙11 2.6.1. Bacterial strains and culture conditions∙∙∙∙∙∙∙∙∙∙∙∙∙∙∙∙∙∙∙∙∙∙∙∙∙∙∙∙∙∙∙∙∙∙∙∙11 2.6.2. Time killing assay∙∙∙∙∙∙∙∙∙∙∙∙∙∙∙∙∙∙∙∙∙∙∙∙∙∙∙∙∙∙∙∙∙∙∙∙∙∙∙∙∙∙∙∙∙∙∙∙∙∙∙∙∙∙∙∙∙∙∙∙∙∙∙∙∙∙∙∙∙11 2.6.3. Minimum bactericidal concentration in O/W emulsion∙∙∙∙∙∙∙∙∙∙∙∙12 2.7. Statistical analysis∙∙∙∙∙∙∙∙∙∙∙∙∙∙∙∙∙∙∙∙∙∙∙∙∙∙∙∙∙∙∙∙∙∙∙∙∙∙∙∙∙∙∙∙∙∙∙∙∙∙∙∙∙∙∙∙∙∙∙∙∙∙∙∙∙∙∙∙∙∙∙∙∙∙∙∙∙∙∙13 3. Results and discussion∙∙∙∙∙∙∙∙∙∙∙∙∙∙∙∙∙∙∙∙∙∙∙∙∙∙∙∙∙∙∙∙∙∙∙∙∙∙∙∙∙∙∙∙∙∙∙∙∙∙∙∙∙∙∙∙∙∙∙∙∙∙∙∙∙∙∙∙∙∙∙∙∙∙∙∙∙∙∙∙14 3.1. Effect of emulsification conditions on droplet size and size distribution∙∙∙∙∙∙∙∙∙∙∙∙∙∙∙∙∙∙∙∙∙∙∙∙∙∙∙∙∙∙∙∙∙∙∙∙∙∙∙∙∙∙∙∙∙∙∙∙∙∙∙∙∙∙∙∙∙∙∙∙∙∙∙∙∙∙∙∙∙∙∙∙∙∙∙∙∙∙∙∙∙∙∙∙∙∙∙∙14 3.1.1. Emulsifier concentration∙∙∙∙∙∙∙∙∙∙∙∙∙∙∙∙∙∙∙∙∙∙∙∙∙∙∙∙∙∙∙∙∙∙∙∙∙∙∙∙∙∙∙∙∙∙∙∙∙∙∙∙∙∙∙∙∙∙14 3.1.2. Sonication power and time∙∙∙∙∙∙∙∙∙∙∙∙∙∙∙∙∙∙∙∙∙∙∙∙∙∙∙∙∙∙∙∙∙∙∙∙∙∙∙∙∙∙∙∙∙∙∙∙∙∙∙∙∙∙∙17 3.2. Measurement of droplet size and stability of emulsion∙∙∙∙∙∙∙∙∙∙∙∙∙∙∙∙∙∙∙∙∙∙∙∙20 3.3. Comparison of antioxidative activity of erythorbyl laurate depending on type of emulsifier and droplet size in O/W emulsion∙∙∙∙∙∙∙∙∙∙∙∙∙∙∙∙∙∙∙∙∙∙∙∙∙∙∙24 3.3.1. Lipid oxidation rate depending on erythorbyl laurate concentration∙∙∙∙∙∙∙∙∙∙∙∙∙∙∙∙∙∙∙∙∙∙∙∙∙∙∙∙∙∙∙∙∙∙∙∙∙∙∙∙∙∙∙∙∙∙∙∙∙∙∙∙∙∙∙∙∙∙∙∙∙∙∙∙∙∙∙∙∙∙∙∙∙∙24 3.3.2. Types of emulsifiers∙∙∙∙∙∙∙∙∙∙∙∙∙∙∙∙∙∙∙∙∙∙∙∙∙∙∙∙∙∙∙∙∙∙∙∙∙∙∙∙∙∙∙∙∙∙∙∙∙∙∙∙∙∙∙∙∙∙∙∙∙∙∙∙∙∙26 3.3.3. Droplet sizes∙∙∙∙∙∙∙∙∙∙∙∙∙∙∙∙∙∙∙∙∙∙∙∙∙∙∙∙∙∙∙∙∙∙∙∙∙∙∙∙∙∙∙∙∙∙∙∙∙∙∙∙∙∙∙∙∙∙∙∙∙∙∙∙∙∙∙∙∙∙∙∙∙∙∙∙∙29 3.4. Comparison of antibacterial activities of erythorbyl laurate depending on type of emulsifier and droplet size in O/W emulsion∙∙∙∙∙∙∙∙∙∙∙∙∙∙∙∙∙∙∙∙∙∙32
VI
3.4.1. Determination of antibacterial activity with erythorbyl laurate32 3.4.2. Types of emulsifiers∙∙∙∙∙∙∙∙∙∙∙∙∙∙∙∙∙∙∙∙∙∙∙∙∙∙∙∙∙∙∙∙∙∙∙∙∙∙∙∙∙∙∙∙∙∙∙∙∙∙∙∙∙∙∙∙∙∙∙∙∙∙∙∙∙∙38 3.4.3. Droplet sizes∙∙∙∙∙∙∙∙∙∙∙∙∙∙∙∙∙∙∙∙∙∙∙∙∙∙∙∙∙∙∙∙∙∙∙∙∙∙∙∙∙∙∙∙∙∙∙∙∙∙∙∙∙∙∙∙∙∙∙∙∙∙∙∙∙∙∙∙∙∙∙∙∙∙∙∙∙43 4. Conclusions∙∙∙∙∙∙∙∙∙∙∙∙∙∙∙∙∙∙∙∙∙∙∙∙∙∙∙∙∙∙∙∙∙∙∙∙∙∙∙∙∙∙∙∙∙∙∙∙∙∙∙∙∙∙∙∙∙∙∙∙∙∙∙∙∙∙∙∙∙∙∙∙∙∙∙∙∙∙∙∙∙∙∙∙∙∙∙∙∙∙∙∙∙∙∙∙46 5. References∙∙∙∙∙∙∙∙∙∙∙∙∙∙∙∙∙∙∙∙∙∙∙∙∙∙∙∙∙∙∙∙∙∙∙∙∙∙∙∙∙∙∙∙∙∙∙∙∙∙∙∙∙∙∙∙∙∙∙∙∙∙∙∙∙∙∙∙∙∙∙∙∙∙∙∙∙∙∙∙∙∙∙∙∙∙∙∙∙∙∙∙∙∙∙∙∙∙47 국문초록∙∙∙∙∙∙∙∙∙∙∙∙∙∙∙∙∙∙∙∙∙∙∙∙∙∙∙∙∙∙∙∙∙∙∙∙∙∙∙∙∙∙∙∙∙∙∙∙∙∙∙∙∙∙∙∙∙∙∙∙∙∙∙∙∙∙∙∙∙∙∙∙∙∙∙∙∙∙∙∙∙∙∙∙∙∙∙∙∙∙∙∙∙∙∙∙∙∙∙∙∙∙∙53
VII
List of tables
Table 1. The droplet size and PdI of the emulsions used in the antioxidative and antibacterial experiments
Table 2. Minimum bactericidal concentrations of O/W emulsions with different emulsifiers after treatment for 12 h
Table 3. Minimum bactericidal concentrations of O/W emulsions with different droplet sizes after treatment for 3, 6, 9, and 12 h
VIII
List of figures
Fig. 1. Schematic representation for the lipase-catalyzed synthesis of erythorbyl laurate.
Fig. 2. (a) Effect of emulsifier concentration on the droplet size and PdI of emulsions prepared by an ultrasonication. (b) Visual appearance of emulsions prepared with 1% (w/w) (left) and 10% (w/w) (right) emulsifier. Ultrasonication condition: power; 210 W, and treatment time; 10 min.
Fig. 3. Effect of (a) sonication power and (b) sonication time on the droplet size of emulsions prepared with 2% (w/w) emulsifier.
Fig. 4. Droplet size changes of emulsions with (a) different emulsifiers and (b) droplet sizes in the antioxidative experimental conditions (for 12 days at 60oC).
Fig. 5. Droplet size changes of emulsions with (a) different emulsifiers and (b) droplet sizes in the antibacterial experimental conditions (for 12 h at 37oC).
IX
Fig. 6. Formation of lipid peroxides in Tween 20-stabilized emulsions with different concentrations of erythorbyl laurate during thermally accelerated oxidation at 60oC in the dark.
Fig. 7. Effect of type of emulsifier on the production of lipid peroxides over time in Tween 20-, Tween 40-, Tween 60-, and Tween 80-stabilized emulsions (a) without and (b) with 0.05% (w/w) erythorbyl laurate during thermally accelerated oxidation at 60oC in the dark.
Fig. 8. Effect of droplet size on the production of lipid peroxides over time in Tween 20-stabilized emulsions (a) without and (b) with 0.05% (w/w) erythorbyl laurate during thermally accelerated oxidation at 60oC in the dark.
Fig. 9. Time-killing curves of Tween 20-stabilized emulsion with 0.05% (w/w) erythorbyl laurate against (
●
) Escherichia coli and (△) Staphylococcusaureus.
Fig. 10. Time-killing curves of Tween 20-stabilized emulsions with (
●
) 0.2% (w/w) erythorbyl laurate, (△) 0.2% (w/w) lauric acid, and (□
) 0.5% (w/w)X
lauric acid against Escherichia coli.
Fig. 11. Time-killing curves of Tween 20-stabilized emulsions with different concentrations of erythorbyl laurate against Escherichia coli (
●
, 0.00; ◇, 0.05;■
, 0.10; △, 0.15; ▼, 0.20% (w/w)).Fig. 12. Time-killing curves of (
●
) Tween 20-, (▲) Tween 40-, (■
) Tween 60-, and (▼) Tween 80-stabilized emulsions with (a) 0.05, (b) 0.10, and (c) 0.15% (w/w) erythorbyl laurate against Escherichia coli.Fig. 13. Bactericidal activities of (a) Tween 20-, (b) Tween 40-, (c) Tween 60-, and (d) Tween 80-stabilized emulsions with different concentrations of erythorbyl laurate against Escherichia coli.
Fig. 14. Time-killing curves of Tween 20-stabilized emulsions with 0.05% erythorbyl laurate containing droplet sizes of (
●
) 242.70, (◆) 386.17, and (▼) 657.93 nm against Escherichia coli.1
1. Introduction
An emulsion consists of two or more immiscible liquids such as oil and water with one of the liquids finely dispersed into the other liquid in the form of droplets (Mosca, Cuomo, Lopez, & Ceglie, 2013; Nakabayashi, Amemiya, Fuchigami, Machida, Takeda, Tamamitsu, et al., 2011). Emulsions are widely used in the food industry (e.g., milk, cream, beverage, dressing, and mayonnaise) as well as in cosmetic and pharmaceutic industries (Bai & McClements, 2016; McClements, Decker, & Weiss, 2007; Zhang, Zhang, Fang, & Liu, 2017). Lipid oxidation and microbial contamination are critical problems of emulsion-based food during processing, storage, and consumption (McClements D & Decker E, 2000). Lipid oxidation leads to formation of undesirable off-flavors and potentially toxic products. Furthermore, foodborne pathogens in food can cause spoilage and food poisoning (Chen, Li, Zhao, Selomulya, Zhu, & Xiong, 2016; Erdmann, Zeeb, Salminen, Gibis, Lautenschlaeger, & Weiss, 2015; Luther, Parry, Moore, Meng, Zhang, Cheng, et al., 2007). Lipid oxidation and microbial contamination consequently decrease food quality, stability, and safety.
2
simultaneously, erythorbyl laurate was produced by lipase-catalyzed esterification between hydrophilic erythorbic acid with antioxidative activity and hydrophobic lauric acid with antibacterial activity (K. M. Park, Lee, Sung, Lee, & Chang, 2011). By measuring the surface tension and foaming ability, it was shown that EL had emulsifying property. It was also revealed that EL had a free radical scavenging activity against DPPH and ABTS radicals. In the case of antibacterial activity, EL selectively inhibited gram-positive bacteria in aqueous phase. Disintegration of the cell wall and cell membrane might be a major antibacterial mechanism of EL. Consequently, EL having antioxidative and antibacterial activities was expected to be a multi-functional emulsifier (K. M. Park, Lee, Jo, Choi, Lee, & Chang, 2017).
Antioxidative activity of EL in O/W emulsion was enhanced because EL was located in the interface where lipid oxidation occurred. Moreover, EL showed no inhibitory effect in aqueous system, but showed the inhibitory effect in emulsion against gram-negative bacteria. Therefore, antioxidative and antibacterial activities of EL were expected to be related with emulsifying properties. It was reported that emulsifying properties such as type of emulsifier and droplet size had effect on antioxidative and antibacterial activities of
3
functional substances (Erdmann, Zeeb, Salminen, Gibis, Lautenschlaeger, & Weiss, 2015; Kargar, Spyropoulos, & Norton, 2011; Osborn & Akoh, 2004).
In this study, effect of emulsifying properties (type of emulsifier and droplet size) on the antioxidative and antibacterial activities of EL was investigated.
4
2. Materials and methods
2.1. MaterialsHydrogen peroxide, casein sodium salt from bovine milk, barium chloride, iron (II) sulfate, and isooctane were purchased from Sigma-Aldrich Co. (St. Louis, MO, USA). Lauric acid (≥99.0%), 2-propanol, hydrochloride, methanol, and 1-butanol were purchased from Deajung Chemicals & Metals Co., LTD (Siheung, Gyonggi-do, Korea). Immobilized lipase, from Candida antarctica (triacylglycerol hydrolase, EC 3.1.1.3; Novozym® 435) was obtained from
Novozymes (Bagsvaerd, Denmark) with a catalytic activity of 7,000 PLU/g (activity of PLU refers to the millimoles of propyl laurate synthesized per min at 60oC). Erythorbic acid (≥98.0%) and ammonium thiocyanate were purchased
from Fisher Scientific (Seoul, Korea) and Junsei (Tokyo, Japan), respectively. Soybean oil was purchased from Ottogi (Seoul, Korea) and used without further purification. All emulsifiers were kindly provided by Ilshinwells Co. (Cheongju, Korea). All other chemicals were of analytical grade.
5 2.2. Production of erythorbyl laurate
EL was produced by lipase-catalyzed solvent-free esterification employing gaseous phase to avoid using acetonitrile, toxic organic solvent causing vomiting and convulsion, and enhance production yield. Nitrogen gas was pumped into the reactor by nitrogen gas generator to mix the substrates (erythorbic acid and lauric acid) and the enzyme. The esterification between erythorbic acid and lauric acid was carried out by the catalysis of immobilized lipase (Novozym® 435) for
72 h (Fig. 1). Total volume was 450 mL and the molar ratio of erythorbic acid and lauric acid was 1:5. The amounts of erythorbic acid and lauric acid were 0.39 mol (68.69 g) and 1.93 mol (387.02 g), respectively. The amount of enzyme was 840 PLU/mL (0.12 g solid/mL). Concentration of EL was determined by using standard curve of EL, provided from peak area at 265 nm according to previous study (K. M. Park, Lee, Sung, Lee, & Chang, 2011).
6
Fig. 1. Schematic representation for the lipase-catalyzed synthesis of erythorbyl laurate.
7 2.3. Preparation of O/W emulsion
2.3.1. Composition and manufacturing process of O/W emulsion
O/W emulsion (5%, w/w) was composed of soybean oil, which had no antioxidative and antibacterial activities, emulsifiers (Tween series and EL), and distilled water. Polyoxyethylene sorbitan monolaurate (Tween 20), polyoxyethylene sorbitan monopalmitate (Tween 40), polyoxyethylene sorbitan monostearate (Tween 60), and polyoxyethylene sorbitan monooleate (Tween 80), having the same head group, were used to study effects of hydrophobic tail-group of the emulsifiers on the antioxidative and antibacterial activities.
O/W emulsions were prepared by ultrasonic emulsification, which was a widely used method. The emulsion prepared by this method was less polydispersed and more stable as compared with that prepared by other mechanical devices (Ghosh, Mukherjee, & Chandrasekaran, 2013; Li & Chiang, 2012).
Soybean oil, emulsifiers, and distilled water were mixed thoroughly in a screw-cap vial, and then vortex-mixed together using a vortex mixer (WiseMix VM-10, Daihan, Korea) for 2 min to form a coarse emulsion. The coarse emulsion was then sonicated with a 20 KHz ultrasonicator (ULH-700S, Jeiotech,
8
Korea), in which each cycle consisted of 1 s pulse on and 4 s pulses off at 4°C.
2.3.2. Factors affecting droplet size and optimum conditions of emulsification
Preliminary experiments were carried out to study the effect of emulsifier concentration, sonication power, and sonication time on the droplet size distribution. The overall compositions of the samples were 5% (w/w) soybean oil, 1 to 10% (w/w) emulsifier, and 85 to 94% (w/w) distilled water. The mass ratio of EL and Tween 20 was 1 to 39. Sonication process was carried out for different power (70, 140, 210, 280, and 350 W) and sonication time (0.5 to 20.0 min).
2.3.3. O/W emulsion preparation with different emulsifying properties
To study the effect of type of emulsifier and droplet size on antioxidative and antibacterial activities of EL in O/W emulsion (5%, w/w), the emulsions were formulated by varying emulsifiers (Tween 20, 40, 60, and 80 with EL) and sonication time (0.5 to 5.0 min). Concentration of 5% (w/w) soybean oil, 2% (w/w) emulsifier, and 93% (w/w) distilled water and 210 W sonication power
9
were fixed for all emulsion formulations. In addition, when the emulsions with different droplet sizes were prepared, Tween 20 and EL were used as two kinds of emulsifiers.
2.4. Measurement of droplet size
The droplet size and size distribution of emulsion were determined by dynamic light scattering using a Zetasizer Nano ZS90 (Malvern Instruments Ltd, Worcestershire, UK). Samples were diluted with distilled water to a suitable concentration to reduce multiple scattering effects. And the sample volume of 0.5-1.0 mL was applied into disposable plastic cuvette. All measurements were carried out at 25oC and a fixed angle of 90°. The droplet size and size distribution
of the emulsions were described by Z-average size (mean diameter) and polydispersity index (PdI).
Stability of the emulsion was analyzed by measuring the change of the droplet size by storing at 37oC and 60oC.
10
2.5. Comparative evaluation of antioxidative activity of erythorbyl laurate in O/W emulsion
To study the effect on thermal oxidation, the emulsions (5.0 mL) were stored in screw-cap vial and allowed to be oxidized in a shaking incubator (IST-3057R, Jeio Tech, Korea) with a shaking speed of 200 rpm at 60oC. The ferric
thiocyanate method was used for the determination of primary oxidation products (Shantha & Decker, 1994). Lipid peroxide was measured by mixing 0.3 mL of emulsion with 1.5 mL of isooctane/2-propanol (3:2, v/v), vortexing three times for 10 s, and centrifuging at 1,000xg for 2 min. Clear upper solvent layer (0.2 mL) was collected and mixed with 2.8 mL of methanol/1-butanol (2:1, v/v) and 30.0 μL of thiocyanate/Fe2+ solution and then vortex-mixed. The
thiocyanate/Fe2+ solution was prepared by mixing one part 3.940 M thiocyanate
solution with one part 0.072 M Fe2+ solution (obtained from the supernatant of a
mixture of one part 0.144 M FeSO4 and one part 0.132 M BaCl2 in 0.400 M HCl).
After 20 min, the absorbance of the solution was measured at 510 nm using a UV–vis spectrophotometer (OPTIZEN POP BIO, Mecasys, Korea). Concentration of lipid peroxide was calculated by using a standard curve obtained from hydrogen peroxides.
11
2.6. Comparative evaluation of antibacterial activity of erythorbyl laurate in O/W emulsion
2.6.1. Bacterial strains and culture conditions
The negative strain was Escherichia coli ATCC 35150 and gram-positive strain was Staphylococcus aureus ATCC 12692. The stock culture was stored in tryptic soy broth (TSB) supplemented with 50% glycerol at -80oC. One
loop of each bacterium was subsequently streaked on tryptic soy agar (TSA) and incubated at 37oC for 24 h. After that, a single colony was transferred to 4 mL of
TSB and incubated at 37oC for 12 to 18 h.
2.6.2. Time-killing assay
Overnight culture of E. coli or S. aureus was centrifuged for 10 min at 4,000xg at 4oC. The supernatant was discarded and the cells were washed twice
with 0.1 M phosphate buffer (pH 7.4, PBS), and resuspended in the same buffer. The suspension was adjusted to achieve a bacterial concentration of 1.0×10⁸
colony-forming units (CFU)/mL based on 0.5 McFarland standard for bactericidal testing. After that, 200 μL inoculum was added to 1,800 μL of the emulsion with or without EL. After inoculation, all the samples were incubated
12
at 37oC under shaking condition (220 rpm). After 0, 3, 6, and 9 h of incubation,
aliquot (100 µL) was taken out and serially diluted. The diluted samples were inoculated on TSA plate and incubated at 37oC for 24 h. The number of survivors
(CFU/mL) was determined by counting colonies and time-killing curves were constructed by plotting the log CFU/mL versus time. The detection limit in the assay was 1.0 log CFU/mL.
2.6.3. Minimum bactericidal concentration in O/W emulsion
Minimum bactericidal concentration (MBC) in 5% (w/w) O/W emulsion is defined as the concentration of EL where 6 log reduction of the initial inocula occurs in this study. The emulsion with EL was serially diluted with emulsion without EL in a 96-well plate, and each well, containing of 180 µL of diluted emulsion, was inoculated with 20 µL inoculum with an absorbance of 0.13 at 600 nm. The cell density in the wells was 1.0×10⁷ CFU/mL. After incubation at
37oC for 12 h, one loop of each sample was streaked onto TSA plates and
incubated at 37oC for 24 h. The highest dilution that resulted in 99.9% reduction
in the bacterial cell number was recorded as the minimum concentration of an EL required to kill a bacteria.
13 2.7. Statistical analysis
All experiments were carried out in triplicate. The data obtained were analyzed by analysis of variance (ANOVA) using SPSS version 22.0 (IBM Corp., Armonk, NY, USA). The differences between mean values were compared using Duncan’s multiple range test with a level of significance of p<0.05.
14
3. Results and discussion
3.1. Effect of emulsification conditions on droplet size and size distribution 3.1.1. Emulsifier concentration
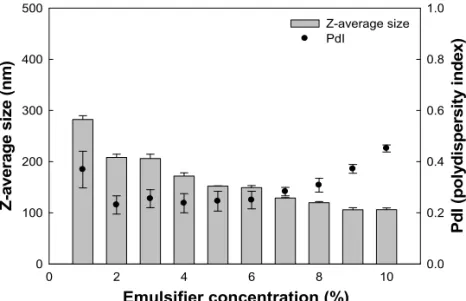
Effect of emulsifier concentration on droplet size and PdI was evaluated (Fig. 2a). The droplet size decreased as the increase of the emulsifier concentration from 1 to 10% (w/w). The surface area of droplets increased as the droplet size decreased and a larger amount of emulsifier was required to cover the increased surface area. Therefore, increase of emulsifier concentration could lead to the formation of smaller droplets. In the range of 2-7% (w/w) emulsifier concentration, the PdI of these emulsions was not significantly different, whereas the PdI increased when the emulsifier concentration was more than 8% (w/w). The results could be attributed to the partially formation of smaller droplets in the emulsion as the emulsifier concentration increased.
Since the PdI of the emulsions prepared with 2 to 6% (w/w) emulsifier was not significantly different, 2% (w/w) of the emulsifier concentration which is generally used to produce O/W emulsion in the food industry was determined as the optimum emulsifier concentration and applied to the subsequent experiments.
15
concentration was figured out (Fig. 2b). The emulsion prepared with 1% (w/w) emulsifier (left) was turbid, but the emulsion prepared with 10% (w/w) emulsifier (right) appeared relatively transparent. When droplet size becomes smaller than the wavelength of light, light scattering is weak, therefore, emulsions tend to be transparent (McClements & Rao, 2011; Rao & McClements, 2011; Salvia-Trujillo, Soliva-Fortuny, Rojas-Grau, McClements, & Martin-Belloso, 2017).
16 (a) Emulsifier concentration (%) 0 2 4 6 8 10 Z -av er age si ze ( nm ) 0 100 200 300 400 500 P d I (p o ly d is p er si ty in d ex ) 0.0 0.2 0.4 0.6 0.8 1.0 Z-average size PdI (b)
Fig. 2. (a) Effect of emulsifier concentration on the droplet size and PdI of emulsions prepared by an ultrasonication. (b) Visual appearance of emulsions prepared with 1% (w/w) (left) and 10% (w/w) (right) emulsifier. Ultrasonication condition: power; 210 W, and treatment time; 10 min.
17 3.1.2. Sonication power and time
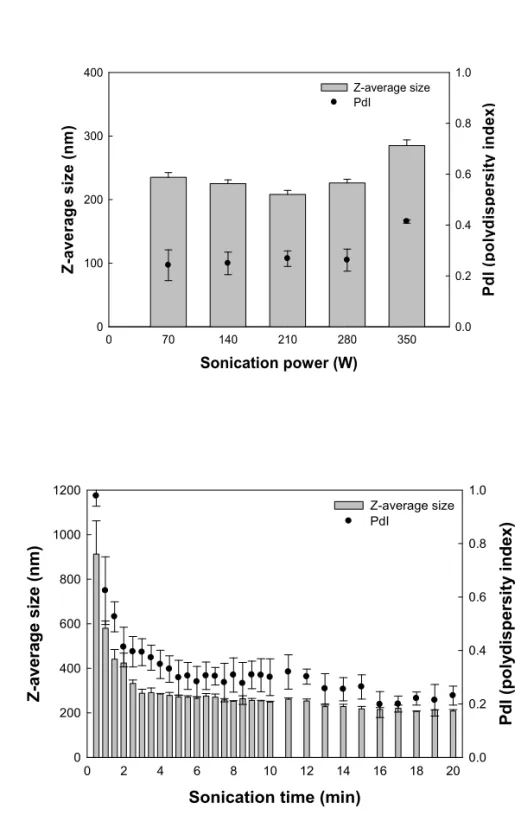
Effect of sonication power on droplet size and PdI was evaluated (Fig. 3a). The droplet size decreased as the increase of the sonication power from 70 to 210 W, and PdI was not significantly different. However, as the sonication power increased from 210 W or more, the droplet size and PdI increased. This phenomenon of the droplet size increase with increasing the energy power can be referred to ‘over-processing’. This means that when excessive energy is applied to the emulsion, the droplet size increases due to coalescence of the droplet and the uniformity of the droplet is lowered (Anne & Julie, 2002; Jafari, He, & Bhandari, 2006; Kentish, Wooster, Ashokkumar, Balachandran, Mawson, & Simons, 2008). Consequently, optimum power for preparing emulsions was determined to 210 W which formed the smallest droplet.
The effect of sonication time on droplet size and PdI was evaluated (Fig. 3b). The droplet size decreased steeply as the increase of the sonication time in the range of 0.5-3.0 min and then was not significantly different thereafter. PdI decreased as the sonication time increased from 0.5 to 5.0 min, but there was no significant difference in PdI when the sonication time was more than 5.0 min.
18
19 (a) Sonication power (W) 0 70 140 210 280 350 Z -averag e si ze (n m ) 0 100 200 300 400 PdI (p ol ydi sp ersi ty in d ex ) 0.0 0.2 0.4 0.6 0.8 1.0 Z-average size PdI (b)
Sonication time (min)
0 2 4 6 8 10 12 14 16 18 20 Z -av er ag e si ze ( n m ) 0 200 400 600 800 1000 1200 P d I (poly d ispe rs ity index ) 0.0 0.2 0.4 0.6 0.8 1.0 Z-average size PdI
Fig. 3. Effect of (a) sonication power and (b) sonication time on the droplet size of emulsions prepared with 2% (w/w) emulsifier.
20
3.2. Measurement of droplet size and stability of emulsion
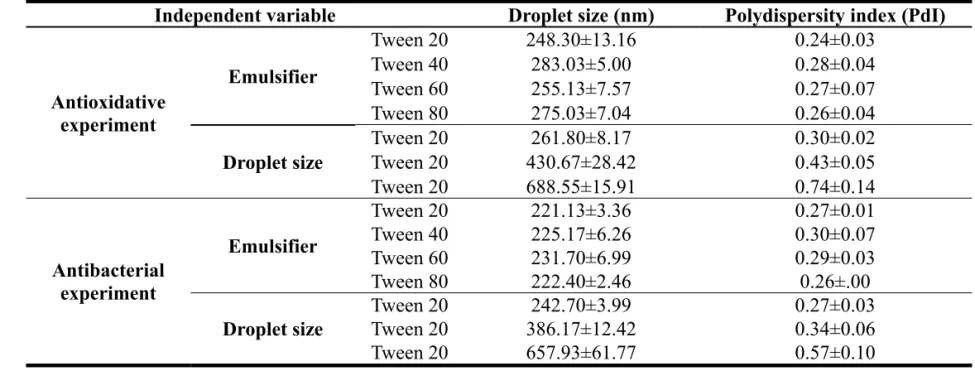
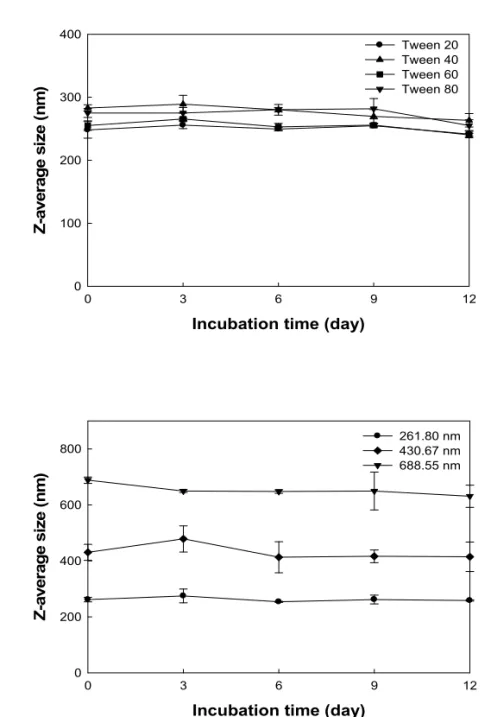
The initial droplet size and PdI of the prepared emulsions were presented in Table 1. The fluctuation of the droplet size was observed to evaluate the stability of the emulsions during incubation at 60oC for 12 days (Fig. 4) and at 37oC for
12 h (Fig. 5), which were the optimal conditions for analysis of antioxidative and antibacterial activities, respectively. Since emulsions are thermodynamically unstable, smaller droplets are adsorbed on bigger droplets over time resulting in Oswald ripening and coalescence. The droplet size of the emulsions over time was not significantly different, which indicated the emulsions were stable under the optimal conditions for the analysis of antioxidative and antibacterial activities.
21
Table 1. The droplet size and PdI of the emulsions used in the antioxidative and antibacterial experiments
Independent variable Droplet size (nm) Polydispersity index (PdI)
Antioxidative experiment Emulsifier Tween 20 248.30±13.16 0.24±0.03 Tween 40 283.03±5.00 0.28±0.04 Tween 60 255.13±7.57 0.27±0.07 Tween 80 275.03±7.04 0.26±0.04 Droplet size Tween 20 261.80±8.17 0.30±0.02 Tween 20 430.67±28.42 0.43±0.05 Tween 20 688.55±15.91 0.74±0.14 Antibacterial experiment Emulsifier Tween 20 221.13±3.36 0.27±0.01 Tween 40 225.17±6.26 0.30±0.07 Tween 60 231.70±6.99 0.29±0.03 Tween 80 222.40±2.46 0.26±.00 Droplet size Tween 20 242.70±3.99 0.27±0.03 Tween 20 386.17±12.42 0.34±0.06 Tween 20 657.93±61.77 0.57±0.10
22
(a)
Incubation time (day)
0 3 6 9 12 Z-av er ag e si ze ( nm ) 0 100 200 300 400 Tween 20 Tween 40 Tween 60 Tween 80 (b)
Fig. 4. Droplet size changes of emulsions with (a) different emulsifiers and (b) droplet sizes in the antioxidative experimental conditions (for 12 days at 60oC).
Incubation time (day)
0 3 6 9 12 Z -a ve ra g e s iz e (n m ) 0 200 400 600 800 261.80 nm430.67 nm 688.55 nm
23 (a) Incubation time (h) 0 3 6 9 12 Z-av er ag e si ze ( nm ) 0 100 200 300 400 Tween 20 Tween 40 Tween 60 Tween 80 (b) Incubation time (h) 0 2 4 6 8 10 12 Z-av er a g e si ze ( nm ) 0 200 400 600 800 242.70 nm386.17 nm 657.93 nm
Fig. 5. Droplet size changes of emulsions with (a) different emulsifiers and (b) droplet sizes in the antibacterial experimental conditions (for 12 h at 37oC).
24
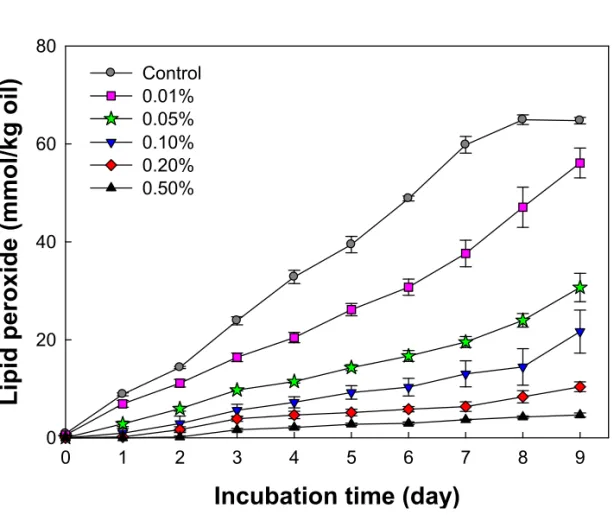
3.3. Comparison of antioxidative activities of erythorbyl laurate depending on type of emulsifier and droplet size in O/W emulsion 3.3.1. Lipid oxidation rate depending on erythorbyl laurate concentration
Lipid oxidation rates depending on the EL concentration in O/W emulsions (5%, w/w) were evaluated for determining the effective concentration of EL in the antioxidative experiment (Fig. 6). Tween 20 was used for the emulsifier and the droplet size was fixed to 265.55±29.26 nm. Concentrations of lipid peroxides in Tween 20-stabilized emulsions without EL and with 0.01, 0.05, 0.10, 0.20, and 0.50% (w/w) EL after incubation for 8 days were 64.94±0.99, 47.06±4.10, 23.98±1.38, 14.46±3.73, 8.37±1.24, and 4.22±0.23 mmol/kg oil, respectively. These results indicated that EL retarded the lipid oxidation and therefore, lipid oxidation rate decreased as the EL concentration increased. When the EL was treated at a high concentration (0.10-0.50%, w/w), the differences of lipid oxidation rate were too small to distinguish.Therefore, the concentration of EL was fixed to 0.05% (w/w) in order to compare lipid oxidation rate in the emulsions with different emulsifiers and droplet sizes.
25
Incubation time (day)
0 1 2 3 4 5 6 7 8 9
Lipid peroxide (mmol/kg oil)
0 20 40 60 80 Control 0.01% 0.05% 0.10% 0.20% 0.50%
Fig. 6. Formation of lipid peroxides in Tween 20-stabilized emulsions with different concentrations of erythorbyl laurate during thermally accelerated oxidation at 60oC in the dark.
26 3.3.2. Types of emulsifiers
Lipid oxidation rates in Tween 20-, Tween 40-, Tween 60-, and Tween 80-stabilized emulsions without EL and with 0.05% (w/w) EL were evaluated (Fig. 7). Concentrations of lipid peroxides in Tween 20-, Tween 40-, Tween 60-, and Tween 80-stabilized emulsions without EL were determined to be 39.44±5.68, 72.31±2.81, 59.71±7.33, and 42.65±2.73 mmol/kg oil, respectively, after incubation for 4 days. It was reported that lipid oxidation rate could be affected by the hydrophobic tail length of emulsifier, however, the effect of emulsifying properties on the oxidation was still controversial due to the properties such as pH, HLB, and surface charge (Berton, Genot, Guibert, & Ropers, 2012; Decker, Elias, & McClements, 2010). Concentrations of lipid peroxides in Tween 20-, Tween 40-, Tween 60-, and Tween 80-stabilized emulsions with EL were found out to be 35.95±4.05, 49.17±4.55, 51.74±9.18, and 70.79±0.59 mmol/kg oil, respectively, after incubation for 9 days.
Lipid oxidation rate in Tween 80-stabilized emulsion without EL was the slowest among the emulsions in the absence of EL. In contrast, lipid oxidation rate in the Tween 80-stabilized emulsion with EL was the fastest among the emulsions stabilized with EL. These results could be explained by packing of EL in the emulsions. In Tween 80-stabilized emulsion, the packing of EL in the interface could be hard due to the a geometric difference and steric
27
hindrance caused by the double bond kink structure in fatty acid (oleic acid, 18:1) of Tween 80 emulsifier.
Lipid oxidation rate in the Tween 20-stabilized emulsion with EL was the slowest among the emulsions stabilized with EL. In Tween 20-stabilized emulsion, the packing of EL might be dense in the interface since Tween 20 composed of the lauric acid (12:0) which was the same as EL. In contrast, the packing of EL in Tween 40 and 60-stailibzed emulsions could be less dense than that in Tween 20 since Tween 40 and 60 were composed of palmitic acid (16:0) and stearic acid (18:0), respectively. The accessibility of packing in the interface determined the quantity of EL, which affected lipid oxidation rate in the emulsions with different emulsifiers.
Consequently, lipid oxidation rate in emulsion may be slower as EL mixed with emulsion prepared with an emulsifier composed of a similar tail fatty acid to that of EL. That is, the type of emulsifier affected antioxidative activity of EL.
28
(a)
Incubation time (day)
0 1 2 3 4 5 6 7 Li pi d per o xi de (m m o l/k g o il) 0 20 40 60 80 Tween 20 Tween 40 Tween 60 Tween 80 (b)
Incubation time (day)
0 1 2 3 4 5 6 7 8 9 10 L ipi d pe ro xi de ( m m o l/k g oi l) 0 20 40 60 80 Tween 20 Tween 40 Tween 60 Tween 80
Fig. 7. Effect of type of emulsifier on the production of lipid peroxides over time in Tween 20-, Tween 40-, Tween 60-, and Tween 80-stabilized emulsions (a) without and (b) with 0.05% (w/w) erythorbyl laurate during thermally accelerated oxidation at 60oC in the dark.
29 3.3.3. Droplet sizes
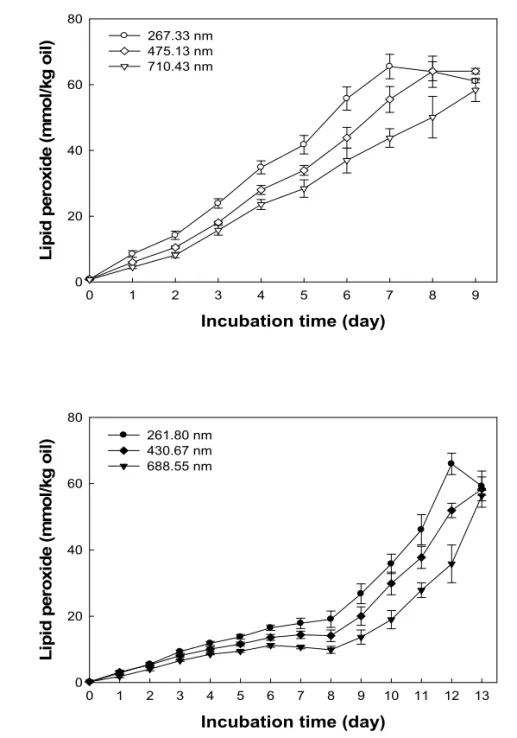
Lipid oxidation rates in Tween 20-stabilized emulsions without EL and with 0.05% (w/w) EL were evaluated in conditions of different droplet sizes (Fig. 8). After incubation for7 days, concentrations of lipid peroxides in Tween 20-stabilized emulsions without EL containing droplet sizes of 267.33, 475.13, and 710.43 nm were determined to be 65.52±3.71, 55.51±3.93, and 43.78±2.83 mmol/kg oil, respectively. In emulsions, lipid oxidation occurs in the interface where the free radical and lipid can interact. For the reason, the smaller the droplet size, the more susceptible to oxidation than the larger droplet (Azuma, Kimura, Hosokawa, & Miyashita, 2009; Jacobsen, 2010; Lethuaut, Métro, & Genot, 2002; Poyato, Navarro-Blasco, Calvo, Cavero, Astiasarán, & Ansorena, 2013).
In case of Tween 20-stabilized emulsion with EL, after incubation for 12 days, concentrations of lipid peroxides in emulsions containing droplet sizes of 261.80, 430.67, and 688.55 nm were found out to be 65.97±3.23, 51.92±2.16, and 35.79±5.71 mmol/kg oil, respectively. The result of lipid oxidation rate in Tween 20-stabilized emulsion with EL was the same as without EL and it was found out that EL effectively retarded the formation of lipid peroxides in emulsion regardless of the droplet size.
30
concentrations of lipid peroxides in emulsions without and with EL, after incubation for 7 days. Inhibition rates of lipid oxidation in emulsions containing droplet sizes of 261.80, 430.67, and 688.55 nm were determined to be 72.63±3.81, 73.95±3.47, and 75.63±1.06 %, respectively. The inhibition rates of lipid oxidation were not significantly different (p>0.05) among the emulsions containing different size droplets.
31
(a)
Incubation time (day)
0 1 2 3 4 5 6 7 8 9 L ip id per o xi de (m m o l/k g oi l) 0 20 40 60 80 267.33 nm 475.13 nm 710.43 nm (b)
Incubation time (day)
0 1 2 3 4 5 6 7 8 9 10 11 12 13 Li pi d per o xi de (m m o l/kg o il ) 0 20 40 60 80 261.80 nm 430.67 nm 688.55 nm
Fig. 8. Effect of droplet size on the production of lipid peroxides over time in Tween 20-stabilized emulsions (a) without and (b) with 0.05% (w/w) erythorbyl laurate during thermally accelerated oxidation at 60oC in the dark.
32
3.4. Comparison of antibacterial activities of erythorbyl laurate depending on type of emulsifier and droplet size in O/W emulsion 3.4.1. Determination of antibacterial activity with erythorbyl laurate
In the previous studies, EL had an antibacterial activity against gram-positive bacteria, but not against gram-negative bacteria in aqueous system. The results could be interpreted in terms of differences in the cell membrane of gram-positive and gram-negative bacteria.
In general, gram-negative bacteria are less susceptible to antibacterial agents than gram-positive bacteria due to lipopolysaccharides (LPS) which acts as a barrier against hydrophobic compounds in the outer membrane (Hamouda & Baker, 2000).
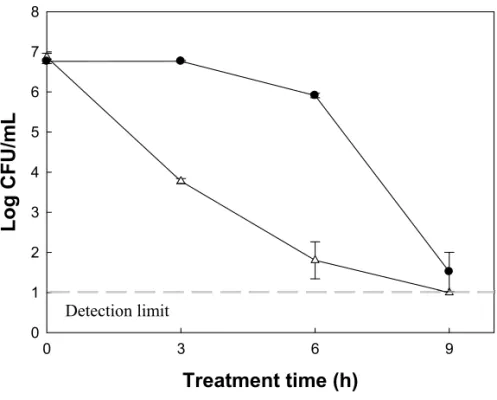
In contrast, it was evaluated in O/W emulsion (5%, w/w), EL showed antibacterial effect against both gram-positive bacteria and gram-negative bacteria (Fig. 9). It was reported that permeability of the emulsion to outer membrane increased since surface of droplet in the emulsion was hydrophilic (Gaysinsky, Taylor, Davidson, Bruce, & Weiss, 2007). Thus, the results showed that EL in the emulsion with increased permeability to outer membrane could lead to have antibacterial activity against gram-negative bacteria.
33 Treatment time (h) 0 3 6 9 Lo g CFU/m L 0 1 2 3 4 5 6 7 8
Fig. 9. Time-killing curves of Tween 20-stabilized emulsion with 0.05% (w/w) erythorbyl laurate against (●) Escherichia coli and (△) Staphylococcus aureus.
34
Since the antibacterial activity of EL was derived from lauric acid, the antibacterial activity of lauric acid and EL against E. coli was compared in O/W (5.0%, w/w) emulsion system (Fig. 10). The EL concentration was 0.2% (w/w) and lauric acid concentrations were 0.2 and 0.5% (w/w). The emulsion with 0.2% (w/w) EL reached detection limit within 6 h, and 0.2% (w/w) lauric acid had no reduction until 9 h. A higher concentration of 0.5% (w/w) lauric acid resulted in 0.66±0.19 log reduction after 9 h. These results confirmed that EL had a higher antibacterial activity than lauric acid in the emulsion system.
35 Treatment time (h) 0 3 6 9 Lo g CFU/m L 0 1 2 3 4 5 6 7 8
Fig. 10. Time-killing curves of Tween 20-stabilized emulsions with (●) 0.2% (w/w) erythorbyl laurate, (△) 0.2% (w/w) lauric acid, and (□) 0.5% (w/w) lauric acid against Escherichia coli.
36
The antibacterial activity of EL against E. coli depending on EL concentration was evaluated in the range of 0.05-0.20% (w/w) (Fig. 11). After treatment, bacteria were reduced to detection limit within 12 h. The antibacterial activity of EL in emulsion became higher as the EL concentration increased. When the EL was treated at a high concentration (0.20%, w/w), it was difficult to finely compare the antibacterial activity of EL in emulsions with different emulsifiers and droplet sizes. Therefore, antibacterial experiments were conducted at a concentration of less than 0.20% (w/w) of EL.
37 Treatment time (h) 0 3 6 9 12 Lo g C F U /m L 0 1 2 3 4 5 6 7 8
Fig. 11. Time-killing curves of Tween 20-stabilized emulsions with different concentrations of erythorbyl laurate against Escherichia coli (●, 0.00; ◇, 0.05;
■, 0.10; △, 0.15; ▼, 0.20% (w/w)). Detection limit
38 3.4.2. Types of emulsifiers
The antibacterial activity of EL in emulsions with different emulsifiers was evaluated over time, performing with 0.05, 0.10, and 0.15% (w/w) of EL (Fig. 12). The results showed that the antibacterial activity of EL became higher as EL concentration increased. In addition, the antibacterial activity was high in inverse proportion to the hydrophobic tail length of the emulsifier mixed with EL.
In order to determine the antibacterial activity quantitatively, minimum bactericidal concentrations (MBCs) of emulsions were compared (Fig. 13). The results were summarized in Table 2. MBCs in Tween 20-, Tween 40-, Tween 60-, and Tween80-stabilized emulsions with EL were 0.040±0.000, 0.057±0.006, 0.087±0.012, and 0.090±0.010%, respectively. The antibacterial activity of EL was the highest in Tween 20-stabilized emulsion with EL and the lowest in Tween 80-stabilized emulsion with EL. Consequently, when the emulsion was prepared with an emulsifier composed of lauric acid, the antibacterial effect of the EL enhanced. As aforementioned, EL could be packed more densely in the interface of emulsion with lauric acid-based emulsifier and these differences in the packing of EL could affect the antibacterial activity of EL in emulsion.
39 (a) Treatment time (h) 0 3 6 9 Log C F U /m L 0 1 2 3 4 5 6 7 8 (b) Treatment time (h) 0 3 6 9 Log C F U /m L 0 1 2 3 4 5 6 7 8 Detection limit Detection limit
40 (c) Treatment time (h) 0 3 6 9 Log C F U /m L 0 1 2 3 4 5 6 7 8
Fig. 12. Time-killing curves of (
●
) Tween 20-, (▲) Tween 40-, (■) Tween 60-, and (▼) Tween 80-stabilized emulsions with (a) 0.05, (b) 0.10, and (c) 0.15% (w/w) erythorbyl laurate against Escherichia coli.41
(a) (b)
(c) (d)
Fig. 13. Bactericidal activities of (a) Tween 20-, (b) Tween 40-, (c) Tween 60-, and (d) Tween 80-stabilized emulsions with different concentrations of erythorbyl laurate against Escherichia coli.
42
Table 2. Minimum bactericidal concentrations of O/W emulsions with different emulsifiers after treatment for 12 h
Type of emulsifier MBC (%)
Tween 20 0.040±0.000a
Tween 40 0.057±0.006b
Tween 60 0.087±0.012c
Tween 80 0.090±0.010c
1) The values with different superscripts in each column are significantly different (p<0.05) by Duncan’s multiple range test.
43 3.4.3. Droplet sizes
The antibacterial activity of 0.05% (w/w) EL in emulsions with different droplet sizes was evaluated over time (Fig. 14). After treatment for 6 h, Tween 20-stabilized emulsions with EL containing droplet sizes of 242.70, 386.17, and 657.93 nm showed 2.81±0.67, 4.10±0.34, and 5.76±0.11 log reduction of bacteria, respectively. In these results, the larger the droplet size, the higher the antibacterial activity of EL. Table 3 showed the MBCs of EL after 3, 6, 9, and 12 h treatment. Consequently, the results of antibacterial activity were not consistent depending on droplet size. Remained emulsifiers could be present in the form of small micelles on the continuous phase. Since the surface of droplets is hydrophilic like emulsion, micelles can penetrate the outer membrane. Generally, the micelle is a small size of several tens of nanometers in comparison with the emulsion so that the permeation rate is faster than the emulsion (Buranasuksombat, Kwon, Turner, & Bhandari, 2011). Due to formation of these micelles, the effects of droplet size to antibacterial activity of EL were not identified properly in this study.
44 Treatment time (h) 0 3 6 9 L o g C F U /m L 0 1 2 3 4 5 6 7 8
Fig. 14. Time-killing curves of Tween 20-stabilized emulsions with 0.05% erythorbyl laurate containing droplet sizes of (
●
) 242.70, (◆) 386.17, and (▼) 657.93 nm against Escherichia coli.45
Table 3. Minimum bactericidal concentrations of O/W emulsions with different droplet sizes after treatment for 3, 6, 9, and 12 h
Droplet size (nm) MBC (%) 3 h 6 h 9 h 12 h 242.70±3.99 >0.100a 0.058±0.008a 0.028±0.006a 0.025±0.000a 386.17±12.42 0.062±0.003b 0.035±0.000b 0.027±0.003a 0.028±0.003a 657.93±61.77 0.100±0.000c 0.048±0.003c 0.037±0.003b 0.037±0.003b
1) The values with different superscripts in each column are significantly different (p<0.05) by Duncan’s multiple range test.
46
4. Conclusions
In this study, effect of emulsifying properties on the antioxidative and antibacterial activities of EL was investigated. In the antioxidative experiment, the difference of lipid oxidation rate in emulsion occurred due to the hydrophobic tail length and double bond kink structure of the emulsifier mixed with EL. In contrast, there was no significant difference in the inhibitory effect of the lipid oxidation of EL in emulsions with different droplet sizes. In the antibacterial experiment, the difference in antibacterial activity occurred due to the hydrophobic tail length and double bond kink structure of the emulsifier mixed with EL. The antibacterial activity of EL depending on droplet size was difficult to investigate a specific tendency due to micelle formation.
Consequently, this study revealed that the antioxidative and antibacterial activities of EL in emulsion were affected by hydrophobic tail length and double bond of the emulsifiers mixed with EL. Therefore, in order to improve the functionalities of EL, when applying EL to emulsion-based food, similarity in terms of hydrophobic tail length and double bond of the emulsifier mixed with EL should be considered.
47
5. References
Anne, D., & Julie, M. (2002). Formation of sunflower oil emulsions stabilized by whey proteins with high-pressure homogenization (up to 350 MPa): effect of pressure on emulsion characteristics. International Journal of
Food Science and Technology, 37(3), 263-269.
Azuma, G., Kimura, N., Hosokawa, M., & Miyashita, K. (2009). Effect of droplet size on the oxidative stability of soybean oil TAG and fish oil TAG in oil-in-water emulsion. Journal of Oleo Science, 58(6), 329-338.
Bai, L., & McClements, D. J. (2016). Formation and stabilization of nanoemulsions using biosurfactants: rhamnolipids. Journal of Colloid
and Interface Science, 479, 71-79.
Berton, C., Genot, C., Guibert, D., & Ropers, M. H. (2012). Effect of lateral heterogeneity in mixed surfactant-stabilized interfaces on the offff of unsaturated lipids in oil-in-water emulsions. Journal of Colloid and
Interface Science, 377(1), 244-250.
Buranasuksombat, U., Kwon, Y. J., Turner, M., & Bhandari, B. (2011). Influence of emulsion droplet size on antimicrobial properties. Food
48
Chen, X. X., Li, W., Zhao, Q., Selomulya, C., Zhu, X. M., & Xiong, H. (2016). Physical and oxidative stabilities of O/W emulsions formed with rice dreg protein hydrolysate: effect of xanthan gum rheology. Food and
Bioprocess Technology, 9(8), 1380-1390.
Decker, E. A., Elias, R. J., & McClements, D. J. (2010). Oxidation in foods
and beverages and antioxidant applications. Volume 2: management in different industry sectors. Cambridge: Woodhead Publishing.
Erdmann, M. E., Zeeb, B., Salminen, H., Gibis, M., Lautenschlaeger, R., & Weiss, J. (2015). Influence of droplet size on the antioxidant activity of rosemary extract loaded oil-in-water emulsions in mixed systems.
Journal of Functional Foods, 6(3), 793-804.
Gaysinsky, S., Taylor, T. M., Davidson, P. M., Bruce, B. D., & Weiss, J. (2007). Antimicrobial efficacy of eugenol microemulsions in milk against
Listeria monocytogenes and Escherichia coli O157:H7. Journal of Food Protection, 70(11), 2631-2637.
Ghosh, V., Mukherjee, A., & Chandrasekaran, N. (2013). Ultrasonic emulsification of food-grade nanoemulsion formulation and evaluation of its bactericidal activity. Ultrasonics Sonochemistry,
20(1), 338-344.
49
of surfactant lipid preparations in enteric Gram‐negative bacilli.
Journal of Applied Microbiology, 89(3), 397-403.
Jacobsen, C. (2010). Challenges when developing omega-3 enriched foods.
Oilseeds and Fats, Crops and Lipids, 17(4), 251-258.
Jafari, S. M., He, Y., & Bhandari, B. (2006). Optimization of nano-emulsions production by microfluidization. European Food Research and
Technology, 225(5-6), 733-741.
Kargar, M., Spyropoulos, F., & Norton, I. T. (2011). The effect of interfacial microstructure on the lipid oxidation stability of oil-in-water emulsions.
Journal of Colloid and Interface Science, 357(2), 527-533.
Kentish, S., Wooster, T. J., Ashokkumar, M., Balachandran, S., Mawson, R., & Simons, L. (2008). The use of ultrasonics for nanoemulsion preparation. Innovative Food Science and Emerging Technologies,
9(2), 170-175.
Lethuaut, L., Métro, F., & Genot, C. (2002). Effect of droplet size on lipid oxidation rates of oil-in-water emulsions stabilized by protein. Journal
of the American Oil Chemists' Society, 79(5), 425.
Li, P. H., & Chiang, B. H. (2012). Process optimization and stability of D-limonene-in-water nanoemulsions prepared by ultrasonic emulsification using response surface methodology. Ultrasonics
50
Sonochemistry, 19(1), 192-197.
Luther, M., Parry, J., Moore, J., Meng, J. H., Zhang, Y. F., Cheng, Z. H., & Yu, L. L. (2007). Inhibitory effect of Chardonnay and black raspberry seed extracts on lipid oxidation in fish oil and their radical scavenging and antimicrobial properties. Food Chemistry, 104(3), 1065-1073.
McClements D, J., & Decker E, A. (2000). Lipid oxidation in oil-in-water emulsions: impact of molecular environment on chemical reactions in heterogeneous food systems. Journal of Food Science, 65(8), 1270-1282.
McClements, D. J., Decker, E. A., & Weiss, J. (2007). Emulsion-based delivery systems for lipophilic bioactive components. Journal of Food
Science, 72(8), 109-124.
McClements, D. J., & Rao, J. (2011). Food-grade nanoemulsions: formulation, fabrication, properties, performance, biological fate, and potential toxicity. Critical Reviews in Food Science and Nutrition, 51(4), 285-330.
Mosca, M., Cuomo, F., Lopez, F., & Ceglie, A. (2013). Role of emulsifier layer, antioxidants and radical initiators in the oxidation of olive oil-in-water emulsions. Food Research International, 50(1), 377-383.
51
Tamamitsu, K., & Atobe, M. (2011). Highly clear and transparent nanoemulsion preparation under surfactant-free conditions using tandem acoustic emulsification. Chemical Communications, 47(20), 5765-5767.
Osborn, H. T., & Akoh, C. C. (2004). Effect of emulsifier type, droplet size, and oil concentration on lipid oxidation in structured lipid-based oil-in-water emulsions. Food Chemistry, 84(3), 451-456.
Park, K. M., Lee, D. E., Sung, H., Lee, J., & Chang, P.-S. (2011). Lipase-catalysed synthesis of erythorbyl laurate in acetonitrile. Food
Chemistry, 129(1), 59-63.
Park, K. M., Lee, M. J., Jo, S. K., Choi, S. J., Lee, J., & Chang, P. S. (2017). Erythorbyl laurate as a potential food additive with multi-functionalities: interfacial characteristics and antioxidant activity.
Food Chemistry, 215, 101-107.
Poyato, C., Navarro-Blasco, I., Calvo, M. I., Cavero, R. Y., Astiasarán, I., & Ansorena, D. (2013). Oxidative stability of O/W and W/O/W emulsions: effect of lipid composition and antioxidant polarity. Food
Research International, 51(1), 132-140.
Rao, J., & McClements, D. J. (2011). Formation of flavor oil microemulsions, nanoemulsions and emulsions: influence of composition and
52
preparation method. Journal of Agricultural and Food Chemistry,
59(9), 5026-5035.
Salvia-Trujillo, L., Soliva-Fortuny, R., Rojas-Grau, M. A., McClements, D. J., & Martin-Belloso, O. (2017). Edible nanoemulsions as carriers of active ingredients: a review. Annual Review of Food Science and
Technology, 8, 439-466.
Shantha, N. C., & Decker, E. A. (1994). Rapid, sensitive, iron-based spectrophotometric methods for determination of peroxide values of food lipids. Journal of AOAC International, 77(2), 421-424.
Zhang, S., Zhang, M., Fang, Z., & Liu, Y. (2017). Preparation and characterization of blended cloves/cinnamon essential oil nanoemulsions. LWT - Food Science and Technology, 75, 316-322.
53
국문초록
Erythorbyl laurate(EL)는 항산화력과 항균력을 가지는 다기능 성 유화제로서 유화 기반 식품에서의 지방산화와 미생물 오염을 동시에 제어할 수 있다. 선행연구결과, 유화계에서 EL은 지방산화 가 발생하는 입자 계면에 존재하기 때문에, 수중유적형 유화액에서 EL의 항산화력이 증진됨을 확인하였다. 또한, EL은 수상계에서는 그람 음성균에 저해효과가 없었지만 수중유적형 유화계에서는 저 해효과가 나타남을 확인하였다. 따라서, EL의 항산화력과 항균력이 유화 특성에 영향을 받을 것으로 예상하였다. 유화액은 다양한 유화제 종류 및 액적의 크기를 조건으로 하 여 제조하였다. Tween계열의 유화제를 사용하였고 다른 크기의 액 적을 제조하기 위하여 sonication 시간을 조정하였다. 이를 통해 제조된 다양한 조건의 유화액을 통해 EL의 항산화력과 항균력을 비교 평가하였다. 60oC에서 9일동안 열 산화를 유도한 후 지방 과산화물을 측정 한 결과, Tween 20, 40, 60, 80 유화액은 각각 35.95, 49.17, 51.74,54
70.79 mmol/kg oil의 과산화물을 생성하였다. Tween 20은 EL과 같이 lauric acid를 지방산꼬리로 가지고 있기 때문에 Tween 20 유화액의 계면에 EL이 구조적으로 조밀하게 위치할 수 있게 되어 효과적으로 작용할 수 있었다. 이와는 대조적으로 Tween 80은 지 방산 꼬리에 이중결합을 가지고 있기 때문에 Tween 80 유화액에 서 EL은 조밀하게 위치할 수 없었다. Tween 80의 이중결합구조가 계면에 EL이 packing되는 것을 방해하였고 그 결과 Tween 80 유 화액에서 EL은 상대적으로 낮은 항산화력을 나타내었다. Tween 40과 Tween 60 유화액에서 EL의 항산화력은 서로 간에 유의적인 차이를 나타내지 않았다. 261.80, 430.67, 688.55 nm의 입자크기를 지닌 Tween 20 유화액은 각각 65.97, 51.92, 35.79 mmol/kg oil의 지방 과산화물을 생성하였다. 액적의 크기가 작아짐에 따라 유화액 의 계면적이 넓어지고 결과적으로 산화가 빠르게 일어났으며, 입자 크기별 EL의 지방산화 지연효과에 유의적 차이가 없었다. 즉, 유화 액에서 EL의 항산화력은 액적 크기에 의해 영향을 받지 않았다.
Tween 20, 40, 60, 80 유화액의 최소살균농도는 각각 0.040, 0.057, 0.087, and 0.090%로 나타났다. Tween 20과 Tween 80 유
55 화액에서의 EL이 각각 최고, 최저의 항균효과를 보였으며 이는 계 면에 존재하는 EL의 양 차이로 설명될 수 있다. 액적 크기가 유화 액에서 EL의 항균력에 미치는 영향은 micelle의 형성으로 인하여 확인할 수 없었다. 결론적으로 수중유적형 유화액 내에서 EL의 항산화, 항균력이 혼합되는 유화제에 의해 영향을 받을 수 있음을 밝혔으며, EL과 구 조적으로 유사한 Tween 20으로 혼합한 유화액에서 가장 높은 항 산화력과 항균력이 나타남을 확인하였다. 따라서, EL의 항산화 및 항균효과를 증대시키기 위해서는 EL과 유사한 구조를 가진 유화제 와 혼합해야 한다는 것을 밝혔다. 주요어: 에리소르빌 라우레이트, 항산화력, 항균력, 유화제, 입자크기, 수중유적형 유화액 학번: 2016-21748