저작자표시 2.0 대한민국 이용자는 아래의 조건을 따르는 경우에 한하여 자유롭게 l 이 저작물을 복제, 배포, 전송, 전시, 공연 및 방송할 수 있습니다. l 이차적 저작물을 작성할 수 있습니다. l 이 저작물을 영리 목적으로 이용할 수 있습니다. 다음과 같은 조건을 따라야 합니다: l 귀하는, 이 저작물의 재이용이나 배포의 경우, 이 저작물에 적용된 이용허락조건 을 명확하게 나타내어야 합니다. l 저작권자로부터 별도의 허가를 받으면 이러한 조건들은 적용되지 않습니다. 저작권법에 따른 이용자의 권리는 위의 내용에 의하여 영향을 받지 않습니다. 이것은 이용허락규약(Legal Code)을 이해하기 쉽게 요약한 것입니다. Disclaimer 저작자표시. 귀하는 원저작자를 표시하여야 합니다.
Prognostic significance of sarcopenia in
advanced biliary tract cancer patients
Lee byung min
Department of Medicine
The Graduate School, Yonsei University
[UCI]I804:11046-000000522578
[UCI]I804:11046-000000522578
Prognostic significance of sarcopenia in
advanced biliary tract cancer patients
Directed by Professor Ik Jae Lee
The Master's Thesis
submitted to the Department of Medicine
the Graduate School of Yonsei University
in partial fulfillment of the requirements for the degree
of Master of Medicine
Lee byung min
This certifies that the Master's Thesis of
Byung min Lee is approved.
---
Thesis Supervisor : Ik Jae Lee
---
Thesis Committee Member#1 : Hei-Cheul Jeung
---
Thesis Committee Member#2 : Joon Seong Park
The Graduate School
Yonsei University
ACKNOWLEDGEMENTS
Firstly, I would like to appreciate Professor Ik Jae Lee
to provide me for inspiring advice and support for
preparing this thesis and setting a good example by
devoting himself to patients to patients suffering from
advanced biliary tract cancer. Also, I would like to
express my gratitude to professor Hei-Chul Jeung and
Joon Seong Park for giving me advices to complete this
article. I once again thank everyone for their help in my
research
<TABLE OF CONTENTS>
ABSTRACT ··· 1
I. INTRODUCTION ··· 3
II. MATERIALS AND METHODS ··· 4
1. Patient population ··· 4
2. Measurement of body composition and definition of sarcopenia · 4
3. Indicator of inflammatory status ··· 6
4. Statistical analysis ··· 6
III. RESULTS ··· 6
1. Patient characteristics ··· 6
2. Analysis of overall survival and prognostic factors ··· 10
3. Analysis of progression free survival and prognostic factors ··· 14
4. The subgroup analysis of OS and PFS for patients received GP
chemotherapy ··· 18
5. Analysis of subcutaneous adipose tissue index and visceral adipose
tissue index ··· 23
IV. DISCUSSION ··· 24
V. CONCLUSION ··· 27
REFERENCES ··· 29
APPENDICES ··· 32
ABSTRACT(IN KOREAN) ··· 33
PUBLICATION LIST ··· 35
LIST OF FIGURES
Figure 1. The computed tomography (CT) images of patients
with sarcopenia (left) and without sarcopenia (right) who had
similar body mass index ··· 5
Figure 2. The overall survival of patients with sarcopenia group
and non- sarcoepnia group showing better OS in
non-sarcopenia group (p=0.020) ··· 11
Figure 3. The overall survival of patients with high NLR group
and low NLR group demonstrating the better OS in NLR≤3
group (p<0.001) ··· 11
Figure 4. The overall survival graph depending on sarcopenia
and NLR status showing poor OS in group with sarcopenia and
NLR>3 (p<0.001) ··· 12
Figure 5. The progression free survival graphs with sarcopenia
group and non- sarcoepnia group showing better PFS in
non-sarcopenia group (p=0.009) ··· 15
Figure 6. The progression free survival graphs with high NLR
group and low NLR group demonstrating the better PFS in
NLR≤3 group (p<0.001) ··· 15
Figure 7. The progression free survival graph depending on
sarcopenia and NLR status showing poor PFS in group with
sarcopenia and NLR>3 (p<0.001) ··· 16
Figure 8. The overall survival graph depending on sarcopenia
difference in OS between sarcopenia and non-sarcopenia group
··· 19
Figure 9. The progression free survival graph depending on
sarcopenia among the patients received GP chemotherapy
showing no difference in PFS between sarcopenia and
non-sarcopenia group ··· 19
Figure 10. The overall survival graph depending on NLR among
the patients received GP chemotherapy showing superior OS in
NLR>3 group (p=0.003) ··· 20
Figure 11. The progression free survival graph depending on
NLR among the patients received GP chemotherapy showing
superior PFS in NLR>3 group (p=0.008) ··· 20
LIST OF TABLES
Table 1. Patients characteristics ··· 7
Table 2. Comparision of patients characteristics between
sarcopenia group and non-sarcopenia group ··· 8
Table 3. Univariate and multivariate analysis of OS ··· 13
Table 4. Univariate and multivariate analysis of PFS ··· 16
Table 5. Univariate and multivariate analysis of OS for patients
underwent GP chemotherapy ··· 21
Table 6. Univariate and multivariate analysis of PFS for patients
1
ABSTRACT
Prognostic significance of sarcopenia in advanced biliary tract
cancer patients
Byung Min Lee
Department of Medicine
The Graduate School, Yonsei University
(Directed by Professor Ik Jae Lee)
Purpose: Sarcopenia and systemic inflammation is getting its attention in
patients with malignancy as systemic inflammation and low muscularity have great impact on the survival of cancer patients. There are few studies regarding how the sarcopenia and systemic inflammation affect the prognosis in biliary tract cancer with distant metastasis have been studied. Based on this background, we aimed to investigate the association between the sarcopenia with systemic inflammation and prognosis between the patients with metastatic biliary tract cancer.
Materials and Methods: A total 353 patients with metastatic biliary tract cancer
patients from 2007 to 2016 were analyzed. To evaluate the skeletal muscle mass, the computed tomography image at upper level of 3rd lumbar vertebra (L3) was used. We defined the sarcopenia as follows using Japan Society of Hepatology guideline; L3 muscle index < 42 cm2/m2 for male and < 38cm2/m2 for female
patients. The systemic inflammation status was evaluated using the neutrophil lymphocyte ratio (NLR). Patients with NLR>3 was categorized into patients with inflammatory status. The overall survival (OS) and progression free survival (PFS) were analyzed. The subgroup analysis was performed those who received gemcitabine/cisplatin (GP) chemotherapy. The OS and PFS of patients who received GP chemotherapy were analyzed depending on sarcopenia and inflammatory status.
2
patients without sarcopenia (25.5% vs 38.2%, p=0.019). Concordant to other studies, the patients with high NLR (NLR>3) were associated with inferior OS than low NLR (NLR≤3) (21.0% vs 52.8%, p<0.001). Based on this results, we categorized the patients into 3 groups; patients with sarcopenia accompanied high NLR, patients without sarcopenia and low NLR, and either sarcopenia or high NLR. The OS of patients was well stratified according to this grouping (1-year OS; 18.3% vs 30.3% vs 55.8%, p<0.001). Concordant with OS results, the PFS was well stratified based on either sarcopenia or NLR (Sarcopenia; 9.5% vs 19.4%, p<0.001, NLR; 10.0% vs 23.4%, p<0.001). The PFS was significantly associated with group depending on NLR and sarcopenia (1-year PFS; 7.8% vs 13.0% vs 27.9%, p<0.001).
Conclusion: We find out that the sarcopenia coexist with inflammatory status is
notably associated with inferior OS and also PFS. Based on results that sarcopenia accompanied with inflammatory status has been associated with poor prognosis, the conservative treatment such as nutritional support, exercise and pharmacologic intervention would be helpful to these patients in metastatic biliary tract cancer to overcome the sarcopenia and inflammatory status.
______________________________________________________________ Key words : biliary tract cancer, sarcopenia, inflammation, survival
3
Prognostic significance of sarcopenia in advanced biliary tract
cancer patients
Byung Min Lee
Department of Medicine
The Graduate School, Yonsei University
(Directed by Professor Ik Jae Lee)
I. INTRODUCTION
The sarcopenia is a phenomenon that happens as a part of normal aging process. However, nowadays, it turns out that the sarcopenia is associated not only with aging but also with other health problems such as liver cirrhosis, renal failure, cognitive problems and cancer [1-3]. The sarcopenia especially in cancer patients has gradually gained its significance as the low muscularity was significant predictor of poor prognosis in various cancers [4-6].
One study showed that the low skeletal muscle mass before the surgery was significantly associated with OS in biliary tract cancer (BTC) patients who underwent resection [7, 8]. There are only few reports regarding the sarcopenia as the prognostic factor in advanced BTC [9]. If the loss of skeletal muscle mass occurred, the tolerance to anticancer treatment reduced and it is associated with a decrease in survival [10, 11]. However, the mechanism of sarcopenia in malignancy is not fully defined [12]. As far as is known, the sarcopenia in patients with malignancy were related to inflammation as well as older age, poor performance [11, 13]. Low muscularity of patients could lead to inflammation around the muscle and it contributes to systemic inflammation [14].
Due to seldom knowledge about mechanism of sarcoepnia, the clinical management of sarcopenia is limited and complex [12, 15, 16]. The plan for the management could not be easily established because of little understanding about sarcopenia. For over the past decades, the understanding of sarcopenia has been developed but there is still a lack of a definition, diagnostic criteria for sarcopenia.
Several studies demonstrated that systemic inflammation is related to poor prognosis [17, 18]. To evaluate the systemic inflammatory status, the
4
inflammatory markers such as neutrophil/lymphocyte ratio (NLR), platelet/lymphocyte ratio (PLR) and C-reactive protein (CRP) commonly used. Several studies showed that patients with high NLR and low skeletal muscle mass were related to inferior OS rate in colorectal cancer, small cell lung cancer and head and neck cancer [19-21]. We aimed to demonstrate that patients with sarcopenia accompanying systemic inflammation would affect the overall survival in advanced BTC.
II. MATERIALS AND METHODS
1. Patient population
We retrospectively reviewed the advanced BTC patients who treated in single institution. The patients with gallbladder cancer, intrahepatic, perihilar, extrahepatic bile duct cancer, and ampullar of vater cancer were included in this study. The patients with distant metastasis at initial diagnosis were analyzed in this study.
Three hundred fifty-three patients were analyzed who diagnosed metastatic BTC in Gangnam Severance Hospital from January 2007 to November 2016. The diagnosis of the patient was made through tissue biopsy or cytology. The inclusion criteria for this study were as follows: 1) age more than 18 years, 2) diagnosis of BTC via histologic confirmation 3) metastatic BTC at diagnosis and 4) patients with available for medical records.
The exclusion criteria were as follows: 1) patients with widespread brain or leptomeningeal metastasis, 2) uncontrolled infections or poor medical conditions, 3) synchronous malignancies and 4) patients with follow up loss 5) patients who could not measure the tissue area at the 3rd lumbar level or patients
without height data. This study was approved by the institutional review board of the Gangnam Severance Hospital (3-2019-0257)
2. Measurement of body composition and definition of sarcopenia
5
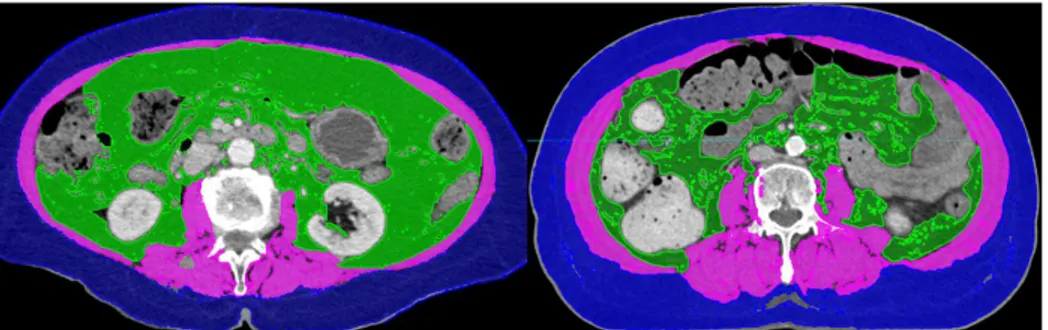
which was validated previously was used to define whether the patients were sarcopenia status or not. We selected a single axial slice at the upper border of L3 spine level for measurement. The delineation of skeletal muscle, visceral fat and subcutaneous fat tissue was performed using MIM Vista software (MIM corp., Version 6.6.14, OH, USA) based on Hounsfield units (HUs). The threshold of HUs was applied as follows; Skeletal muscle was −29 to +150 HU, visceral fat tissue was −150 to −50 HU, and subcutaneous fat tissue was −190 to −30 HU. The measurements for sarcopenia were performed by one radiation oncologist (B.M.Lee) and the treatment outcome was kept blinded to lessen the bias.
To determine the amount of skeletal muscle, the L3 skeletal muscle index was used. First, the cross sectional volume at L3 level was divided by the thickness of the axial slice to get cross sectional area. The cross sectional areas were divided by the height of the patients and the L3 skeletal muscle index was obtained. According to international consensus, the sarcopenia was defined as follows; L3 muscle index is less than 55 cm2/m2 and 39 cm2/m2 for male and
female, respectively [22]. However, the studies contributed to this consensus was mostly based on European and American guidelines [23, 24] Due to this reason, we applied the other definition of sarcopenia as the patients included in this study were Asian. According to the Japan Society of Hepatology (JSH) guideline, the sarcopenia defined as follows; Male less than 42 cm2/m2 and
female less than 38 cm2/m2 [25]. We adopted the definition of JSH which
presents the Asian patients with liver disease. Figure 1 demonstrates the CT images of patients with sarcopenia and without sarcopenia.
Figure 1.The computed tomography (CT) images of patients with sarcopenia (left) and without sarcopenia (right) who had similar body mass index.
6 3. Indicator of inflammatory status
Among several inflammatory markers, we analyzed the neutrophil lymphocyte ratio (NLR) to evaluate the inflammatory status of patients. The NLR was calculated by dividing the neutrophil count by lymphocyte count. Although there are several studies suggesting elevated NLR was associated with poor prognosis, the optimal cut off values for NLR were different in each studies [26, 27]. We adopted the cut off value of NLR which used in metastatic BTC previously [28]. Every blood count of patients was taken before determining the treatments. The initial blood count before the treatment was used to calculate the NLR.
4. Statistical analysis
The Fisher’s exact test or χ2 test were used for analysis of categorical
data. For continuous data, the Mann-Whitney-U test was used for comparison. The overall survival (OS) was defined as the time from the date of diagnosis to either death of any cause or to last follow-up. The progression free survival (PFS) was defined as the time from the date of diagnosis to date of either disease progression or death. The survival curves were evaluated using the Kaplan-Meier method. The univariate and multivariate analysis were performed using Cox propositional hazards model to determine the association between OS, PFS and factors we suggested. The multivariate analysis was conducted using the variables that significant predictor of OS, PFS in univariate analysis. The hazard ratios (HRs) and 95% confidence intervals (CIs) were acquired. The
p-value less than 0.05 was considered to be significant statistically. The
analyses were conducted using IBM SPSS version 25.0 (SPSS, Chicago, IL, USA).
III. RESULTS
1.Patient characteristics
A total of 353 patients were included with a median follow up of 7.77 months (Interquartile range [IQR]: 3.27 – 14.70 months). Table 1 shows the
7
patients’ characteristics of overall patients. The median age was 67 years (IQR: 58 – 75) and male patients were slightly predominant with 203 patients (57.5%). Among 353 patients, 158 patients (44.9%) showed good performance status with ECOG 0 or 1 while 194 patients (55.1%) experienced poor performance status (ECOG≥2). Histologically, 202 tumors (74.8%) were well-differentiated or moderately differentiated tumor.
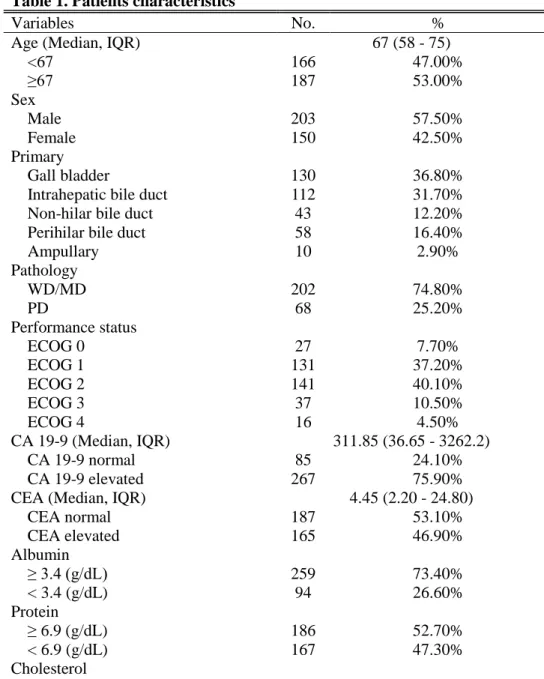
Table 1. Patients characteristics
Variables No. %
Age (Median, IQR) 67 (58 - 75)
<67 166 47.00% ≥67 187 53.00% Sex Male 203 57.50% Female 150 42.50% Primary Gall bladder 130 36.80%
Intrahepatic bile duct 112 31.70%
Non-hilar bile duct 43 12.20%
Perihilar bile duct 58 16.40%
Ampullary 10 2.90% Pathology WD/MD 202 74.80% PD 68 25.20% Performance status ECOG 0 27 7.70% ECOG 1 131 37.20% ECOG 2 141 40.10% ECOG 3 37 10.50% ECOG 4 16 4.50% CA 19-9 (Median, IQR) 311.85 (36.65 - 3262.2) CA 19-9 normal 85 24.10% CA 19-9 elevated 267 75.90%
CEA (Median, IQR) 4.45 (2.20 - 24.80)
CEA normal 187 53.10% CEA elevated 165 46.90% Albumin ≥ 3.4 (g/dL) 259 73.40% < 3.4 (g/dL) 94 26.60% Protein ≥ 6.9 (g/dL) 186 52.70% < 6.9 (g/dL) 167 47.30% Cholesterol
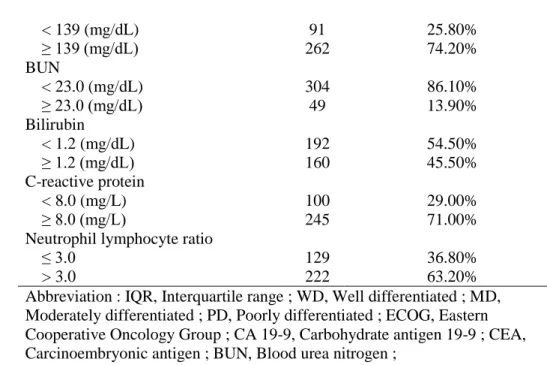
8 < 139 (mg/dL) 91 25.80% ≥ 139 (mg/dL) 262 74.20% BUN < 23.0 (mg/dL) 304 86.10% ≥ 23.0 (mg/dL) 49 13.90% Bilirubin < 1.2 (mg/dL) 192 54.50% ≥ 1.2 (mg/dL) 160 45.50% C-reactive protein < 8.0 (mg/L) 100 29.00% ≥ 8.0 (mg/L) 245 71.00%
Neutrophil lymphocyte ratio
≤ 3.0 129 36.80%
> 3.0 222 63.20%
Abbreviation : IQR, Interquartile range ; WD, Well differentiated ; MD, Moderately differentiated ; PD, Poorly differentiated ; ECOG, Eastern Cooperative Oncology Group ; CA 19-9, Carbohydrate antigen 19-9 ; CEA, Carcinoembryonic antigen ; BUN, Blood urea nitrogen ;
We divided the patients into two groups according to the presence of sarcopenia. Table 2 compares the patients’ characteristics between the patients with sarcopenia and without sarcopenia. More sarcopenia than non-sarcopenia patients showed older age (71 vs 65 year, p<0.001) and more female patients (51.6% vs 35.1% p=0.002). The sarcopenia group had more patients with poor performance status (ECOG ≥ 2) than non-sarcopenia group (68.4% vs 44.3%, p < 0.001). The several significant differences were shown in blood chemistry profile between two groups. There were more patients with hypoalbuminemia and hypoproteinemia in sarcopenia group (Hypoalbuminemia; 34.6% vs 20.1%, p=0.002, Hypoproteinemia; 53.5% vs 42.3%, p=0.036). Concerning inflammatory markers, more patients with NLR> 3 were distributed in sarcopenia group (72.8% vs 55.4%, p<0.001).
Table 2. Comparision of patients characteristics between sarcopenia group and non-sarcopenia group
Sarcopenia
(n=159)
Non-sarcopenia
(n=194)
Variables No. % No. % p-value
Age (Median, IQR) 71 (62 - 79) 65 (56 - 71)
9 ≥67 106 66.70% 81 41.80% Sex Male 77 48.40% 126 64.90% 0.002 Female 82 51.60% 68 35.10% Primary Gall bladder 56 35.20% 74 38.10% 0.618
Intrahepatic bile duct 53 33.30% 59 30.40% Non-hilar bile duct 16 10.10% 27 13.90% Perihilar bile duct 28 17.60% 30 15.50%
Ampullary 6 3.80% 4 2.10% Pathology WD/MD 79 69.90% 123 78.30% 0.115 PD 34 30.10% 34 21.70% Performance status ECOG 0 7 4.40% 20 10.30% <0.001 ECOG 1 43 27.20% 88 45.40% ECOG 2 75 47.50% 66 34.00% ECOG 3 22 13.90% 15 7.70% ECOG 4 11 7.00% 5 2.60% CA19-9 CA 19-9 normal 34 21.40% 51 26.40% 0.271 CA 19-9 elevated 125 78.60% 142 73.60% CEA CEA normal 75 47.20% 112 58.00% 0.042 CEA elevated 84 52.80% 81 42.00% Albumin ≥ 3.4 (g/dL) 104 65.40% 155 79.90% 0.002 < 3.4 (g/dL) 55 34.60% 39 20.10% Protein ≥ 6.9 (g/dL) 74 46.50% 112 57.70% 0.036 < 6.9 (g/dL) 85 53.50% 82 42.30% Cholesterol < 139 (mg/dL) 42 26.40% 49 25.30% 0.805
10 ≥ 139 (mg/dL) 117 73.60% 145 74.70% BUN < 23.0 (mg/dL) 134 84.30% 170 87.60% 0.365 ≥ 23.0 (mg/dL) 25 15.70% 24 12.40% Bilirubin < 1.2 (mg/dL) 85 53.50% 107 55.40% 0.71 ≥ 1.2 (mg/dL) 74 46.50% 86 44.60% C-reactive protein < 8.0 (mg/L) 43 27.40% 57 30.30% 0.55 ≥ 8.0 (mg/L) 114 72.60% 131 69.70%
Neutrophil lymphocyte ratio
≤ 3.0 43 27.20% 86 44.60% 0.001
> 3.0 115 72.80% 107 55.40%
Abbreviation : IQR, Interquartile range ; WD, Well differentiated ; MD, Moderately differentiated ; PD, Poorly differentiated ; ECOG, Eastern Cooperative Oncology Group ; CA 19-9, Carbohydrate antigen 19-9 ; CEA, Carcinoembryonic antigen ; BUN, Blood urea nitrogen
2. Analysis of overall survival and prognostic factors
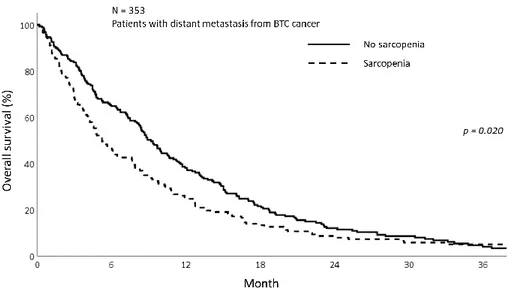
The median OS is 7.77 months (IQR; 3.27 – 14.70) for overall patients. The median OS was 5.23 and 8.90 months in sarcopenia and non-sarcopenia group respectively (p=0.057). The 1-year OS was significantly different between sarcopenia and non-sarcopenia (25.5% vs 38.2%, p=0.020) (Fig 2). As the mechanism of sarcopenia in cancer patients were known to be associated to cancer-related inflammation, we assessed the effect of systemic inflammation on survival using NLR. The figure 3 shows the OS of patients with metastatic BTC between the patients with elevated NLR and those without and there was significant difference. The 1-year OS for patients with NLR>3 was 21.0%
11 Figure 2. The overall survival of patients with sarcopenia group and non- sarcoepnia group showing better OS in non-sarcopenia group (p=0.020)
Figure 3. The overall survival of patients with high NLR group and low NLR group demonstrating the better OS in NLR≤3 group (p<0.001)
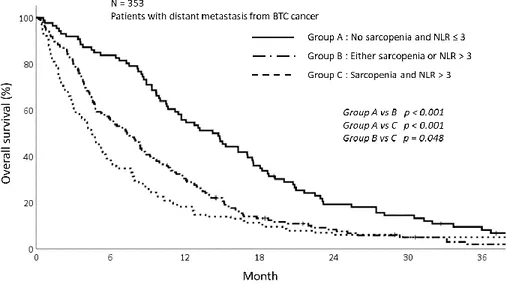
Based on this result, we analyzed the survival depending on sarcopenia and inflammatory status. We stratified the patients into 3 groups according to
12
sarcopenia and NLR as follow; Patients with no sarcopenia and NLR ≤3, patients with sarcopenia and NLR>3 and lastly, patients with either sarcopenia or elevated NLR. The survival of patients with sarcopenia and NLR>3 were significantly poorer than those with not. The 1-year OS for patients showing NLR≤3 and without sarcopenia was 55.8% while the 1-year OS for the group with NLR>3 and sarcopenia or either was 18.3% and 30.3%, respectively (p<0.001) (Fig 4).
Figure 4. The overall survival graph depending on sarcopenia and NLR status showing poor OS in group with sarcopenia and NLR>3 (p<0.001)
The results of univariate and multivariate analysis were summarized in table 3. In univariate analysis, the sarcopenia, NLR, and groups based on sarcopenia and NLR were significant factor affecting OS. As these 3 factors are highly correlated with each other, we performed the multivariate analysis using only the groups depending on sarcopenia and NLR status. In multivariate analysis, patients with sarcopenia and high NLR (p=0.004) were significantly associated with poor OS along with male patients (p=0.010), higher CA 19-9 (p=0.032), poor ECOG status (p<0.001).
13 Table 3. Univariate and multivariate analysis of OS
Univariate analysis Multivariate analysis Variables HR 95% CI p-value HR 95% CI p-value Sex (Male vs Female) 1.24 1.00 - 1.55 0.050 1.414 1.09 - 1.84 0.010 Age (<67 vs ≥67) 1.15 0.93 - 1.44 0.185 Pathology (WD/MD vs PD) 1.53 1.15 - 2.03 0.003 ECOG <0.001 <0.001 ECOG 0 vs 1 2.11 1.32 - 3.40 0.002 1.988 1.17 - 3.38 0.011 ECOG 0 vs 2 2.97 1.85 - 4.78 <0.001 2.520 1.47 - 4.32 0.001 ECOG 0 vs 3 6.84 3.94 - 11.88 <0.001 6.166 3.16 - 12.02 <0.001 ECOG 0 vs 4 14.27 7.28 - 28.02 <0.001 5.981 1.92 - 18.61 0.002 CA 19-9 (per 100) 1.00 1.00 - 1.01 <0.001 1.002 1.00 - 1.004 0.032 CEA (per 20) 1.00 1.00 - 1.01 0.066 CRP (Normal vs Elevated) 1.86 1.45 - 2.39 <0.001 Albumin (≥ 3.4 vs < 3.4) 1.96 1.54 - 2.51 <0.001 Protein (≥ 6.9 vs < 6.9) 1.42 1.15 - 1.77 0.001 Cholesterol (<139 vs ≥139) 0.66 0.52 - 0.85 0.001 BUN (<23.0 vs ≥23.0) 1.44 1.07 - 1.97 0.018 Bilirubin (< 1.2 vs ≥ 1.2) 0.98 0.80 - 1.23 0.920 NLR (< 3.00 vs ≥3.00) 1.93 1.55 - 2.43 <0.001 Sarcopenia (Yes vs No) 0.77 0.62 - 0.96 0.020 VATI (Low vs High) 0.98 0.79 - 1.22 0.860 SATI (Low vs High) 0.85 0.69 - 1.06 0.156
14 BMI (<25 vs ≥25) 0.80 0.63 - 1.03 0.085 Sarcopenia & NLR <0.001 0.004 Low NLR & no sarcopenia vs either 1.68 1.28 - 2.22 <0.001 1.601 1.16 - 2.22 0.005 Low NLR & no sarcopenia vs High NLR & sarcopenia 2.12 1.59 - 2.84 <0.001 1.796 1.25 - 2.59 0.002 Abbreviation : HR, Hazard ratio ; CI , Confidence interval ; CBD, Common bile duct ; CCC, Cholangiocarcinoma ; GB, Gallbladder ; WD, Well differentiated ; MD, Moderately differentiated ; PD, Poorly differentiated ; ECOG, Eastern Cooperative Oncology Group ; CA 19-9, Carbohydrate antigen 19-9 ; CEA, Carcinoembryonic antigen ; CRP, C-reactive protein ; BUN, Blood urea nitrogen ; NLR, Neutrophil lymphocyte ratio ; VATI, Visceral adipose tissue index ; SATI, Subcutaneous adipose tissue index
3. Analysis of progression free survival and prognostic factors
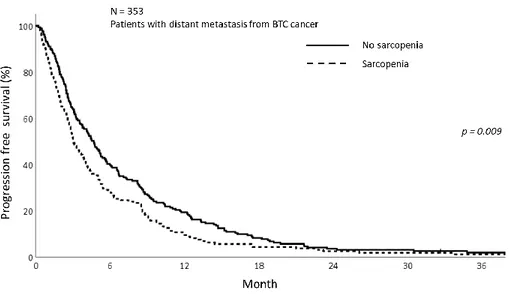
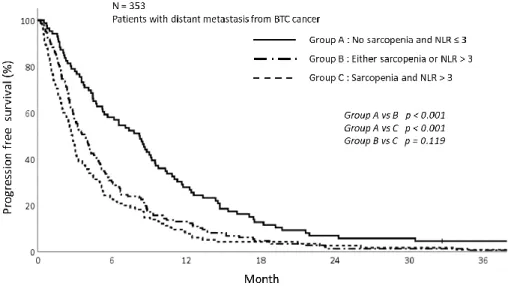
The PFS was also analyzed according to sarcopenia and inflammatory status. As shown in figure 5, patients in sarcopenia group was related with inferior PFS (1-year PFS; 9.5% vs 19.4%, p<0.009). Concordant with sarcoepenia results, the PFS was significantly different depending on NLR status. The patients with NLR>3 showed inferior PFS than NLR≤3 (1-year PFS; 10.0% vs 23.4%, p<0.001) (Fig 6). Patients with sarcopenia and high NLR demonstrated poorer PFS than other two groups (1-year PFS; 7.8% vs 13.0% vs 27.9%, p<0.001) (Fig 7).
15 Figure 5. The progression free survival graphs with sarcopenia group and non- sarcoepnia group showing better PFS in non-sarcopenia group (p=0.009)
Figure 6. The progression free survival graphs with high NLR group and low NLR group demonstrating the better PFS in NLR≤3 group (p<0.001)
16 Figure 7. The progression free survival graph depending on sarcopenia and NLR status showing poor PFS in group with sarcopenia and NLR>3 (p<0.001)
In univariate analysis, the NLR, sarcopenia, and group depending on NLR and sarcopenia were significantly associated with PFS. The group representing the patients with sarcopenia and high NLR was the significant predictor of poor PFS. Along with high NLR and sarcopenia, the poorly differentiated carcinoma (p=0.017), the poor performance (p<0.001) and the higher CA 19-9 (p=0.011) were were significant predictors of poor PFS (Table 4)
Table 4. Univariate and multivariate analysis of PFS
Univariate analysis Multivariate analysis Variables HR 95% CI p-value HR 95% CI p-value Sex (Male vs Female) 1.24 1.00 - 1.542 0.047 Age (<67 vs ≥67) 1.04 0.84 - 1.29 0.717 Pathology (WD/MD vs PD) 1.67 1.26 - 2.21 <0.001 1.44 1.07 - 1.95 0.017 ECOG <0.001 <0.001 ECOG 0 vs 1 1.68 1.09 - 2.59 0.018 1.48 0.92 - 2.39 0.110
17 ECOG 0 vs 2 2.01 1.31 - 3.08 0.001 1.60 0.98 - 2.60 0.058 ECOG 0 vs 3 4.49 2.69 - 7.49 <0.001 3.94 2.08 - 7.47 <0.001 ECOG 0 vs 4 6.23 3.30 - 11.77 <0.001 2.02 0.67 - 6.03 0.210 CA 19-9 (per 100) 1.00 1.00 - 1.00 0.001 1.00 1.00 - 1.01 0.011 CEA (per 20) 1.00 0.99 - 1.01 0.220 CRP (Normal vs Elevated) 1.71 1.34 - 2.18 <0.001 Albumin (≥ 3.4 vs < 3.4) 1.59 1.25 - 2.02 <0.001 Protein (≥ 6.9 vs < 6.9) 1.34 1.09 - 1.66 0.006 Cholesterol (<139 vs ≥139) 0.71 0.55 - 0.90 0.005 BUN (<23.0 vs ≥23.0) 1.23 0.90 - 1.67 0.191 Bilirubin (< 1.2 vs ≥ 1.2) 0.89 0.72 - 1.11 0.302 NLR (< 3.00 vs ≥3.00) 1.75 1.40 - 2.18 <0.001 Sarcopenia (Yes vs No) 0.75 0.61 - 0.93 0.009 VATI (Low vs High) 0.92 0.74 - 1.13 0.416 SATI (Low vs High) 0.88 0.71 - 1.09 0.246 BMI (<25 vs ≥25) 0.85 0.67 - 1.08 0.195 Sarcopenia & NLR <0.001 0.015 Low NLR & no sarcopenia vs either 1.67 1.27 - 2.18 <0.001 1.49 1.09 - 2.04 0.014 Low NLR & no sarcopenia vs High NLR & sarcopenia 2.00 1.50 - 2.65 <0.001 1.64 1.15 - 2.34 0.007 Abbreviation : HR, Hazard ratio ; CI , Confidence interval ; CBD, Common bile duct ; CCC, Cholangiocarcinoma ; GB, Gallbladder ; WD, Well
18
differentiated ; MD, Moderately differentiated ; PD, Poorly differentiated ; ECOG, Eastern Cooperative Oncology Group ; CA 19-9, Carbohydrate antigen 19-9 ; CEA, Carcinoembryonic antigen ; CRP, C-reactive protein ; BUN, Blood urea nitrogen ; NLR, Neutrophil lymphocyte ratio ; VATI, Visceral adipose tissue index ; SATI, Subcutaneous adipose tissue index
4. The subgroup analysis of OS and PFS for patients received GP chemotherapy
The subgroup analysis among the patients who received gemcitabine/cisplatin (GP) based chemotherapy was performed. Among the 353 patients, 132 patients received GP chemotherapy, the first line chemotherapy in advanced BTC. The median follow up period was 10.67 months (IQR; 5.97 – 18.48). The OS and PFS rates for patients received GP chemotherapy were evaluated depending on sarcopenia and inflammatory status.
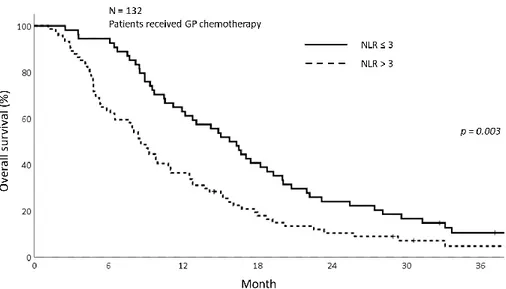
The OS and PFS were not significantly differed between the sarcopenia group and non-sarcopenia group among the patients received GP chemotherapy. The 1-year OS for sarcopenia patients was 42.6 % and 50.7% for non-sarcopenia patients (p=0.844) (Fig 8). The 1-year PFS was 12.7% and 28.0% respectively for sarcopenia patients and non-sarcopenia (p=0.123) (Fig 9). The comparison of OS and PFS depending on NLR status is shown in figure 10 and 11. The patients with NLR>3 was significantly related with poor OS and PFS compared to patients with NLR≤3 (1-year OS; 63.0% vs 36.5%, p=0.003, 1-year PFS; 27.3% vs 17.6%, p=0.008).
19 Figure 8. The overall survival graph depending on sarcopenia among the patients received GP chemotherapy showing no difference in OS between sarcopenia and non-sarcopenia group
Figure 9. The progression free survival graph depending on sarcopenia among the patients received GP chemotherapy showing no difference in PFS between sarcopenia and non-sarcopenia group
20 Figure 10. The overall survival graph depending on NLR among the patients received GP chemotherapy showing superior OS in NLR>3 group (p=0.003)
Figure 11. The progression free survival graph depending on NLR among the patients received GP chemotherapy showing superior PFS in NLR>3 group (p=0.008)
21
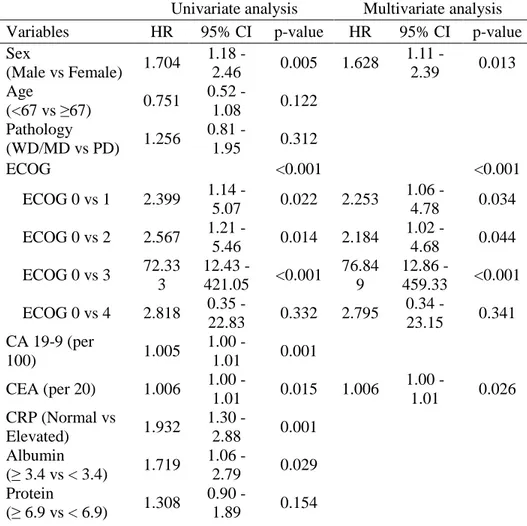
Table 5 summarized the results of univariate and multivariate analysis in OS among the patients who received GP chemotherapy. The OS was not affected by the sarcopenia (p=0.844) but was affected by the high NLR (p=0.003) in univariate analysis. The multivariate analysis also showed the relevance of OS and high NLR (p=0.019). The results of univariate and multivariate analysis of PFS are shown in table 6. The sarcopenia was not associated with PFS but the inflammation status was significantly associated with PFS (p=0.003). The NLR status remained its significance in multivariate analysis in PFS (p=0.019).
Table 5. Univariate and multivariate analysis of OS for patients underwent GP chemotherapy
Univariate analysis Multivariate analysis Variables HR 95% CI p-value HR 95% CI p-value Sex (Male vs Female) 1.704 1.18 - 2.46 0.005 1.628 1.11 - 2.39 0.013 Age (<67 vs ≥67) 0.751 0.52 - 1.08 0.122 Pathology (WD/MD vs PD) 1.256 0.81 - 1.95 0.312 ECOG <0.001 <0.001 ECOG 0 vs 1 2.399 1.14 - 5.07 0.022 2.253 1.06 - 4.78 0.034 ECOG 0 vs 2 2.567 1.21 - 5.46 0.014 2.184 1.02 - 4.68 0.044 ECOG 0 vs 3 72.33 3 12.43 - 421.05 <0.001 76.84 9 12.86 - 459.33 <0.001 ECOG 0 vs 4 2.818 0.35 - 22.83 0.332 2.795 0.34 - 23.15 0.341 CA 19-9 (per 100) 1.005 1.00 - 1.01 0.001 CEA (per 20) 1.006 1.00 - 1.01 0.015 1.006 1.00 - 1.01 0.026 CRP (Normal vs Elevated) 1.932 1.30 - 2.88 0.001 Albumin (≥ 3.4 vs < 3.4) 1.719 1.06 - 2.79 0.029 Protein (≥ 6.9 vs < 6.9) 1.308 0.90 - 1.89 0.154
22 Cholesterol (<139 vs ≥139) 0.771 0.49 - 1.21 0.256 BUN (<23.0 vs ≥23.0) 0.967 0.49 - 1.91 0.924 Bilirubin (< 1.2 vs ≥ 1.2) 1.083 0.75 - 1.56 0.668 NLR (< 3.00 vs ≥3.00) 1.744 1.21 - 2.52 0.003 1.596 1.08 - 2.36 0.019 Sarcopenia (Yes vs No) 0.964 0.67 - 1.39 0.844 VATI (Low vs High) 1.158 0.80 - 1.67 0.431 SATI (Low vs High) 0.951 0.66 - 1.37 0.788 BMI (<25 vs ≥25) 0.887 0.60 - 1.32 0.554
Abbreviation : HR, Hazard ratio ; CI , Confidence interval ; CBD, Common bile duct ; CCC, Cholangiocarcinoma ; GB, Gallbladder ; WD, Well differentiated ; MD, Moderately differentiated ; PD, Poorly differentiated ; ECOG, Eastern Cooperative Oncology Group ; CA 19-9, Carbohydrate antigen 19-9 ; CEA, Carcinoembryonic antigen ; CRP, C-reactive protein ; BUN, Blood urea nitrogen ; NLR, Neutrophil lymphocyte ratio ; VATI, Visceral adipose tissue index ; SATI, Subcutaneous adipose tissue index
Table 6. Univariate and multivariate analysis of PFS for patients underwent GP chemotherapy
Univariate analysis Multivariate analysis Variables HR 95% CI p-value HR 95% CI p-value Sex (Male vs Female) 1.586 1.11 - 2.26 0.011 Age (<67 vs ≥67) 0.744 0.52 - 1.06 0.101 Pathology (WD/MD vs PD) 1.570 1.02 - 2.41 0.042 1.601 1.03 - 2.49 0.036 ECOG 0.033 ECOG 0 vs 1 1.997 1.01 - 3.93 0.045 ECOG 0 vs 2 1.755 0.88 - 3.49 0.108 ECOG 0 vs 3 11.61 7 2.41 - 55.92 0.002
23 ECOG 0 vs 4 1.204 0.15 - 9.49 0.860 CA 19-9 (per 100) 1.005 1.00 - 1.01 0.002 1.004 1.00 - 1.01 0.005 CEA (per 20) 1.004 0.99 - 1.01 0.097 CRP (Normal vs Elevated) 1.685 1.15 - 2.46 0.007 Albumin (≥ 3.4 vs < 3.4) 1.468 0.92 - 2.33 0.104 Protein (≥ 6.9 vs < 6.9) 1.311 0.92 - 1.88 0.137 Cholesterol (<139 vs ≥139) 0.814 0.53 - 1.26 0.353 BUN (<23.0 vs ≥23.0) 0.402 0.38 - 1.48 0.402 Bilirubin (< 1.2 vs ≥ 1.2) 0.989 0.70 - 1.41 0.949 NLR (< 3.00 vs ≥3.00) 1.616 1.13 - 2.32 0.009 1.562 1.06 - 2.30 0.025 Sarcopenia (Yes vs No) 0.758 0.53 - 1.08 0.126 VATI (Low vs High) 1.076 0.76 - 1.53 0.686 SATI (Low vs High) 0.858 0.60 - 1.22 0.397 BMI (<25 vs ≥25) 0.869 0.59 - 1.28 0.476
Abbreviation : HR, Hazard ratio ; CI , Confidence interval ; CBD, Common bile duct ; CCC, Cholangiocarcinoma ; GB, Gallbladder ; WD, Well differentiated ; MD, Moderately differentiated ; PD, Poorly differentiated ; ECOG, Eastern Cooperative Oncology Group ; CA 19-9, Carbohydrate antigen 19-9 ; CEA, Carcinoembryonic antigen ; CRP, C-reactive protein ; BUN, Blood urea nitrogen ; NLR, Neutrophil lymphocyte ratio ; VATI, Visceral adipose tissue index ; SATI, Subcutaneous adipose tissue index
5. Analysis of subcutaneous adipose tissue index and visceral adipose tissue index
To evaluate the prognostic significance depending on subcutaneous adipose tissue index (SATI) and visceral adipose tissue index (VATI), we compared the OS according to high and low SATI and VATI. The cut off value
24
for VATI and SATI were determined by median value. The VATI cut off value for male was 29.5cm2/m2, for female was 28.5cm2/m2 and the cut off value of
SATI for male was 26.5cm2/m2 and for female was 56.5 cm2/m2. The more
sarcopenia than non-sarcopenia patients had more patients with either low VATI or low SATI. (VATI; 57.2% vs 41.8%, p=0.004, SATI; 61.0% vs 36.6%, p<0.001).
We compared the OS of patients depending on VATI and SATI respectively. There was no difference of OS between patients with high VATI and low VATI (1-year OS: 34.6% vs 30.2%, p=0.860). Also, concordant with VATI results, the SATI was not significant factor for OS. The 1-year OS for high SATI was 35.0% and low SATI was 29.7% (p=0.155). In all together, the adipose index was not associated with OS in metastatic BTC.
IV. DISCUSSION
In this study, we demonstrated that the patients with sarcopenia were significantly associated with poor OS and PFS compared to those without sarcopenia in BTC with distant metastasis at diagnosis. Furthermore, the patients with high NLR indicating inflammatory status play a significant role in OS and PFS. Based on these two results, we stratified the patients into 3 groups and there was a significant difference in OS and PFS between these groups. The patients with sarcopenia accompanied the inflammation showed inferior OS and PFS.
1. The sarcopenia affecting the prognosis
There is increasing evidence that the loss of muscle may affect the prognosis of cancer [5, 6]. As patients with malignancy are tended to be vulnerable to degenerative conditions, the decreased muscle mass and dysfunction are easily observed. Especially in malignancy progressed to unresectable or metastatic stage, the sarcopenia tend to occur often [29]. The relevance between sarcopenia and poor prognosis was shown in breast cancer [6], lung cancer [4], esophageal cancer [30], hepatocellular cancer [31], and colon cancer [32].
There is one article represented the relevance of sarcopenia and prognosis of patients with BTC. Yoon et al used two ways to evaluate the
25
sarcopenia status of patients; skeletal muscle attenuation and index. The author suggested that patients showing low skeletal muscle attenuation were associated with negative influence on survival those who underwent resection for BTC [33].
In our study, the sarcopenia alone did not worsen the PFS and OS in multivariate analysis. However, the patients with sarcopenia were significantly associated with poor prognosis in univariate analysis. Concordant with our data, in Yoon et al which analyzed about the significance of sarcopenia on BTC, low skeletal muscle index did not decreased the survival in multivariate survival [33]. It could be explained as the BTC is more affected by tumor specific factors rather than patient related factor such as sarcopenia.
There are controversial about the cut off values of sarcopenia to determine as there are several factors to consider such as the age, sex of patients, ethinicity, what level to be measured and which part of anatomy to be used. We adopted the cut off value of JSH guidelines which representing the Asian patients with liver disease [25]. As the amount of muscle waste is different depending on disease and ethinicity, further study would be helpful to clarify the cut off value of sarcopenia in metastatic biliary tract cancer.
2. The systemic inflammation affecting the prognosis
The systemic inflammation is a crucial parameter predicting cancer outcome in multiple cancers. Many inflammatory markers, such as CRP, NLR and PLR have been analyzed to find out the association between poor prognosis and various cancers [34-36].
Due to inflammatory response, the cytokines such as phosphatidylinositol 3-kinase, metalloproteinase-9 are recruited along the cancer, promote the proliferation of cancer cells and inhibit apoptosis of cancer cells [37]. Also, the cytokines promote the angiogenesis and tumor migration [38]. Based on these phenomena, the inflammation plays a key role in cancer progression. The high NLR associated with poor prognosis and poor response to treatment has been demonstrated in various cancer including melanoma [39], colorectal cancer [40, 41], intrahepatic cholangiocarcinoma [42], prostate cancer [43] and pancreatic cancer [44].
26
In biliary tract cancer, the NLR cut off value 3 is frequently used to evaluate the inflammatory status. Several studies compared the NLR>3 and NLR≤3 of OS in BTC. In these studies, the patients with NLR>3 showed poor OS compared to patients with NLR≤3 (Median OS; 21.6 months vs. 12.0 months, p=0.01). The patients with advanced stage were more predictive to NLR status than surgical group [26, 27]. In our study, the OS was significantly different depending NLR status.
3. The sarcopenia accompanied with systemic inflammation affecting the prognosis
Notably, patients with inflammation accompanied sarcopenia were associated with poor prognosis. These patients showed poor OS rates and also more disease progression than those without. The more studies demonstrating the relations between systemic inflammation and waste of muscle mass are getting its attention [21]. There is a close connection between inflammatory markers and the activation of catabolic pathway [45]. For instance, the tumor necrosis factor (TNF) and interleukin 6 (IL-6) are generated from the tumors and encompass cells and these cytokines not only hasten the degradation of protein but also inhibited the synthesis of protein [46]. Taken together, the systemic inflammation and sarcopenia are worsening each other.
The patients with sarcopenia in this study demonstrated high rate of inflammation such as CRP and NLR, and this reflects that sarcopenia are markers showing the increased activity of aggressive tumor [47]. The same result was demonstrated in head and neck cancer. Cho et al. represented that sarcopenia accompanied systemic inflammation was significantly associated with poor OS and PFS. Also, the patients with sarcopenia showed more frequent treatment interruption. Due to muscle wasting, the patients are hard to endure the treatment well [19].
In our study, the sarcopenia accompanied with systemic inflammation showed inferior OS and PFS. The poor treatment outcome could be explained because these patients may not tolerate well to treatment. For this reason, the sarcopenia did not lower the OS and PFS among the patients who received GP chemotherapy which is the 1st line chemotherapy. The patients who could
tolerate the chemotherapy well received GP chemotherapy and among these patients, the sarcopenia did not significantly lower OS and PFS.
27 4. The SATI and VATI influence on prognosis
The other factors describing the adipose tissue composition of patients such as VATI and SATI were not associated with long-term survival in our study. However, there are some reports demonstrating the high visceral fat is associated with poor survival in cancer patients [48]. The reason for opposite results could be explained that there are significantly less obese patients in Asia compared to patients in western. In other studies, patients showing overweight or obese status are over half of overall patients [49, 50]. In contrary, there are only 26.1% of patients representing overweight in our cohort. As the patients with high VATI was not sufficient, the VATI could not adversely affect the prognosis of cancer patients especially for Asian.
5. Limitation
There are some limitations in this study. First, the result should be interpreted with cautions due to its retrospective study nature. For example, we concluded that there is a relation between the sarcopenia, systemic inflammation and the survival. However, the causal relationship was not identified in this study. We could not demonstrate the cause and consequences of this phenomenon. Secondary, only the Korean patients were included in this study. The skeletal muscle mass are various depending on the disease, status of patients and ethnicity of patients. For this reason, the diverse cut-off values for sarcopenia are used. In this study, we adopted the sarcopenia definition created by the Japan Society of Hepatology (JSH). Yet, the optimal cut off value of sarcopenia for Korean cancer patients is rare. To evaluate the sarcopenia status for Korean population especially with malignancy, the further studies are necessary for new criteria of sarcopenia. Despite these limitation, this is the first study demonstrated the poor prognosis of sarcopenia accompanied systemic inflammation in metastatic BTC.
V. CONCLUSION
In conclusion, patients accompanied the sarcopenia with systemic inflammation at diagnosis was associated with poor OS in BTC with distant metastasis. The exercise, nutrition support and pharmacologic interventions blocking the cytokines related to muscle atrophy signals or inducing muscle hypertrophy could enhance the survival of cancer patients with sarcopenia and
28
29 REFERENCES
1. Hanai, T., et al., Sarcopenia impairs prognosis of patients with liver
cirrhosis. Nutrition, 2015. 31(1): p. 193-9.
2. Pereira, R.A., et al., Sarcopenia in chronic kidney disease on
conservative therapy: prevalence and association with mortality.
Nephrol Dial Transplant, 2015. 30(10): p. 1718-25.
3. Moon, J.H., et al., Sarcopenia as a predictor of future cognitive
impairment in older adults. Journal of Nutrition Health & Aging, 2016. 20(5): p. 496-502.
4. Prado, C.M., et al., Prevalence and clinical implications of sarcopenic
obesity in patients with solid tumours of the respiratory and gastrointestinal tracts: a population-based study. Lancet Oncol, 2008. 9(7): p. 629-35.
5. van Vledder, M.G., et al., Body composition and outcome in patients
undergoing resection of colorectal liver metastases. Br J Surg, 2012. 99(4): p. 550-7.
6. Villasenor, A., et al., Prevalence and prognostic effect of sarcopenia in
breast cancer survivors: the HEAL Study. J Cancer Surviv, 2012. 6(4): p.
398-406.
7. Okumura, S., et al., Impact of the preoperative quantity and quality of
skeletal muscle on outcomes after resection of extrahepatic biliary malignancies. Surgery, 2016. 159(3): p. 821-33.
8. Otsuji, H., et al., Preoperative sarcopenia negatively impacts
postoperative outcomes following major hepatectomy with extrahepatic bile duct resection. World J Surg, 2015. 39(6): p. 1494-500.
9. Cho, K.M., et al., Skeletal muscle depletion predicts survival of patients
with advanced biliary tract cancer undergoing palliative chemotherapy.
Oncotarget, 2017. 8(45): p. 79441-79452.
10. Dewys, W.D., et al., Prognostic effect of weight loss prior to
chemotherapy in cancer patients. Eastern Cooperative Oncology Group.
Am J Med, 1980. 69(4): p. 491-7.
11. Fearon, K.C., et al., Definition of cancer cachexia: effect of weight loss,
reduced food intake, and systemic inflammation on functional status and prognosis. Am J Clin Nutr, 2006. 83(6): p. 1345-50.
12. Yavuzsen, T., et al., Systematic review of the treatment of
cancer-associated anorexia and weight loss. J Clin Oncol, 2005. 23(33): p. 8500-11.
13. Argiles, J.M., et al., Cancer cachexia: understanding the molecular
basis. Nat Rev Cancer, 2014. 14(11): p. 754-62.
14. Kalinkovich, A. and G. Livshits, Sarcopenic obesity or obese
sarcopenia: A cross talk between age-associated adipose tissue and skeletal muscle inflammation as a main mechanism of the pathogenesis.
30
15. Fearon, K.C., Cancer cachexia: developing multimodal therapy for a
multidimensional problem. Eur J Cancer, 2008. 44(8): p. 1124-32.
16. Bosaeus, I., Nutritional support in multimodal therapy for cancer
cachexia. Support Care Cancer, 2008. 16(5): p. 447-51.
17. Kao, S.C., et al., High blood neutrophil-to-lymphocyte ratio is an
indicator of poor prognosis in malignant mesothelioma patients undergoing systemic therapy. Clin Cancer Res, 2010. 16(23): p.
5805-13.
18. Davis, J.L., et al., Elevated Blood Neutrophil-to-Lymphocyte Ratio: A
Readily Available Biomarker Associated with Death due to Disease in High Risk Nonmetastatic Melanoma. Ann Surg Oncol, 2017. 24(7): p.
1989-1996.
19. Cho, Y., et al., Prognostic Significance of Sarcopenia With
Inflammation in Patients With Head and Neck Cancer Who Underwent Definitive Chemoradiotherapy. Front Oncol, 2018. 8: p. 457.
20. Go, S.I., et al., Sarcopenia and inflammation are independent predictors
of survival in male patients newly diagnosed with small cell lung cancer.
Support Care Cancer, 2016. 24(5): p. 2075-2084.
21. Feliciano, E.M.C., et al., Association of Systemic Inflammation and
Sarcopenia With Survival in Nonmetastatic Colorectal Cancer: Results From the C SCANS Study. JAMA Oncol, 2017. 3(12): p. e172319.
22. Fearon, K., et al., Definition and classification of cancer cachexia: an
international consensus. Lancet Oncol, 2011. 12(5): p. 489-95.
23. Kaasa, S., et al., Symptom assessment in palliative care: a need for
international collaboration. J Clin Oncol, 2008. 26(23): p. 3867-73.
24. Evans, W.J., et al., Cachexia: a new definition. Clin Nutr, 2008. 27(6): p. 793-9.
25. Nishikawa, H., et al., Japan Society of Hepatology guidelines for
sarcopenia in liver disease (1st edition): Recommendation from the working group for creation of sarcopenia assessment criteria. Hepatol
Res, 2016. 46(10): p. 951-63.
26. McNamara, M.G., et al., Neutrophil/lymphocyte ratio as a prognostic
factor in biliary tract cancer. European Journal of Cancer, 2014. 50(9):
p. 1581-1589.
27. Park, H.S., et al., Prognostic Factors and Scoring Model for Survival in
Metastatic Biliary Tract Cancer. Cancer Research and Treatment, 2017. 49(4): p. 1127-1139.
28. Park, H.S., et al., Prognostic Factors and Scoring Model for Survival in
Metastatic Biliary Tract Cancer. Cancer Res Treat, 2017. 49(4): p.
1127-1139.
29. Stene, G.B., et al., Changes in skeletal muscle mass during palliative
chemotherapy in patients with advanced lung cancer. Acta Oncol, 2015. 54(3): p. 340-8.
31
30. Hayashi, T., et al., Impact of sarcopenia on long-term prognosis of
patients with esophageal cancer after surgery. Journal of Clinical
Oncology, 2014. 32(3).
31. Harimoto, N., et al., Sarcopenia as a predictor of prognosis in patients
following hepatectomy for hepatocellular carcinoma. British Journal of
Surgery, 2013. 100(11): p. 1523-1530.
32. Jung, H.W., et al., Effect of muscle mass on toxicity and survival in
patients with colon cancer undergoing adjuvant chemotherapy. Support
Care Cancer, 2015. 23(3): p. 687-94.
33. Yoon, S.B., et al., Impact of preoperative body compositions on survival
following resection of biliary tract cancer. J Cachexia Sarcopenia
Muscle, 2019.
34. Huang, Q.T., et al., Prognostic Significance of Neutrophil-to-Lymphocyte Ratio in Ovarian Cancer: A Systematic Review and Meta-Analysis of Observational Studies. Cell Physiol
Biochem, 2017. 41(6): p. 2411-2418.
35. Zhou, W.J., et al., [Effect of preoperative monocyte-lymphocyte ratio on
prognosis of patients with resectable esophagogastric junction cancer].
Zhonghua Zhong Liu Za Zhi, 2017. 39(3): p. 178-183.
36. Cummings, M., et al., Preoperative neutrophil:lymphocyte and
platelet:lymphocyte ratios predict endometrial cancer survival. Br J
Cancer, 2015. 113(2): p. 311-20.
37. Houghton, A.M., et al., Neutrophil elastase-mediated degradation of
IRS-1 accelerates lung tumor growth. Nat Med, 2010. 16(2): p. 219-23.
38. Wilson, T.J., et al., Cathepsin G-mediated enhanced TGF-beta
signaling promotes angiogenesis via upregulation of VEGF and MCP-1.
Cancer Lett, 2010. 288(2): p. 162-9.
39. Schmidt, H., et al., Elevated neutrophil and monocyte counts in
peripheral blood are associated with poor survival in patients with metastatic melanoma: a prognostic model. Br J Cancer, 2005. 93(3): p.
273-8.
40. Sr, W., et al., Neutrophil-lymphocyte ratio as a prognostic factor in
colorectal cancer. Journal of Surgical Oncology, 2005. 91(3): p.
181-184.
41. Grenader, T., et al., Derived neutrophil lymphocyte ratio is predictive of
survival from intermittent therapy in advanced colorectal cancer: a post hoc analysis of the MRC COIN study. British Journal of Cancer, 2016. 114(6): p. 612-615.
42. Lin, G.H., et al., Elevated neutrophil-to-lymphocyte ratio is an
independent poor prognostic factor in patients with intrahepatic cholangiocarcinoma. Oncotarget, 2016. 7(32): p. 50963-50971.
43. Kawahara, T., et al., Pretreatment neutrophil-to-lymphocyte ratio
32
Cancer, 2016. 16.
44. Hasegawa, S., et al., Pre-treatment neutrophil to lymphocyte ratio as a
predictive marker for pathological response to preoperative chemoradiotherapy in pancreatic cancer. Oncology Letters, 2016. 11(2): p. 1560-1566.
45. Kantola, T., et al., Stage-dependent alterations of the serum cytokine
pattern in colorectal carcinoma. Br J Cancer, 2012. 107(10): p.
1729-36.
46. Baracos, V.E., Regulation of skeletal-muscle-protein turnover in
cancer-associated cachexia. Nutrition, 2000. 16(10): p. 1015-8.
47. Dodson, S., et al., Muscle wasting in cancer cachexia: clinical
implications, diagnosis, and emerging treatment strategies. Annu Rev
Med, 2011. 62: p. 265-79.
48. van Kruijsdijk, R.C., E. van der Wall, and F.L. Visseren, Obesity and
cancer: the role of dysfunctional adipose tissue. Cancer Epidemiol
Biomarkers Prev, 2009. 18(10): p. 2569-78.
49. Huillard, O., et al., Sarcopenia and body mass index predict
sunitinib-induced early dose-limiting toxicities in renal cancer patients.
Br J Cancer, 2013. 108(5): p. 1034-41.
50. Antoun, S., et al., Low body mass index and sarcopenia associated with
dose-limiting toxicity of sorafenib in patients with renal cell carcinoma.
Ann Oncol, 2010. 21(8): p. 1594-8.
APPENDICES None
33
ABSTRACT(IN KOREAN)
진행된 담도암 환자에서 근소실이 예후에 미치는 영향
<지도교수 이 익 재>
연세대학교 대학원 의학과
이 병 민
목적: 근소실과 전신 염증수치가 암환자의 생존에 영향을
미치는 것이 밝혀짐에 따라 암환자에서 근소실 유무와 염증
수치가 주목을 받고 있다. 아직까지 타 장기 전이가 동반된
진행된 담도암 환자들에서 과연 근육 감소증과 전신 염증이
동반되어 있을 때에 어떻게 영향을 주는지에 대한 연구는 많이
되어 있지 않은 상태이다. 이러한 배경으로, 본 연구에서는
전신성 염증을 동반된 근육 감소증과 전이성 담도암 환자에서의
예후 관련성을 조사하고자 하였다.
대상 및 방법: 2007년부터 2016년까지 본 기관에서 전이성
담도암 환자를 진단 받은 353 명의 환자들을 분석하였다.
환자들의 골격근질량을 평가하기 위해서 컴퓨터 단층 촬영
이미지를 이용하여 3번째 요추 (L3)의 요근 상위 부위의
골격근질량을 측정하였다. 근육 감소증은 Japan Society of
Hepatology에서 제시한 기준으로 아래와 같이 정의하였다;
남성의 경우 골격근질량 < 42cm
2/m
2, 여성의 경우 < 38cm
2/m
2.
전신 염증 상태를 평가하기 위해서는 호중구 림프구 비율
(NLR)을 이용하였다. NLR > 3인 환자들이 염증 상태를 갖는
환자로 분류되었다. 환자들의 근육 감소증 및 전신 염증 상태에
따라 전체 생존율 및 무 진행 생존율을 비교 분석 하였다.
34
추가적으로 진행된 담도암 환자들의 첫번째 항암요법인
gemcitabine/cisplatin 항암치료 환자들 가운데 근육 감소증 및
전신 염증 상태에 따른 전체 생존율 및 무 진행 생존율도
비교하였다.
결과: 근육 감소증이 있는 환자와 없는 환자의 1년 전체
생존율을 비교하였을 때에 더 열등한 생존율을 보이는 것으로
나타났다 (25.5% vs 38.2%, p=0.019). 높은 NLR (NLR>3)인
환자가 낮은 NLR (NLR≤3) 환자보다 더 열등한 생존율을
보였고 이는 다른 연구들과 비슷한 결과를 보였다 (21.0% vs
52.8%, p<0.001). 이 결과를 바탕으로 환자를 세가지 그룹으로
분류를 하였습니다. 첫번째로는 높은 NLR과 근육 감소증을
동반한 환자, 두번째로는 낮은 NLR과 근육 감소증이 없는
환자였으며, 마지막으로는 높은 NLR 혹은 근육 감소증이 있는
환자는 두 요인 중에 하나 있는 환자 이렇게 세가지 그룹으로
나누었. 환자 세 가지의 그룹의 전체 생존율을 잘 계층화
되었고 이는 무 진행 생존율에서도 유의한 상태를 보였다 (전체
생존율 ; 18.3% vs 30.3% vs 55.8%, p<0.001, 무 진행 생존율 ;
7.8% vs 13.10% vs 27.9%, p<0.001).
결론: 결론적으로, 근육 감소증과 염증 상태가 공존하는 것이
열등한 전체 생존율과 무 진행 생존율과 현저한 연관이 있음을
발견하였다. 염증 상태가 동반 된 근육 감소증 환자가 예후가
좋지 않다는 결과에 근거하여, 보전적 치료는 전이성 담도암
환자에서 근육 감소증 및 염증 상태를 극복하는 데에 도움이 될
것 이다.
___________________________________________________________
핵심되는 말 : 담도암, 근육감소증, 염증, 생존율
35