이 학
박 사 학 위
논 문
Altered Decision Behavior of Dopamine
Receptor Knock-out Mice in a Free Binary
Choice Task
by
Shin Ae Kwak
Major in Neuroscience
Department of Biomedical Sciences
The Graduate School, Ajou University
Altered Decision Behavior of Dopamine
Receptor Knock-out Mice in a Free Binary
Choice Task
by
Shin Ae Kwak
A Dissertation Submitted to The Graduate
School of Ajou University in Partial Fulfillment
of The Requirements for Ph.D. in Neuroscience
Supervised by
Min Whan Jung, Ph.D.
Major in Neuroscience
Department of Biomedical Sciences
The Graduate School, Ajou University
Acknowledgements
I would like to express the deepest appreciation to my thesis supervisor Professor Dr. Min W. Jung and Professor Dr. Byung Gon Kim, you led me to improving the quality of my research thesis. I would also like to appreciate my committee members, chair Professor Dr. Eun Joo Baik, Professor Dr. Eun Young Kim, and Professor Dr. Pyung Lim Han for serving as my committee members despite your busy schedules. I also want to thank Dr. Nam Jung Huh for technical help in data modeling.
I would like to thank all of my senior and junior colleagues. I also want to thank you for coming to my doctoral defense. A special thanks to Su Hyun, Ji Hyun, Sue Hee and brothers, Jong Won and Jeong Wook.
I wish to extend special thanks to my beloved family. I have no word to express my gratitude to my mom, sister, and brother. I know your prayer for me was what sustained me thus far. In addition, thank my Cho rong for being during the 19 years and I was happy with you. And I would like to my special appreciation to my uncle, you have supported both physically and emotionally. I would also like to thank all of my long-time friends -Sunny, Hyun Ju, Ji Won, Se in, Shin hae- who supported my doctoral course and encouraged me to achieve my goal. My buddy, Ji Hye! Thank you so much for staying with me whenever having hard times.
At the end thanks God!
i – ABSTRACT –
Altered Decision Behavior of Dopamine Receptor Knock-out
Mice in a Free Binary Choice Task
Dopamine has been thought to play an important role in updating values according to reward prediction error by reinforcement learning theory, since the finding that phasic activity of midbrain dopamine neurons signals the difference between actual and predicted outcomes (reward prediction error). However, the extent and nature of dopamine roles in reward-based learning are still under debate. Specific roles of different dopamine receptor subtypes in this process are also unknown. To investigate roles of dopamine receptor subtypes in reward-based learning, I examined choice behavior of dopamine D1 and D2 receptor-knockout (D1R-KO and D2R-KO, respectively) mice in an instrumental learning task with progressively increasing reversal frequency and in a dynamic foraging task. Performance of D2R-KO mice was progressively impaired in an instrumental learning task as the frequency of reversal increased and profoundly impaired in a dynamic foraging task even with prolonged training, whereas D1R-KO mice showed only minor deficits in performance. Animals’ choice behavior in the dynamic foraging was better explained by hybrid model that included win-stay-lose-switch and reinforcement learning terms than by simple reinforcement learning alone. A hybrid model-based analysis revealed that D1R-KO mice showed the increased win-stay and uncertainty-based exploration, and D2R-KO mice also showed the increased win-stay, but at the same time, showed the impaired value updating and increased randomness in action selection which were detrimental to maximizing rewards in the dynamic foraging task. These results indicate that dopamine D2 receptors rather than D1 receptors are important in learning from past
ii
choice outcomes for optimizing choice strategy in a dynamic and uncertain environment.
Keyword: dopamine, D1 receptor, D2 receptor, mouse, value, reinforcement
iii
TABLE OF CONTENTS
ABSTRACT ··· ⅰ TABLE OF CONTENTS ··· ⅲ LIST OF FIGURES ··· ⅴ LIST OF TABLES ··· ⅵ I. INTRODUCTION ··· 1 A. Reinforcement Learning ··· 21. Dilemma of exploration and exploitation ··· 4
2. Q-learning model as a model-free method ··· 6
B. The dopaminergic system ··· 7
1. Features of the dopamine system ··· 7
2. Dopamine-mediating learning ··· 14
C. Aim of the thesis ··· 15
II. MATERIALS AND METHODS ··· 18
A. Genetic information of subjects ··· 18
B. Apparatus ··· 19
C. Behavioral task ··· 19
1. Reversal learning task ··· 21
2. TAB task ··· 21 D. Experimental groups ··· 24 E. Analysis ··· 27 1. Logistic regression ··· 27 2. Computational models ··· 28 3. Statistics ··· 31 III. RESULTS ··· 32 A. Behavioral performance ··· 32
iv
1. Reversal task ··· 32
2. TAB task ··· 35
B. Logistic regression analysis ··· 39
C. Modeling ··· 41
IV. DISCUSSION ··· 54
A. Motor deficits in both D1R- and D2R-KO mice ··· 54
B. Role of D2R in rapid adjustment of choice behavior ··· 55
C. Learning from RPE ··· 56
D. Value-dependent action selection ··· 57
E. Win-stay ··· 58
F. Uncertainty-driven exploration ··· 59
G. Multiple roles of dopamine in reward effects ··· 59
H. Model-free vs. Model-based RL ··· 60
I. Future directions ··· 61
V. CONCLUSION ··· 63
REFERENCES ··· 64
v
LIST OF FIGURES
Fig. 1. Behavioral task ··· 20
Fig. 2. Comparison of trial duration ··· 26
Fig. 3. Behavioral performance in reversal task ··· 34
Fig. 4. Behavioral performance in dynamic TAB task ··· 37
Fig. 5. Effects of past choices and rewards on the animal’s choice ··· 43
Fig. 6. Comparisons between trial duration and model parameters ··· 46
Fig. 7. Model parameters ··· 48
vi
LIST OF TABLES
Table 1. Task condition ··· 23 Table 2. Results of model comparison ··· 45
1
I. INTRODUCTION
People make various choices and prioritize goals in everyday life. To make an optimal decision, one goes through a series of complex processes that assign the value (i.e., the long-term desirability or a total amount of outcome an individual think to build up over the future, starting from a given situation; (Sutton and Barto, 1998) to the outcome (i.e., the immediate, intrinsic desirability from that situation; (Sutton and Barto, 1998) and compare each of value size among the possible actions. Animals also try to take the better option in their environment, although animals’ decision-making is not exactly same as those of human.
The primary goal of behavioral neuroscience is to see the principles in decision-making process of animals as well as human. To get this knowledge, researchers have investigated in various aspects (Niv and Montague, 2009). For several decades, the basic mechanism of decision-making has been explained by theoretical approaches called reinforcement learning. A substantial number of experimental studies, from non-primate animals to human, have proceeded in company with these theoretical researches. Large numbers of neuroscientist including psychologist and behavioral economists have reported common findings to support the dopamine hypothesis of reward learning that brain’s dopaminergic system is involved in reward-based processes (Niv et al., 2006), since Schultz and colleagues (1997) suggested that midbrain dopamine neurons convey the reward prediction error signal which is presumed to provide teaching signals in reinforcement learning models (Schultz et al., 1997; Hollerman and Schultz, 1998; Nakahara et al., 2004; Bayer and Glimcher, 2005; Rutledge et al., 2009). In other words, dopaminergic system and reinforcement learning are inseparably related with each other to understanding the mechanism of decision-making.
2
A. Reinforcement learning
Reinforcement learning (RL) is a subfield of artificial intelligence that studies how an agent (or learner; i.e., It can be specified as a decision-maker who could act out into and interact with its environment. Therefore this term included non-human resources such as a robot) can learn to make a decision in order to get better outcomes and avoid negative outcomes based on trial-and-error (Daw and Doya, 2006). The learning by trial-and-error originated with studies of animal learning in psychology. The first man to succinctly express its essentials was Edward Thorndike. According to him, any behavior that yields positive outputs has a tendency to be repeated, any behavior that yields negative outputs has a tendency to be abandoned (Thorndike, 1911). In other words, agent’s behavior can be modified by its consequences. Thorndike named this as the ‘Law of Effect’ because he focused the reinforcement effect that reinforced a specific action among various actions. Until now, the Law of Effect explains well the underlying process of choice behaviors in diverse situations (Campbell, 1960; Hilgard and Bower, 1975; Dennett, 1978; Cziko, 1995), even though it is sometimes disputable (Kimble, 1961, 1967; Mazur, 1994). Today, this term is used no more and is absorbed in the notion of reinforcement learning.
RL is started from the idea that an agent learns by interacting with the environment. When being placed on the environment at the first such as infancy, an agent obtained the information directly from its environment using sensorimotor connection because there is no teacher. The information gets detailed and enriched gradually as making effective use of this connection. Ultimately, an agent would get the information about the relation between cause and effect, about the consequences of actions, and further about what to do in order to attain a goal. This interaction would be happened continually. Thus RL system has a formal framework
3
as the following: it defined the mutual interaction between an agent and its environment described as states, actions, and rewards (Sutton and Barto, 1998).
reprinted, with permission, from REF.146 © 1998 The MIT Press
The agent taking action and the environment responding to agent’s action and proposing new situations to the agent.
Beyond the agent and the environment, it was also described as the following four major subcomponents: a policy, a reward function, a value function, and not necessarily, a model of the environment. 1) A policy denotes a course of actions at a given time. That is about what is how an agent respond to perceived states of the environment. 2) A reward function indicates the instantaneous desirability of that environmental state. 3) A value function is what is good from a long-term point of view, but a reward function is what is good for short term. Rewards are usually derived directly from its environment, and values, as a prediction of reward, must be assessed and reassessed consistently from the consequence of agent’s actions. The sole objective of estimating value on the candidate actions is to obtain more and better rewards. If there is no rewards, then no values. Nevertheless, action follows depending on the highest value because such action would bring out the maximum rewards over the long run. The notion of ‘value’ is the most important
4
factor for optimal control of learning problems in RL (Sutton and Barto, 1998). Fundamentally, value functions are obtained by two different information. The first source is, as mentioned earlier, a reward itself received after each action. If agent’s action always perfectly predicted its outcome, value functions would not change. Otherwise, value functions must be revised. Thus the reward prediction error (RPE) is used secondly to make value functions reduce errors in reward predictions (Lee et al., 2012). RPE is defined as the difference between the actual reward and expected reward from current value functions (Sutton and Barto, 1998). 4) A model as final factor is a kind of subjective knowledge to predict how the environment would react to agent’s action (Sutton and Barto, 1998). The agent can acquire new knowledge about its environment without practical experience (Tolman, 1948; Singer et al., 2006), then this will be used to estimating values. Such internal knowledge is considered as a ‘model’ and RL with knowledge is classified as a model-based RL in which knowledge is involved in the whole process as additional source for updating value functions. By comparison, RL without knowledge is a model-free RL that entirely relies on agent’s experience. It mean that RPE is the primary source of value functions in the model-free RL (Lee et al., 2012).
Any method that explained well how to solve the learning problems, it could be accepted as a RL method because Sutton and Barto clearly delineated that the RL is defined not by describing learning methods, but by describing learning problems. Therefore, modern RL algorithms span the spectrum from model-free methods to model-based methods (Sutton and Barto, 1998).
1. Dilemma of exploration and exploitation
In RL, balance between exploration and exploitation is one of the big issues because it seriously affects the agent’s learning performance. Too much exploration blocks the agent from maximizing short-term reward because exploratory actions are likely to produce negative result from its environment. Exploitative actions with
5
the uncertain knowledge on environment also block from maximizing long-term rewards because such actions may be left suboptimal (Tokic and Palm, 2011). In other words, the agent should prefer actions that found to be effective in producing rewards maximally based on the previous experience. However, to discover those actions, it is necessary to be tried actions that did not experienced before. The agent has to exploit what it already knows for the current reward, and has to explore also what it doesn’t know for the future reward. This problem is known as the dilemma of exploration and exploitation (Sometimes it is also called as exploration and exploitation trade-off). That implied neither exploration nor exploitation can be occupied exclusively. The agent must challenge various actions and take progressively actions that seem to be best. Which one is better between exploration and exploitation depends on the preciseness of estimated values, uncertainty of environment, and the number of remaining plays (It is impossible to describe as exploration or exploitation if there happens only single action selection) (Sutton and Barto, 1998).
Two methods were widely known for balancing between exploration and exploitation. Each of those is ‘ε-greedy’ rule and ‘softmax’ rule. If the agent maintains estimates of the action values, then there is at least one action which has the estimated maximum value. It is a greedy action that is believed to be best because it is estimated of having the greatest value. If the agent selects a greedy action, it is regarded as doing exploitation of current action values. If instead the agent selects one of the non-greedy actions, it is considered that the agent is exploring because this makes agent improve an estimate of non-greedy action value (Sutton and Barto, 1998). In the ε-greedy rule, the probability of action-selection is fixed at each step (Tokic and Palm, 2011) and it is as likely to choose what appears to be worst as to choose what appears to be next-best (Sutton and Barto, 1998). This problem can be solved by softmax rule in which the decision to explore and to choose suboptimal action is set stochastically on the basis of the relative action
6
values expected (Daw et al., 2006). Sutton and Barto described that both methods have advantages and disadvantages. In practice, it seems like that the softmax rule provides a better fit to behavior (Barraclough et al., 2004; McCoy and Platt, 2005; Samejima et al., 2005), although both strategies were reported as the measures for action-selection in the literature (Ishii et al., 2002; Schweighofer and Doya, 2003; Daw et al., 2006; Doya, 2008).
2. Q-learning model as a model-free RL method
In the RL, candidate actions are determined through predictions of their values, the total amount of reward expected to bring about. But such predictions are in computational trouble when reward comes from a series of actions and early chosen action cause delayed rewards. To settle this matter, approximations are necessary. There are two classes in RL, which make different approximations and so are differentially accurate in particular environment (Daw et al., 2005). One is ‘model-free’ RL methods such as Q-learning and the other is ‘model-based’ RL methods (Sutton and Barto, 1998).
The development of Q-learning algorithm is assessed as one of the most important breakthrough in the RL (Watkins, 1989). Its central principle is the learning by action-value function. One of the great merits of Q-learning is that it can compare the availability among potential actions quantitatively. I will introduce the Rescorla-Wagner rule as the simplest form of Q-learning here. This model stood on two core assumptions as follows: 1) Learning happens only in case of non-predictive episode (Niv and Montague, 2009). It means the event which is associated with a perfect prediction of outcome cannot be learned (Schultz, 2002). 2) Predictions are added up together to develop the total prediction in the trial. These assumptions made this model explain various phenomena of learning (Niv and Montague, 2009).
7
Qa(t), action-value function about action ‘a’ in the t-th trial; α, learning constant; r(t)-Qa(t), error term in reward prediction; r, reward earned in the t-th trial
reprinted, with permission, from REF.146 © 1998 The MIT Press
This numerical value initialized arbitrarily and derived from the strength of the behavioral response on rewards (Schultz, 2002).
B. The dopaminergic system
1. Features of the dopamine system
Dopamine, as a neurotransmitter and neurohormone, gets involved in a wide variety of physiological functions in the brain as well as in the neuroendocrine system (Kobayashi et al., 2004). Dopamine is synthesized by mesencephalic neurons in the substantia nigra (SN) and ventral tegmental area (VTA) (Baik, 2013). Dopaminergic neuronal pathways which originate from mesencephalic nuclei project to the striatum, cortex, limbic system and hypothalamus (Alexander and Crutcher, 1990; Graybiel, 1990; Baik et al., 1995). The dopamine signaling is mediated by five distinct receptors, which have been categorized into two classes based on the type of G-protein they coupled: the D1-like and D2-like receptors. The D1-like family comprises the D1 and D5 receptors, stimulating Gs and Golf proteins,
8
whereas D2, D3, and D4 receptors stimulating Go and Gi proteins form the D2-like
family (Neve et al., 2004). The D1 and D2 receptors are expressed the most abundantly among dopamine receptors, while the other subtypes are very restricted in their location and much fewer expressed than the former (Surmeier et al., 1996; Kobayashi et al., 2004). Regulation of the dopaminergic system has drawn keen attention because the dysfunction of this system are related with the multiple neuropsychiatric disorders including social phobia (Schneier et al., 2000), Tourette’s syndrome (Kienast and Heinz, 2006), Parkinson disorder (Fuxe et al., 2006), schizophrenia (Kienast and Heinz, 2006), ADHD (Schoots and Van Tol, 2003; Gornick et al., 2007; Li et al., 2014) and drug addiction (Hummel and Unterwald, 2002; Kienast and Heinz, 2006; Baik, 2013).
The nigrostriatal pathway
The basal ganglia (BG), consisting of several subcortical nuclei, is an important center of multiple anatomical loops, connecting a wide range of cortical and subcortical structures (Alexander et al., 1986; Bornstein and Daw, 2011). Indeed BG dysfunctions are associated with a range of debilitating clinical conditions (as above-mentioned) whose most obvious manifestations are motor deficit. Many of these disorders also accompany cognitive and affective components. This multidimensional view is consistent with anatomical evidence that the BG are connected to functionally heterogeneous regions of the cerebral cortex (McHaffie et al., 2005). In particular, the striatum because of the main input structure of the BG is considered as a dynamic behavioral controller, integrating sensorimotor and motivational information to generate effectual and diverse behavioral polices in RL models. So, perhaps more than any other brain areas, numerous studies have been concentrated on the striatum (Bornstein and Daw, 2011). The striatum, the largest nucleus of the BG, consisted of the caudate nucleus, putamen (CP) and ventral striatum, including the nucleus accumbens (NAc) (Gerfen and Surmeier, 2011). The main feature of the striatum is its dense dopamine innervation (Bolam et al., 2000).
9
One of the major targets of dopamine innervation is the predominant neuron in the striatum (Gerfen and Surmeier, 2011). The medium-sized spiny neurons (MSNs) make up over 90% of the striatum, which release the inhibitory neurotransmitter GABA (Perreault et al., 2011). Striatal information is relayed via at least two distinct neuronal pathways to reach the thalamus and other targets (Gerfen and Wilson, 1996; Missale et al., 1998). One is the MSNs of the striatonigral pathway, also known as the direct pathway. These neurons monosynaptically project to the nuclei located between the BG and the rest of the brain (i.e., substantia nigra pars reticulata (SNr) and internal segment of the globus pallidus (GPi; analogous to rodent entopeduncular nucleus, EPN (Gerfen, 1992; Gerfen and Wilson, 1996; Gerfen and Surmeier, 2011) and have a disinhibitory effect which encourages the behavioral response (Perreault et al., 2011). The other is the MSNs of the striatopallidal indirect pathway projecting to an intermediate nucleus of BG (i.e., external segment of the globus pallidus (GPe; analogous to rodent globus pallidus, GP). These MSNs are connected only indirectly to the output nuclei of BG (i.e., EPN and SNr) through GPe (Gerfen and Wilson, 1996; Gerfen and Surmeier, 2011) and have an inhibitory effect which suppresses behavioral response (Perreault et al., 2011). The information from these two pathways is integrated at the SNr and dynamically regulates the balance of the basal ganglia-thalamocortical circuitry (Graybiel, 2000; Deniau et al., 2007). Another feature of the striatum is its subtype-specific expression of dopamine receptors. The D1 receptors (D1Rs) is expressed predominantly in the MSNs of direct pathway, whereas the D2 receptors (D2Rs) is expressed in the MSNs of indirect pathway (Gerfen et al., 1990; Surmeier et al., 1996). The striatonigral (or direct pathway) neurons also coexpressed high levels of neuropeptides substance P (SP) and dynorphin (DYN) with D1R, whereas the striatopallidal (or indirect pathway) neurons coexpressed neuropeptide encephalin (ENK) with D2R (Graybiel, 2000). A study in 1986 (Young et al., 1986) reported that after 6-hydroxydopamine (6-OHDA) -induced lesion, which destroy
10
dopaminergic and noradrenergic neurons in the mesencephalon, striatal ENK levels increased and substance P levels dropped. It is consistent with the current view that dopamine is differentially involved in these two neural populations (Gerfen and Surmeier, 2011).
reprinted from REF.116 © 2011 Frontiers in Neuroanatomy doi: 10.3389/fnana.2011.00031
The above diagram indicates the classical BG circuitry by receptor-specific pattern. The major projections of D1R-only striatonigral and D2R-only striatopallidal
11
neurons are depicted. Abbreviations for the figure: NAc, nucleus accumbens; CP, caudate putamen; VP, ventral pallidum; GP, globus pallidus; EPN, entopeduncular nucleus; STN, subthalamic nucleus; SNr, substantia nigra reticulata; SNc, substantia nigra compacta; VTA, ventral tegmental area.
The mesocortical pathway and the mesolimbic pathway
Mesencephalic dopamine neurons also innervate multiple cortical areas including the frontal cortex and cingulate cortex as well as limbic structures including the hippocampus (HIP), amygdala (AMY) and nucleus accumbens (NAc; or VS, ventral striatum). The former is known as mesocortical pathway and involved in cognitive control (Malenka et al., 2009). The latter is called the mesolimbic pathway known as major components of motivation and reward system (Zhang et al., 2006). In the mesocortical circuit, it has been reported that the prefrontal (PFC) dopamine, in particular by D1Rs, is adjusted according to an inverted-U function that too much or too little dopamine level (or D1Rs activation) can adversely affect cognitive performance. In the PFC of rodent and monkey, the number of both D1R mRNA and D1R binding sites are significantly higher than the other subtypes of dopamine receptor. A substantial amount of evidence indicated that D1Rs contribute to different varieties of cognitive processes than D2Rs. Therefore, the core to understand the PFC dopamine may be how a balance of dopamine through D1Rs is achieved optimally across a variety of learning situations (Seamans and Robbins, 2010). In the mesolimbic circuit, its malfunction is mainly related to addiction (Robison and Nestler, 2011; Blum et al., 2012). This system’s major component is the GABAergic MSNs of the NAc that process and integrate information from the three primary areas (i.e., PFC, HIP, VTA). D1Rs and D2Rs are highly expressed and coexpressed with different peptides in the NAc as well as in the dorsal striatum (DS) (Zhang et al., 2006). MSNs coexpressing D1R and SP
12
are mostly concentrated in the shell, while MSNs coexpressing D2R and ENK are located in the core of NAc (Lu et al., 1998).
These connections are parallel but partial overlapped functionally as well as physically (Fallon and Moore, 1978).
reprinted from REF.61 © 2012 Frontiers in Behavioral Neuroscience doi: 10.3389/fnbeh.2012.00050
The above diagram illustrates the connectivity of brain structures involved in the voluntary control of behavior in rodent. Four regions of the striatum are indicated by label and color; the color gradient approximates the gradient of afferent projections (Voorn et al., 2004). Corresponding color in the other structures
13
represents general projection topography. Tapered arrows indicate highly convergent input. Output of the striatum: a “direct” pathway was marked as (+), and an “indirect” pathway was expressed as (−). Projections from dopamine neurons in the VTA and SNc are shown in red.
Abbreviations for the table: The table indicates some characteristic features of dissociated behavioral control systems, with color indicating corresponding brain structures: stimulus (S), context (C), affective outcome (Oa), response (R), specific outcome (O).
Abbreviations for the main figure: DLS, dorsolateral striatum; DMS, dorsomedial striatum; VSc, core of the nucleus accumbens in ventral striatum; VSs, shell of the nucleus accumbens in ventral striatum; VTA, ventral tegmental area; SNc, substantia nigra pars compacta, SNr, substantia nigra pars reticulata, P, pallidum; STN, subthalamic nucleus; dH, dorsal hippocampus; vH, ventral hippocampus; ENT, entorhinal cortex; BLA, basolateral nucleus of the amygdala; CN, central nucleus of the amygdala. The following regions of neocortex are labeled: IL, infralimbic; PL, prelimbic; OF, orbitofrontal; CG, cingulate, PP, parietal; SMA, sensorimotor.
(Gruber and McDonald, 2012)
Excluding the abovementioned circuits, there remains a number of (sub)circuits in the cortico-striatal-thalamus axis such as feedback striatal circuit or thalamostriatal circuit (Gerfen and Surmeier, 2011).
14
2. Dopamine-mediated learning
Studies of dopamine-mediated learning, after the findings of Schultz and colleagues (1997) that phasic activity (with short-latency around 50~110ms and short-duration under 200ms) of the midbrain dopamine neurons encode the RPE signal, have concentrated on the learning from the RPE (Enomoto et al., 2011; Cohen et al., 2012; Steinberg et al., 2013). The interest of these studies is which brain area compute the RPE or happen value learning. The brain has multiple control system to find optimal action.Numerous studies reported that diverse areas including striatum and cortex as well as midbrain were involved in value coding such as RPE (Watanabe, 1996; Platt and Glimcher, 1999; Matsumoto et al., 2003; O'Doherty et al., 2004; Tanaka et al., 2004; Bayer and Glimcher, 2005; Daw et al., 2005; Daw et al., 2006; Rangel et al., 2008; Glascher et al., 2010; Oyama et al., 2010; Dickerson et al., 2011; Hart et al., 2014). But striatum seems to be still at the center of value learning because reward-predictive neural activities of such areas were influenced by dopamine-dependent plasticity in the striatum (Reynolds and Wickens, 2002). In line with the above issue, it has been investigated whether dopamine is related to the positive learning (i.e., to pursue the rewarded action) or including also negative learning (i.e., to avoid the punishment or non-rewarded action). Considerable evidence, including original research, showed that the phasic burst firing of dopamine neurons is observed during positive outcomes that lead to the pursuit of rewarding behaviors, while dopamine neurons suppressed by negative outcomes that lead to the avoidance of non-rewarding behaviors. These results suggest that dopamine is related to the learning from both positive and negative RPE (Schultz et al., 1997; Schultz, 2002; Satoh et al., 2003; Frank et al., 2004; Shohamy et al., 2004; Ungless et al., 2004; Klein et al., 2007; Frank et al., 2009; Matsumoto and Hikosaka, 2009; Wang and Tsien, 2011; Danjo et al., 2014; Hart et al., 2014). Nevertheless, this issue is still disputable. Recent findings suggest that positive outcomes and negative outcomes are processed independently as distinct
15
category (Fiorillo, 2013). Some researches did not find evidence that dopamine neurons encode negative RPE signal (Bayer and Glimcher, 2005), although it partially attributed to weak inhibitory prediction signal of these neurons by their low spontaneous firing rate (Schultz et al., 1997; Satoh et al., 2003).
In another view, massive studies have concentrated to explain how brain process the value information. This is related to the theoretical approaches (i.e., model-free or model-based RL controller). Behavioral and lesion studies suggest these controller can operate independently, but underlying neural substrates are clearly intertwined (e.g, prefrontal cortex is dopaminergic innervated itself). Therefore, the degree and extent of competition or interaction between free and model-based control are dependent on task demands and accuracy of value prediction (Daw et al., 2005).
C. Aim of the thesis
A large progress has been made over the last two decades in understanding roles of dopamine in reward-related processing. In particular, the finding that midbrain dopamine neurons signal the difference between actual and predicted rewards (RPE (Schultz et al., 1997; Roesch et al., 2007; Cohen et al., 2012) and subsequent studies employing the RL theory strongly suggest the role of dopamine in updating values according to RPE as postulated by the RL theory (Daw and Doya, 2006; Dayan and Niv, 2008; Kable and Glimcher, 2009; Niv and Montague, 2009; Lee et al., 2012). This line of research emphasizes an essential role of dopamine in learning to choose optimally for maximizing rewards.
However, dopamine-deficient animals can learn to choose more rewarding targets (Berridge, 2007) and some dopamine neurons signal stimulus salience rather than RPE (Brischoux et al., 2009; Matsumoto and Hikosaka, 2009; Wang and Tsien, 2011). Moreover, a recent study (Flagel et al., 2011) has suggested dopamine
16
involvement in stimulus-reward, but not response-reward association. These results suggest that the primary role of dopamine might be in forming incentive salience (It is affected by both rewarding and aversive experiences and considered as motivational salience (Bromberg-Martin et al., 2010)rather than learning to choose more rewarding targets. In addition, dopamine involvement in another aspect of RL, namely controlling exploration-exploitation trade-off (Frank et al., 2009; Beeler et al., 2010; Humphries et al., 2012), has been proposed. As such, the extent and nature of dopamine roles in RL are not still unraveled.
Given that the core concept of RL is to discover optimal choice strategy in a dynamic and uncertain environment (Sutton and Barto, 1998), it would be desirable to employ a behavioral task that emulates dynamicity and uncertainty in action-reward contingency in investigating the role of dopamine in RL. However, unlike in human studies (Frank et al., 2004; Pessiglione et al., 2006; Frank et al., 2007a; Klein et al., 2007; Frank et al., 2009; Rutledge et al., 2009), animal studies seldom investigated effects of dopamine manipulation in a dynamic and uncertain environment, which undermines an important strength of using animal over human studies (i.e., comprehensive and complete manipulation of dopamine). I hypothesized that dopamine might be necessary for learning to make an optimal choice in a dynamic and uncertain environment, but not in a static environment from inconsistent findings on dopamine role in reward-based process. To address this, I aimed to manipulate stability and certainty of action-reward contingency in the present study. Next, I took note of the effect of manipulating dopamine receptor subtypes rather than dopamine per se and investigated choice behavior of dopamine D1 and D2 receptor knock-out (D1R-KO and D2R-KO, respectively) mice. D1 and D2 receptors are major subtypes among five subtypes of dopamine receptors and their anatomical distributions and functional roles are quite different (Hurley and Jenner, 2006; Kreitzer and Malenka, 2008; Kravitz et al., 2012). These features call for distinct manipulations of D1R and D2R to understand better the extent of
17
dopamine functions. For these reasons, I examined choice behavior of D1R-KO and D2R-KO mice while manipulating stability and certainty of action-reward contingency using two types of behavioral task.
18
II. MATERIALS AND METHODS
A. Genetic information of subjects
D1R-KO and D2R-KO mice were described previously (Drago et al., 1994; Kelly et al., 1997) and were purchased from JAX lab (Bar Harbor, Maine, USA). They were bred to C57BL/6J mice for more than 10 generations in our lab. All D2R -/- mice and their wild type (WT) were obtained by crossing D2R +/- and D2R +/-, and had C57BL/6J genetic background. Few D1R -/- mice with C57BL/6J genetic background survived to adult stage. To overcome this problem, D1R +/- were backcrossed with 129S1/SvImJ and their F1 progenies were crossed with 129S1/SvImJ again. Crossing D1R +/- and D1R +/- of F2 progenies gave rise to D1R -/- mice, which were, together with WT littermates as control, used in this study. Therefore, all D1R -/- mice and their WT control had C57BL/6J-129S1/SvImJ hybrid genetic background. For genotype analysis, the following primer sets were used: 5‘-AAA GTT CCT TTA AGA TGT CCT-3‘ and 5‘-TGG TGG
CTG GAA AAC ATC AGA-3‘ for D1R (350 bp); 5‘-TGT GAC TGC AAC ATC
CCA CC-3‘ and GCG GAA CTC AAT GTT GAA GG-3‘ for D2R (105 bp);
5‘-CTT GGG TGG AGA GGC TAT TC-3‘ and 5‘-AGG TGA GAT GAC AGG AGA
TC-3‘ for the KO state (neo; 280 bp) in both of KO cases. The experimental protocol was approved by the Institutional Animal Care and Use Committees of Ajou University School of Medicine, Ewha Womans University, and Korea Advanced Institute of Science and Technology.
19
B. Apparatus
All animals were trained on a modified T-maze (Fig. 1) that was made of black acrylic (overall dimension, 55ⅹ30 cm; width of track: 6 cm with 10 cm high walls along the whole track). It was elevated 80 cm from the floor and covered with a transparent acrylic lid for blocking out an escape of mice from the maze. Water (10~15 ㎕ by managed opening time of solenoid valve; same amount for a given animal) was delivered by briefly opening a customized solenoid valve at the upper left and upper right corners. The maze contained five sliding doors to guide movement direction and to impose delay on the central stem for some animals (delay-imposed WT animals; see below). Navigation of the animal was monitored by three sets of photobeam sensors that signaled the animal’s arrival at the goals and return to the start arm. Monitoring of the animal behavior, door operating and water delivery were automatically controlled by a personal computer using LabView software (National Instrument, TX, USA).
C. Behavioral tasks
The animals were tested in a progressive reversal learning task and a dynamic two-armed bandit (TAB) task. In both tasks, when starting the session, they were placed on the entry point of the central stem of the maze and asked to choose freely between two goal sites (left/right) that delivered water as a reward. They were allowed to come back to the central stem via the lateral alleys. Five sliding doors were opened or closed depending on the time checked by each three pairs of photobeam sensor to guide navigation of the animals (Fig. 1).
20
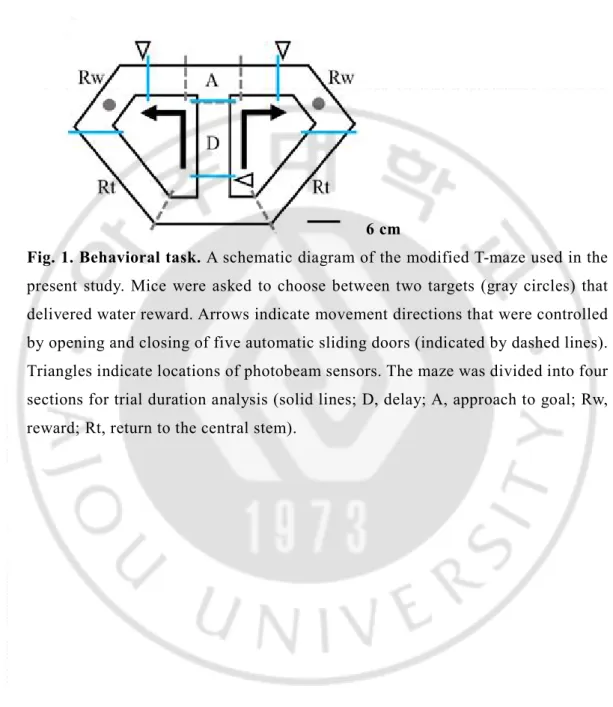
6 cm
Fig. 1. Behavioral task. A schematic diagram of the modified T-maze used in the present study. Mice were asked to choose between two targets (gray circles) that delivered water reward. Arrows indicate movement directions that were controlled by opening and closing of five automatic sliding doors (indicated by dashed lines). Triangles indicate locations of photobeam sensors. The maze was divided into four sections for trial duration analysis (solid lines; D, delay; A, approach to goal; Rw, reward; Rt, return to the central stem).
21
1. Reversal learning task
One goal delivered water with 100% probability and the other with 0%. Locations of the correct and incorrect goals were reversed initially across sessions, and then within a session. For this, the animals went through total five stages of testing as follows (Table 1-1):
stage 1, training without reversal (the location of correct goal was counterbalanced across animals; 45-60 daily trials), for 3 days; stage 2, reversal of target location at the beginning of the first session and training without further reversal, for 4 days (60 daily trials); stage 3, reversal of target location at the beginning of each session, for 4 days (60 daily trials); stage 4, one episode of target location reversal in the middle of each session, for 4 days (60 daily trials with reversal at the 31th trial);
stage 5, two episodes of target location reversal in the middle of each session, for 4 days (90 daily trials with reversal at the 31th and 61th trial). For stages 4 and 5, the
initial location of the correct target was randomly determined for each session except on the first day (reversal of target location from the previous day).
2. TAB task
Two goals delivered water with different probabilities in the dynamic TAB task (Kim et al., 2009; Sul et al., 2010). Reward probability of a goal was consistent within a block of trials and then it was changed across blocks without any sensory cues. Therefore the mice had to figure out changes in the relative reward probabilities based on trial-and-error. The number of trials in each block was between 35 and 55 (In the case of D2R-KO, they had more trials within a block than other animal groups because they took more trials to detect changes of probability). The order of block reward probabilities in a given session was determined randomly with the limitation that the target arm with the higher reward probability always was changed at the beginning of a new block. All animal groups went through at
22
least three stages of training (stages 1-3) that employed different arming probabilities as follows (Table 1-2):
stage 1, two blocks, 0.84 vs. 0.12; stage 2, three blocks, 0.84 vs. 0.14; stage 3, three blocks, 0.80 vs. 0.16.
D2R animal groups went through two additional staged of training (stages 4-5) with arming probabilities as follows (Table 1-2):
stage 4, three blocks, 0.72 vs. 0.24; stage 5, four blocks, 0.72 vs. 0.12 and 0.63 vs. 0.21.
This was to test whether poor performance of D2R-KO animals (see below) could be overcome by prolonged training. The animals were trained for 10 days in stages 1-4, and for 60 days in stage 5. However, D2R-KO animals were further trained for 10 additional days in each of stages 1-4 (total 20 days of training in each stage until stage 4). I emphasized again, this was to check whether prolonged training can make an enhanced performance of D2R-KO mice.
All animals initially went through 2-3 days of acclimation of the maze and a shaping period. Of all the animals tested in both tasks, the sequence of the tasks was counterbalanced across the animals (18 and 13 were tested first in the reversal and dynamic foraging task, respectively), and there was a two weeks’ interval (in this period animals were spent in their home cages) at least between the two phases of training to minimize interfering effect between the different two types of task.
23 Table 1. Task condition.
1-1. Reversal task
24
D. Experimental groups
D1R-KO and D2R-KO mice were compared with their respective WT littermates (C57BL/6J-129S1/SvImJ and C57BL/6J, respectively). I imposed few seconds delay on the end of central stem for separate groups of WT littermates to match their trial durations to those of knock-out mice because D1R-KO and D2R-KO mice were slower as sessions go on in performing the behavioral tasks. As a consequence, there were three experimental groups [WT, WT with delay (dWT) and KO] for each receptor subtype. A fixed length of delay (the difference in mean trial duration between D2R-KO and D2R-WT; 15 sec in the reversal task and 10 sec in the TAB task) was imposed to D2R-dWT mice, which resulted in longer mean trial durations for D2R-dWT than D2R-KO mice overall by their hesitating responses because it might be a long enough time to make dWT mice distract attention somewhere or something. For D1R-dWT mice, to avoid this problem, delay durations were adjusted in blocks of 10 trials based on mean delay durations of D1R-KO and D1R-dWT mice up to that time point so that the final mean delay duration was similar between the two animal groups for a given training stage (Fig. 2A). I divided the maze into four sections (delay, approach, reward and return; Fig. 1) to quantify durations and measured time the animals spent in each section during the TAB task to compare response patterns of the KO and dWT mice. For this, for each of D1R-KO, D1R-dWT, D2R-KO and D2R-dWT animal groups, 1000 trials (considering a given significance level and margin of error (Lohr, 1999)) were evenly divided to each animal and each training day of stages 1-3, and then the resulting number of trials for a given animal for a given training day was randomly selected for analysis. D1R-WT mice spent less time at the reward site and in coming back from a target arm to the central stem than D1R-KO, as expected D2R-WT mice also spent less time at the reward site, but were slower in coming back from a target arm to the central stem than KO mice (Fig. 2B). This might be because
D2R-25
dWT mice were trapped in the central stem (section ‘D’ in Fig. 1) for 15 sec or 10 sec in each trial (they might be reluctant to enter the central stem), whereas the duration of delay was variable across blocks of 10 trials for D1R-dWT mice. Other than these differences between KO and dWT mice, I couldn’t identify unusual behavior of KO mice on the maze.
Note that different trial durations of D2R-KO and D2R-dWT mice did not affect the conclusions because D2R-KO mice showed the impairment of performance relative to D2R-dWT mice which had longer, rather than shorter, trial durations. Also, similar results were obtained when the animal’s performance was analyzed with a logistic regression analysis that took trial-by-trial variations in trial duration into account, and when model-based analysis was performed after matching trial durations between D2R-KO and D2R-dWT mice group by excluding some behavioral sessions (see below). Of a total 48 animals, the majority (n=31, 64.6%) were tested in both behavioral tasks, seven (14.6%) were tested only in the reversal task, and ten (20.8%) were tested only in the TAB task. Nine WT, six D1R-dWT, four D1R-KO, five D2R-WT, five D2R-dWT and nine D2R-KO mice were tested in the reversal task, and nine D1R-WT, six D1R-dWT, three D1R-KO, nine D2R-WT, five D2R-dWT, nine D2R-KO mice were tested in the dynamic TAB task.
26
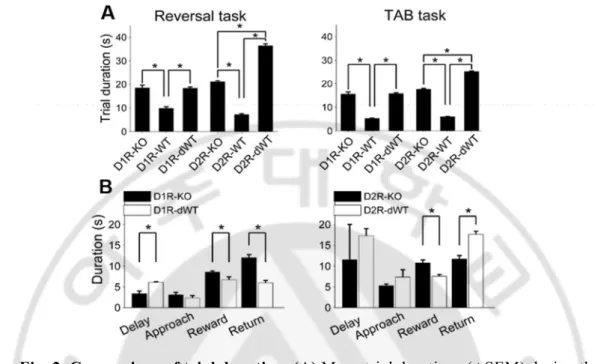
Fig. 2. Comparison of trial duration. (A) Mean trial durations (±SEM) during the reversal learning task and TAB task are shown for each experimental group. There were three experimental groups for each receptor subtype [KO, WT and WT with delay (dWT)]. Delay was imposed to dWT animals on the end of the central stem in order to match their trial durations to those of KO mice (reversal task, p=0.913, TAB task, p=0.767; one-way ANOVA followed by Bonferroni post-hoc tests) but significantly longer for D2R-dWT than D2R-KO mice (reversal task, p=2.3ⅹ10-45,
TAB task, p=1.4ⅹ10-48). Asterisks, significant differences (p <0.05). Six D2R-WT
and four D2R-KO mice were excluded from calculating trial durations in the TAB task because trial durations were not measured for them. (B) Mean durations of the delay, approach, reward and return sections are shown for D1R-KO, D1R-dWT, D2R-KO and D2R-dWT mice for the TAB task. Asterisks, significant differences (t-test, p < 0.05).
27
E. Analysis
1. Logistic regression
Two different logistic regression analyses were used. The first logistic analysis was to examine effects of D1R-KO and D2R-KO on the animal’s performance controlling for trial-by-trial variations in trial duration. For this, it was related the animal’s choice with the animal type (KO vs. WT) and trial duration as the following:
log
( )( )
=
+
( ) +
,
where
( ) (
( ))
is the probability of selecting the direction with a higher (or lower) reward probability in the i-th trial, and is a dummy variable representing the animal type (KO vs. WT) and( )
is the trial duration in the i-th trial.The second regression analysis was to examine how the animal’s choices and their outcomes in the past 10 trials influenced the animal’s choice in the current trial in the Tab task. For this, the following logistic regression analysis was performed (Lau and Glimcher, 2005; Huh et al., 2009; Kim et al., 2009):
log
( )
( )
=
( − ) −
( − )
+
( − ) −
( − ) +
where
( ) (
( ))
is the probability of selecting the left (or right) goal in thei-th trial. The variables
( ) (
( ))
and( )
( )
are reward delivery at the left (or right) goal site (0 or 1) and the left (or right) goal choice (028
or 1) in the i-th trial, respectively. The coefficients and denote the effect of past rewards and choices, respectively, and is a bias term.
The regression model was applied separately for each animal using the entire choice data during the TAB task (D1R-group, stages 1-3; D2R-group, stages 1-5).
2. Computational models
In order to obtain insights on psychological and neural processes underlying the animal’s choice behavior, it was tested how well different models can account for the animal’s choice behavior during the TAB task. The full model (here it will be called hybrid model) contained a simple RL, win-stay-lose-switch, and uncertainty-based exploration terms along with choice bias, and one or more of these terms were left out in reduced models. In the hybrid model, win-stay-lose-switch and uncertainty-based exploration terms for the chosen action ‘a’ and unchosen action ‘b’ (left or right goal choice) were determined as the following:
( ) =
( ) +
( ) +
( ) ,
( ) =
( ) +
( ) +
( ) ,
where
( )
and( )
are win-stay (WS) and lose-switch (LS) terms, respectively [( ) =
and( ) = 0
if rewarded in the previous trialand
( ) = 0
and( ) =
otherwise ], and( )
and( )
determineuncertainty-based exploration in the i-th trial. Contributions of the factors for the uncertainty-based exploration were quantified by the free parameters ρ and ε
which calculated from maximum-likelihood estimation (MLE, it selects the value set of model parameters that maximize the likelihood function).
29
( )
is the mean reward value computed from the reward structure experienced in the past trials and( )
is the standard deviation (SD) of the distribution of the estimated reward structure. For the estimation of the mean expected values from the experienced reward history, there was used the Kalman filter. It is an algorithm that produces a series of estimated current variables along with their uncertainties over time, including random variations (called as noise), for the estimation of unknown variables more precisely (Kruschke, 2008; Frank et al., 2009).( )
was assumed to follow the normal distribution( ,
)
. The values( )
and( ) were updated for the chosen action ‘a’ as the following:
( + 1) =
( ) +
( ){ ( ) −
( )},
( ) =
( )
( ) +
( )
,
where
( ) is the Kalman gain and
( ) is the SD of the actual
rewards in the present trial taken by the mice.
( ) was computed as the
following:
( + 1) =
( ){1 −
( )}
For the unchosen action ‘b’, the valued
( )
and( )
were unchanged.For the RL term, a Q-learning model (Sutton and Barto, 1998) was used. All action values were updated according to the RPE in each trial as the following:
if choice = left,
= ( ) −
( ) ,
( + 1) =
( ) + ∙
,
( + 1) =
( ) ,
30
if choice = right,
= ( ) −
( ) ,
( + 1) =
( ) + ∙
,
( + 1) =
( ) ,
where α is the learning rate,
( ) and
( )
are action values for leftward
and rightward choices, respectively, and
( ) is the reward in the i-th trial
(1 if rewarded and 0 otherwise).
The learning rate
was different depending on the profile of RPE as the
following:
=
if RPE > 0, and
=
otherwise.
Choices were made using the softmax action selection rules in which vary
the action probabilities as ranked and weighted by their estimated value
(Sutton and Barto, 1998) as the following:
( ) =
1
1 +
−
( ) −
( ) −
( ) −
( )
,
where
( )
is the probability for selecting the left goal in and β is the inverse temperature that determines the degree of randomness in action selection. Model parameters were estimated separately for each animal based on the entire choice data (D1R-group, stages 1-3; D2R-group, stages 1-5) using fminsearch function of MATLAB (Mathwork Inc.).31
3. Statistics
Two-way repeated measure ANOVA was applied separately to the behavioral data obtained from D1R and D2R animal groups to examine effects of experimental groups (KO, WT and dWT) and training days on the animal’s behavioral performance. For the stable phases of the TAB task (excluding stage 1 because stage 1 is regarded as learning state of task), behavioral performance data were collapsed across stages 2-3 (D1R and D2R animal groups) and stages 4-5 (only D2R animal groups) and analyzed with one-way ANOVA for comparison within each receptor group. ANOVA was followed by Bonferroni post-hoc tests (SPSS 20). Model parameters of KO and dWT animal groups were compared with Wilcoxon rank-sum tests function (two-tailed) of MATLAB. A p-value < 0.05 was used as a criterion for significant difference. The data are shown as mean±SEM.
32
III. RESULTS
A. Behavioral performance
1. Reversal task
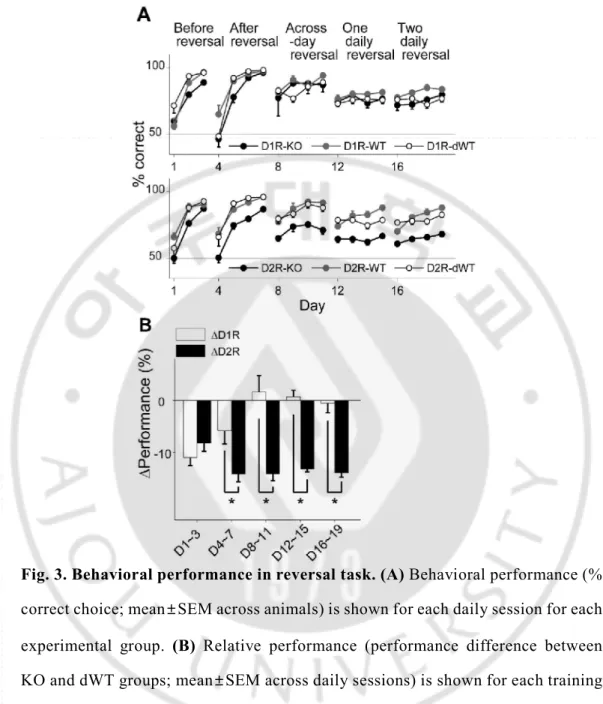
All animal groups learned to choose the correct goal over the first three days of training (stage 1; two-way repeated measure ANOVA, main effect of training day, D1R-group, p=1.0ⅹ10-6; D2R-group, p=4.0ⅹ10-6), during which the location of
the correct goal was fixed, so that the animal’s performance (% correct choice) on the third day of training was > 80 % in all animal groups (Fig. 3A). However, D2R-KO mice were slower in improving performance compared to the other animal groups (main effect of animal group, p=0.004; Bonferroni post-hoc test, D2R-KO vs. D2R-WT, p=0.007; D2R-KO vs. D2R-dWT, p=0.035). D1R-KO mice also showed a tendency for lower performance compared to D1R-dWT mice (main effect of animal group, p=0.045; D1R-KO vs. D1R-dWT, p=0.054). Upon the reversal of the correct goal location, all animals learned to choose the new target location (stage 2; days 4-7; main effect of training day, D1R-group, p=1.0ⅹ10-6; D2R-group,
p=1.0ⅹ10-7) so that the animals performance on the fourth day (day 7) of training
was > 80 % (Fig. 3A). However, performance of D2R-KO mice was lower (main effect of animal group, p=8.0ⅹ10-6) relative to those of both D2R-WT (p=9.3ⅹ10
-5) and D2R-dWT (p=3.1ⅹ10-5) mice. D1R-KO mice showed lower performance
than the other animals groups only on day 5 (main effect of animal group, p=0.160; groupⅹday interaction effect, p=0.012; day 5, D1R-KO vs. D1R-WT, p=0.026; D1R-KO vs. D1R-dWT, p=0.013).
33
D1R-KO mice showed relatively intact performance during subsequent stages of reversal training (Fig. 3A). No significant performance variation was found within D1R animal groups during across-session reversal (stage 3; correct goal location changed at the beginning of each session, days 8-11; main effect of animal group, p=0.590) or one-daily reversal (stage 4; correct goal location changed once during each session; days 12-15; p=0.233). The significant difference between D1R-WT and D1R-dWT animals was found only on day 18 (p=0.007). By contrast, performance of D2R-KO mice was significantly impaired in all subsequent stages of reversal learning (main effect of animal group, p values < 2.0ⅹ10-4; Fig. 3A).
To further control for trial-by-trial variations in trial duration, I examined effects of D1R-KO and D2R-KO on the animal’s performance using a logistic linear regression analysis that included trial-by-trial duration as an explanatory variable (see Materials and Methods). This analysis indicated significant effect of D1R-KO on the animal’s performance during stages 1 (t-test, p=7.8ⅹ10-10), 4 (p=7.8ⅹ10-9),
and 5 (p=6.3ⅹ10-15), but not during stages2 and 3 (p=0.921 and 0.382, respectively),
and significant effect of D2R-KO in all training stages (p values < 3.0ⅹ10-5). For
direct comparison between D1R-KO and D2R-KO animals, I compared relative performance, which is the difference in performance (% correct choice) between KO and dWT groups (ΔD1R and ΔD2R) of each receptor subtype. ΔD2R was
significantly lower than ΔD1R in all training stages except the initial phase (t-test,
stages 1-5, p=0.369, 0.048, 0.007, 1.2ⅹ10-4 and 0.001, respectively; Fig. 3B). Note
that ΔD2R was lower than ΔD1R, even though trial durations were shorter for
34
Fig. 3. Behavioral performance in reversal task. (A) Behavioral performance (% correct choice; mean±SEM across animals) is shown for each daily session for each experimental group. (B) Relative performance (performance difference between KO and dWT groups; mean±SEM across daily sessions) is shown for each training stage. Asterisks, significant differences (t-test, p < 0.05).
35
2.
TAB task
The animal’s performance was assessed by the proportion of rewarded choices [P(R)] (session examples are shown in Fig. 4A), but similar results were obtained when it was assessed by the proportion of choosing the higher arming probability goal in each block (data not shown). In stage 1, performances of KO and D1R-dWT mice were not significantly different from each other, but significantly lower than that of D1R-WT mice (main effect of group, p=0.002; D1R-KO vs. D1R-WT,
p=0.033; D1R-KO vs. D1R-dWT, p=1.000; D1R-WT vs. D1R-dWT, p=0.003). By
contrast, performance of KO was significantly lower than those of both D2R-WT and D2R-dD2R-WT mice (data during the initial 10-days were analyzed; main effect of animal group, p=1.0ⅹ10-7; D2R-KO vs. D2R-WT, p=1.0ⅹ10-7; D2R-KO vs.
D2R-dWT, p=0.010; Fig. 4B).
Daily performance of the animals stayed more or less stable in subsequent stages (Fig. 4B). Therefore I collapsed behavioral data of stages 2-3 and those of stages 4-5 and analyzed them together. In stages 2-3, performances of D1R-KO and D1R-dWT mice were similar, but significantly lower than that of D1R-WT mice (one-way ANOVA, p=1.0ⅹ10-7; Bonferroni post-hoc test, D1R-KO vs. D1R-WT,
p=1.0ⅹ10-7; D1R-KO vs. D1R-dWT, p=0.963; D1R-WT vs. D1R-dWT, p=
1.0ⅹ10-7) as in stage 1, suggesting that impaired performance of D1R-KO relative
to D1R-WT animals was because of longer trial durations. On the other hand, D2R-KO mice showed significantly lower performance than the other D2R animal groups in stages 2-3 (p=1.0ⅹ10-7; D2R-KO vs. D2R-WT, p=1.0ⅹ10-7; KO vs.
D2R-dWT, p=1.0ⅹ10-7) as well as in stages 4-5 (p=1.0ⅹ10-7; D2R-KO vs. D2R-WT,
36
considering trial durations also indicated that there was no significant effect of D1R-KO in stages 2-3 (t-test, p=0.434), but was significant effects of D2R-KO in stages 2-3 (p=3.9ⅹ10-48) and 4-5 (p=1.9ⅹ10-54). In addition, relative performance
of D2R-KO mice (ΔD2R) was significantly lower compared to that of D1R-KO
mice (ΔD1R) in stage 1 (initial 10 days, t-test, p=9.9ⅹ10-6) as well as stages 2-3
37
38
Fig. 4. Behavioral performance in dynamic TAB task. (A) Examples of choice behavior (chosen from stage 3; left, D2R-KO; right, D2R-dWT) in the TAB task. Tick marks indicate trial-by-trial choices of the animal (top, left choice; bottom, right choice; long, rewarded; short, unrewarded) and vertical lines denote block transitions. Numbers on the top of outside indicate reward probabilities in each block. The line shows the probability of choosing the left goal (PL) in moving
average of ten trials. (B) The proportion of rewarded choices [P(R)] is shown for each daily session for each experimental group. (C) Behavioral performance data (meanⅹSEM across animals) were pooled across days for stages 2-3 and 4-5. (D)
Relative performance (mean±SEM across daily sessions) is shown for stages 1 and 2-3. Asterisks, significant difference (C, one-way ANOVA followed by Bonferroni post-hoc tests; D, t-test, p <0.05).
39
B. Logistic regression analysis
Effects of past choices and rewards
In order to examine how the animal’s current choices was influenced by the animal’s choice and its outcome in the previous trial, it was assessed the proportions of repeating rewarded choice (combined win-stay or cWS) and switching from unrewarded choice (combined lose-switch or cLS). Note that these measures, in this study, would be called as cWS and cLS to denote combined effects of potential multiple underlying processes and to distinguish them from pure terms of WS and LS that are independent of the other components of the model (such as the RL term; see Materials and Methods). Additionally it was examined effects of the animal’s choice and its outcome two trails before on the current choice by assessing proportions of repeating the choice that was rewarded two trials before (cW2S) and
switching from the choice that was unrewarded two trials before (cL2S). In the
reversal task, cWS and cLS tended to be lower in D2R-KO than D2R-dWT mice (two-way repeated measure ANOVA followed by Bonferroni post-hoc tests, cWS, staged 2-5, p values < 0.05, cLS, stage 3, p=0.009; stage 4, p=0.047), but similar between D1R-KO and D1R-dWT mice (cWS, p values > 0.1; cLS, p values > 0.25; Fig. 5A), which is consistent with impaired performance of D2R-KO mice in the reversal task. In the TAB task, no significant difference was found on these measures between D2R-KO and D2R-dWT mice except cWS in stage 1 (first 10 trials of stages 1-4 were used for D2R-KO mice for statistical comparisons with the other mice; cWS, stage 1, p < 0.001; stages 2-5, p > 0.18; cLS, all stages, p value > 0.09). On the other hand, cW2S was significantly lower (all training stages, p values < 0.02) and cL2S was significantly higher (stage 4, p=0.107; the other stages, p values < 0.002) in D2R-KO than D2R- dWT mice. No significant difference was observed for these measures between D1R-KO and D1R-dWT mice (stages 1-3, cW2S, p values > 0.5; cL2S, p values > 0.75; Fig. 5A). Thus, in the TAB task,
D2R-40
KO animals were different from D2R-dWT mice in incorporating distant reward history (reward at t-2 trial) in deciding which goal to choose.
I also carried out a logistic regression analysis to examine further how the animal's choices were influenced by the history of past choices and their outcomes during the TAB task. All animals tended to alternate their choices (choice effect) whereas repeat the choice that was rewarded in recent trials (reward effect) as previously described for rats (Huh et al., 2009; Kim et al., 2009) and monkeys (Lau and Glimcher, 2005). However, effects of past choices and rewards were different across WT, dWT and KO animal groups for both D1R and D2R (Fig. 5B), and the following characteristics are worth noting. First, reward effect of the previous trial (t-1) in WT animals was markedly different from those of dWT and KO animals for both D1R and D2R, indicating a strong effect of trial duration on this measure. Second, effects of past choices and rewards were different between KO and dWT groups for both D1R and D2R (one-way ANOVA followed by Bonferroni post-hoc tests), indicating that not only D2R-KO, but also D1R-KO altered the way past choices and rewards influenced the animal’s choices. Thus, although D1R-KO mice showed relatively intact performance in the TAB task, the pattern of their choices was different from those of the other animal groups. Third, past choice effect was not a monotonic function for D2R-KO mice. The magnitude of past choice effect increased between t-1 and t-2 trials and then gradually declined for more distant trials. Although results of a simple regression analysis are limited in providing useful information on underlying neural processes, this pattern raises a possibility that effects of past choices and rewards are mediated by multiple underlying processes.
41
C. Modeling
The above analysis results suggest altered choice behavior of D1R-KO and D2R-KO mice from their respective control mice (D1R-dWT and D2R-dWT, respectively). However, they are limited in revealing underlying psychological and neural processes because externally observed measures might be outcomes of combined effects of multiple underlying processes. For example, win-stay can be influenced by an RL-like process, wherein actions are selected according to values that are computed based on the history of past choices and rewards, as well as by a simple win-stay-lose-switch strategy irrespective of values. It was therefore performed a model-based analysis to obtain insights on psychological and neural processes underlying the animal’s choice behavior. In the previous laboratory research, it has shown that rat's choice behavior in a dynamic TAB task similar to the one used in the present study is well explained by a simple RL model (Huh et al., 2009). However, the non-monotonic influence of past choices in D2R-KO mice (Fig. 5B) suggests existence of multiple processes mediating effects of past choices and rewards. Also, other studies added an additional RL process (Beeler et al., 2010), a perseveration factor (it is a repeated choice pattern irrelevant to be rewarded or not; (Rutledge et al., 2009) ) or a win-stay-lose-switch strategy (Worthy and Todd Maddox, 2013) to an RL model to account for humans' or mice's choice behavior. In addition, an uncertainty-based exploration term was added to an RL model to account for choice behavior of human subjects carrying different alleles for genes controlling dopamine functions (Frank et al., 2009). Therefore, it was needed to examine several different versions of a hybrid model, and found that a model consisting of a win-stay-lose-switch strategy (irrespective of value), a simple RL component (which updates value in a recursive manner) and uncertainty-based exploration well explained the animal's choice behavior in the TAB task. Specifically, the model containing separate processes for win- stay (WS, repeating the rewarded choice in the previous trial irrespective of value), lose-switch (LS,
42
switching from the unrewarded choice in the previous trial irrespective of value), value learning from positive outcomes, value learning from negative outcomes and uncertainty-based exploration along with choice bias outperformed all other reduced models as assessed by Akaike’s information criterion (AIC) and Bayesian information criterion (BIC) (Burnham and Anderson, 2002) (Table 2).
Results of the logistic regression analysis (Fig. 5B) indicated that trial duration strongly affected the influence of the right previous reward on the animal’s subsequent choice in the TAB task. As can be expected from this, trial duration was significantly correlated with the majority of model parameters (Fig. 6).

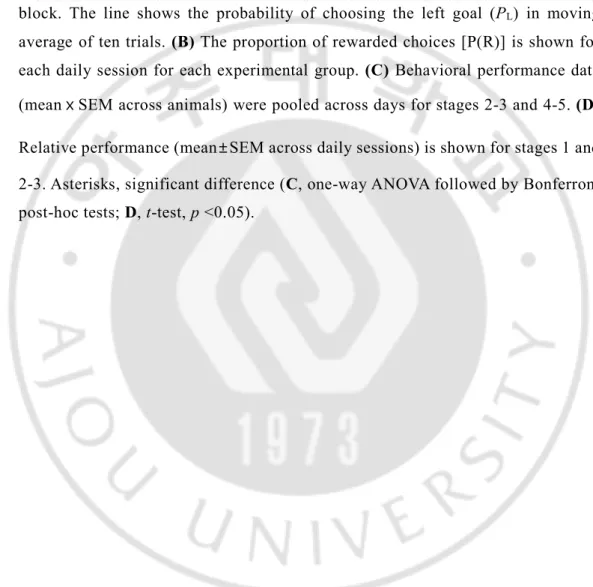

![Fig. 6. Correlations between trial duration and model parameters. WS [( )], win-stay; LS [( )], lose-switch; ε, coefficient for uncertainty-based exploration; , learning rate for positive outcome; , learning rate for negative](https://thumb-ap.123doks.com/thumbv2/123dokinfo/4685611.3296/56.773.94.686.108.507/correlations-duration-parameters-coefficient-uncertainty-exploration-positive-learning.webp)