저작자표시-비영리-변경금지 2.0 대한민국 이용자는 아래의 조건을 따르는 경우에 한하여 자유롭게 l 이 저작물을 복제, 배포, 전송, 전시, 공연 및 방송할 수 있습니다. 다음과 같은 조건을 따라야 합니다: l 귀하는, 이 저작물의 재이용이나 배포의 경우, 이 저작물에 적용된 이용허락조건 을 명확하게 나타내어야 합니다. l 저작권자로부터 별도의 허가를 받으면 이러한 조건들은 적용되지 않습니다. 저작권법에 따른 이용자의 권리는 위의 내용에 의하여 영향을 받지 않습니다. 이것은 이용허락규약(Legal Code)을 이해하기 쉽게 요약한 것입니다. Disclaimer 저작자표시. 귀하는 원저작자를 표시하여야 합니다. 비영리. 귀하는 이 저작물을 영리 목적으로 이용할 수 없습니다. 변경금지. 귀하는 이 저작물을 개작, 변형 또는 가공할 수 없습니다.
Chul-Hyeong Park
February 2018
Development of the metabolic syndrome by
the level of physical fitness and parent-child
associations of the levels of physical activity
and obesity among elementary students
Dissertation of Doctor of Philosophy
ABSTRACT
Health management in childhood is currently of great importance. Obesity is largely attributed to insufficient sleep, lack of physical activity, unhealthy eating habits, and home environment. High levels of physical fitness are known to be effective in prevention and improvement of diseases. Physical fitness is closely associated with both metabolic diseases and prevention of obesity. Despite the steady increase in the prevalence of obesity in students from Jeju, there is a lack of research on factors associated with reducing the prevalence of obesity in the students. This study aimed to investigate parent-child associations of physical activity levels and obesity by assessing obesity and physical fitness levels, metabolic syndrome risk factors, and physical activity habits in elementary school students from Jeju. In addition, the study aimed to examine the significance of physical fitness by assessing the development of metabolic syndrome according to physical fitness levels in these students. For these purposes, the study was sub-divided into two: Study I comprised the analysis of parent-child associations in levels of physical activity and obesity, and Study II comprised the analysis of the development of metabolic syndrome by level of physical fitness. Results indicated that physical activity levels of boys were positively and significantly associated with those of their fathers. Girls showed a positive correlation with the physical activity levels of their parents. The body mass index of boys was also positively correlated with that of their mothers. The body mass index of girls was positive correlated with that of both parents. Additionally, as a result of analyzing the risk of metabolic syndrome according to physical fitness level while controlling for obesity level, students with low physical fitness levels showed a 5.86 times higher risk of metabolic syndrome than students with high physical fitness levels. In summary, these results suggest that both physical activity and obesity levels of children and their parents are closely related, and that increased physical fitness level is an independent factor associated with the reduction or prevention of risk for developing metabolic syndrome. Family participation in physical activity and the improvement of physical fitness levels are essential for the management of health in childhood.
i
CONTENTS
ABSTRACT 1. Introduction ... 1 1.1 Background ... 1 1.2 Research purpose ... 4 1.3 Research design ... 5 1.4 Research hypotheses ... 6 1.5 Research limitation ... 7 1.6 Definition of terms ... 8 1.7 Abbreviations ... 92. Review of Related Literature ... 11
2.1 Introduction ... 11
2.2 Physical fitness and metabolic syndrome in childhood ... 11
2.3 Obesity and physical activity in childhood ... 14
2.4 Metabolic syndrome and physical activity in children ... 17
3. Study I: Parent-child associations of the levels of physical activity and obesity among elementary students ... 19
3.1 Purpose of the study ... 20
3.2 Methods ... 20
ii
4. Study II: Development of the metabolic syndrome by the level of physical fitness ... 38
4.1 Purpose of the study ... 39
4.2 Materials and methods ... 39
4.3 Results ... 51
5. Discussion ... 90
6. Conclusions and Recommendations ... 96
REFERENCES ... 97
ABSTRACT (KOREAN) ... 111
iii
List of Tables
Table 1. Participants Characteristics in the Study I ... 20
Table 2. Parents Characteristics in the Study I ... 21
Table 3. Frequency of Obesity by Genders ... 28
Table 4. Frequency of Obesity by Parents ... 28
Table 5. Mean Values of Physical Actibity Habit and Sedentary Time by Genders ... 29
Table 6. Mean Values of Physical Activity Habit and Sedentary Time by Parents ... 30
Table 7. Classification by Metabolic Equivalent of Task among Genders ... 31
Table 8. Classification by Metabolic Equivalent of Task among Parents ... 32
Table 9. Correlation between Levels of Physical Activity and Body Mass Index among Genders... 33
Table 10. Correlation Between Levels of Physical Activity and Body Mass Index among Parents ... 34
Table 11. Correlation of Body Mass Index between Parents-Children ... 35
Table 12. Correlation of Physical Activity Level between Parents and Boys ... 36
Table 13. Correlation of Physical Activity Level between Girls and Parents ... 37
Table 14. Participants Characteristics in the Study II ... 39
Table 15. The International Diabetes Federation Definition of the at Risk Group and Metabolic Syndrome in Children and Adolescents ... 42
Table 16. Grip Strength Evaluation Standard ... 46
Table 17. Sit-up Evaluation Standard ... 46
Table 18. Sit-up Reach Evaluation Standard ... 46
Table 19. Progressive Aerobic Cardiovascular Endurance Run Evaluation Standard ... 47
Table 20. Body Mass Index Evaluation Standard ... 47
iv
Table 22. Mean Values of Body Measurement and Body Composition by Genders ... 51
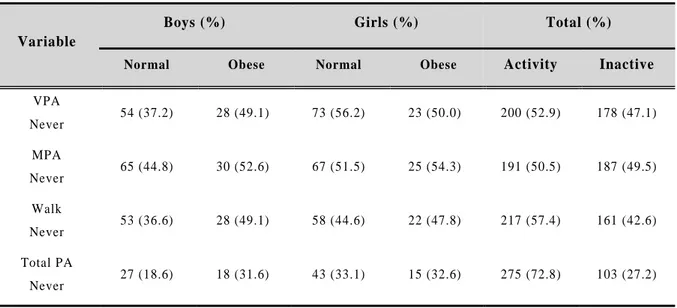
Table 23. Mean Values of Physical Activity Habits by Genders ... 53
Table 24. Frequency of Physical Activity Habit between Normal and Obese Students ... 54
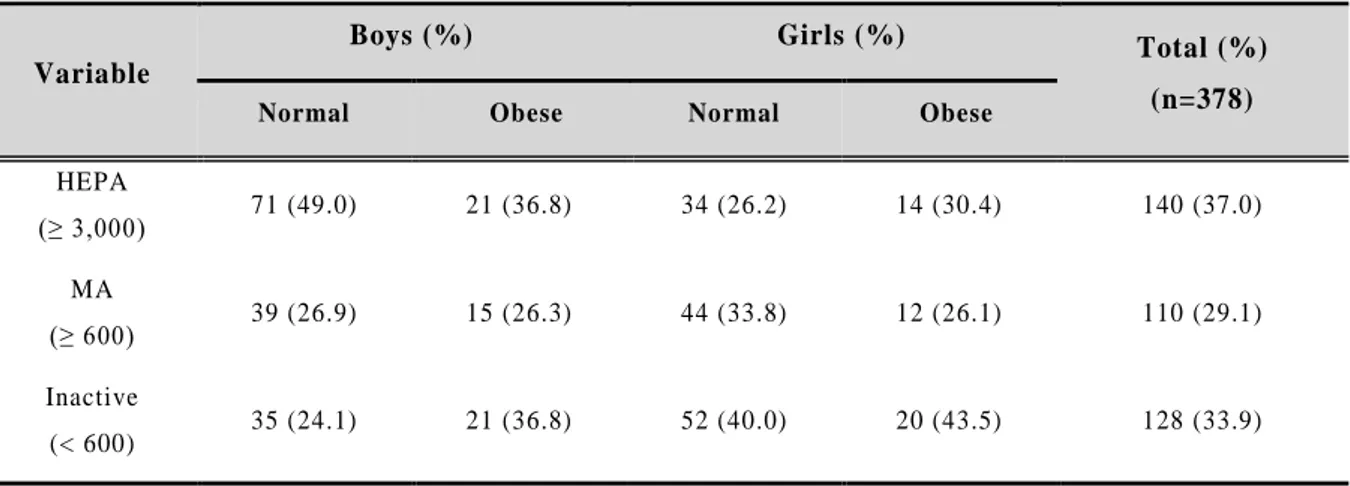
Table 25. Classification by Metabolic Equivalent of Task among Normal and Obese Students ... 55
Table 26. Mean Values of Physical Fitness by Genders ... 56
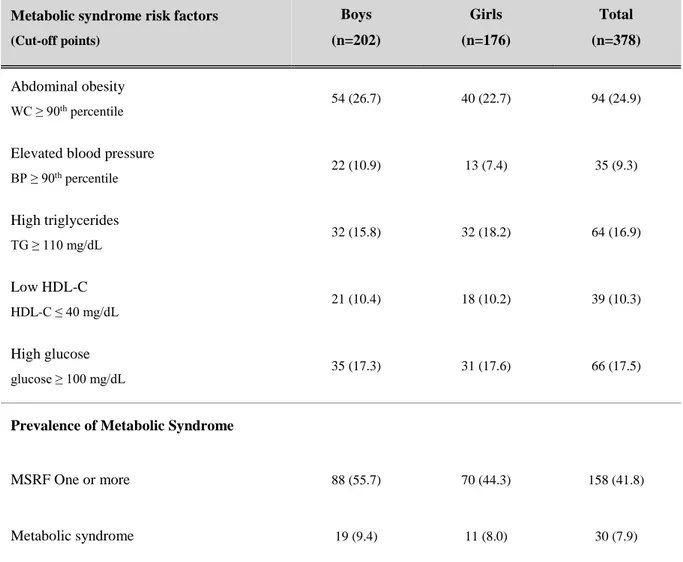
Table 27. Mean Values of Metabolic Syndrome Risk Factors by Genders ... 57
Table 28. Prevalence of Insulin Resistance and Metabolic Syndrome by Genders (%) ... 58
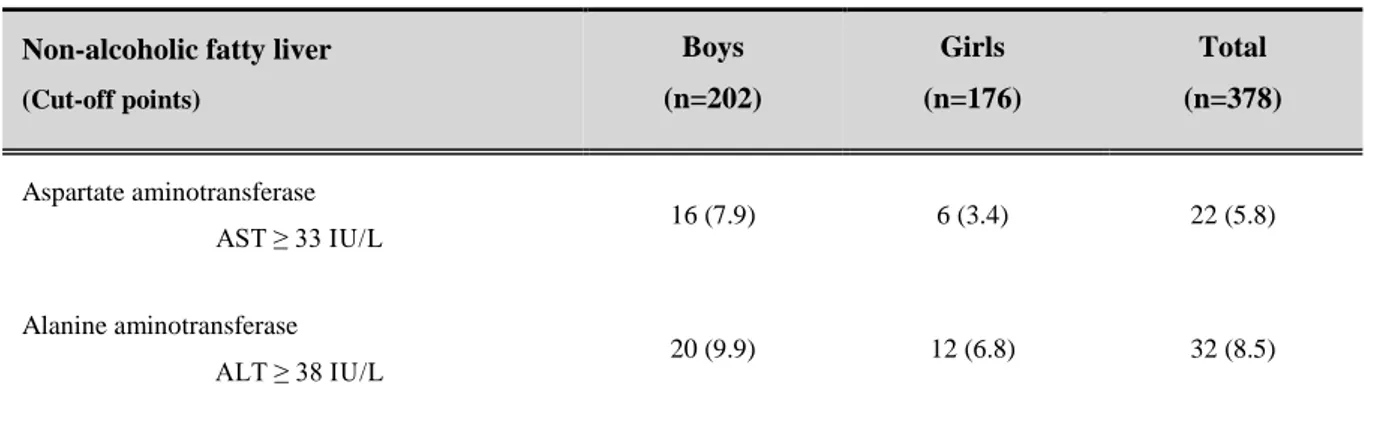
Table 29. Prevalence of Non-alcoholic Fatty Liver Disease by Genders (%) ... 59
Table 30. Correlation between Levels of Obesity and P hysical Activity among Boys ... 60
Table 31. Correlation between Levels of Obesity and Physical Activity among Girls ... 61
Table 32. Correlation between Levels of Obesity and Physical Fitness among Boys ... 62
Table 33. Correlation between levels of Obesity and Physical Fitness among Girls ... 63
Table 34. Correlation between Levels of Obesity and Metabolic Syndrome Risk Factors among Boys ... 65
Table 35. Correlation between Levels of Obesity and Metabolic Syndrome R isk Factors among Girls ... 66
Table 36. Correlation between Levels of Physical Activity and Physical Fitness among Boys ... 68
Table 37. Correlation between Levels of Physical Activity and Physical Fitness among Girls ... 69
Table 38. Correlation between Levels of Physical Activity and Metabolic Syndrome Risk Factors among Boys ... 71
Table 39. Correlation between Levels of Physical Activity and Metabolic Syndrome Risk Factors among Girls ... 72
Table 40. Correlation between Levels of Physical Fitness and Metabolic Syndrome Risk Factors among Boys ... 74
v
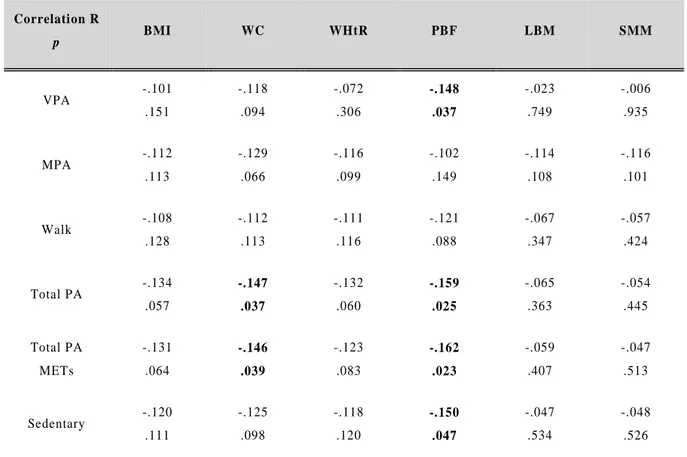
Table 41. Correlation between Levels of Physical Fitness and Metabolic Syndrome Risk
Factors among Girls ... 75
Table 42. Comparison of Physical Activity Level by Body Mass Index in Normal and Obese Students ... 76
Table 43. Comparison of Physical Fitness Level by Body Mass Index in Normal and Obese Students ... 77
Table 44. Comparison of Metabolic Syndrome Risk Factors by Body Mass Index in Normal and Obese Students ... 79
Table 45. Comparison of Metabolic Syndrome Factors across Fatness and Combined Fitness Level ... 81
Table 46. Prevalence of Metabolic Syndrome Factors across Fatness and Combined Fitness Level ... 81
Table 47. Relative Risk of Metabolic Syndrome by Fatness and Combined Fitness Level ... 83
Table 48. Relative Risk of Metabolic Syndrome by Fatness and Combined Fitness Level ... 85
Table 49. Comparison of Metabolic Syndrome Factors across Combined Fitness Level ... 86
Table 50. Prevalence of Metabolic Syndrome Factors across Combined Fitness Level ... 86
Table 51. The Risk of One or More Metabolic Syndrome Factors across Combined Fitness Level ... 88
vi
List of Figure
Figure 1. Study Design ... 5
Figure 2. Study Process of Study I ... 22
Figure 3. Study Process of Study II ... 40
Figure 4. Frequency of Obesity by Genders (%) ... 52
Figure 5. The Risk of One or More Metabolic Syndrome Factors across Fatness and Combined Fitness Level ... 83
Figure 6. Relative Risk of Metabolic Syndrome by Fatness and Combined Fitness Level ... 85
Figure 7. The Risk of One or More Metablic Syndrome Factors across Combined Fitness Level ... 88
1
1. Introduction
1.1 Background
Recently, an increasing number of children and adolescents have been observed to have a poor lifestyle as well as many health problems, including cardiovascular disease (CVD), metabolic, and psychological disorders (Censin et al., 2017; Lobstein, Baur, & Uauy, 2004; Reddy, Pickett, & Orcutt, 2006; Schwartz & Chadha, 2008; Stockman, 2009; Weiss, 2011; World Health Organization, 2000). These health problems in children and adolescents are attributed to obesity as well as physical inactivity and poor physical fitness (Hallal, Victora, Azevedo, & Wells, 2006).
According to the Centers for Disease Control and Prevention (CDC), childhood obesity has increased about threefold since 1980, and about 17% of all children aged 2 - 19 years have been classified as obese. The prevalence of obesity in children aged 6 - 11 years was reported to be 17.5% in 2015 in the United States (Ogden, Carroll, Fryar, & Flegal, 2015). In Korea, the prevalence of childhood obesity based on BMI increased from 19.8 % in 2011 to 21.1 % in 2015 (Ministry of Education, 2015, 2016). In the last five years, the prevalence of obesity was highest among elementary school students in 17 cities and provinces in Jeju. Results of the survey indicated that the prevalence of obesity in Jeju was 22.98%, which was 8.45% higher than the national average of 14.53%; Jeju emerged, as the only region exceeding 20% in terms of obesity among elementary school students (Ministry of Education, 2015, 2016).
In addition to the increasing prevalence of obesity, the lack of physical activity is a problem that goes hand in hand with decreasing physical fitness in children and adolescents. World Health Organization (2010) stated that over 81% of adolescents aged 11 - 17 years did not meet the recommended 60 minutes of physical activity each day (World Health Oragnization, 2016). Overweight and obese children and adolescents tend to have lower levels of physical activity and physical fitness (DiPietro, 1999; Pietilainen et al., 2008; Wareham, van Sluijs, & Ekelund, 2007). Despite such evidence, physical activity levels remain low; many children engage in considerably less physical activity than is recommended (Reilly et al., 2004; Roger et al., 2012).
2
The lack of physical activity and physical fitness in children and adolescents, especially among those with obesity, increases the risk for chronic diseases, including heart disease and diabetes (Chan & Woo, 2010; The U.S. Department of Health and Human Services, 2008; Warburton, Nicol, & Bredin, 2006), it also leads to increased morbidity in adulthood, relating to various diseases, in childhood (Booth, Roberts, & Laye, 2012; Durstine, Gordon, Wang, & Luo, 2013). Complications associated with obesity also occur in childhood (Goran, Ball, & Cruz, 2003; Sinha et al., 2002). The risk for metabolic syndrome (MS), which is associated with such risk factors as hypertension, hyperglycemia, and dyslipidemia, is also closely related to childhood obesity (Freedman, Khan, Dietz, Srinivasan, & Berenson, 2001; Park, Boston, Oh, & Jee, 2009). In Korea, the prevalence of MS in adolescents between 12 and 19 years old increased rapidly from 4.0% in 1998 to 7.8% in 2007. In particular, the prevalence of high triglyceride, low high-density lipoprotein cholesterol, and abdominal obesity increased significantly, which suggests that the lack of exercise and unbalanced nutrition in adolescents are the cause of the increased incidence of MS (Lim et al., 2013). The number of children and adolescents with diabetes was estimated to be 57.5 per 100,000 population, and the prevalence among youth (10-17 years old) was about six times higher than that of children (0-9 years old) in 2011 (Korean Diabetes Association, 2012).
Habitual physical activity (PA) and physical fitness (PF) are needed for positive health outcomes in childhood and adulthood, such as maintaining a regular body weight (Strong et al., 2005). PA and PF contribute to reducing not only obesity, but also CVD risk factors, inflammation, and neuronal function as well as cardiovascular morbidity (National Institutes of Health, 1996; Okura, Saghazadeh, Soma, & Tsunoda, 2013). These also improve bone density and body composition (Jakicic, 2009). Therefore, children, regardless of their weight, need to increase their PA and PF.
Despite the steady increase in obesity prevalence among elementary students in Jeju, the causes of the
increase remain poorly understood
.
Also, there are a few studies which demonstrated MS and PF aswell as parent-child associations of the levels of PA. Thus, this study aimed to identify the importance of PF by investigating the parent-child associations of the levels of PA and obesity by examining the relationship between levels of obesity, PF, risk factors of MS, and PA, and by investigating the
3
development of MS according to the level of PF among Jeju elementary school students. The results of our study are significant in that they provide basic data for establishing policies for reducing the obesity prevalence of Jeju elementary school students in the future.
4
1.2 Research purpose
This study aimed to identify the importance of PF by investigating the parent-child associations of levels of PA and obesity, examining between the levels of obesity, PF, the risk factors of MS, and PA habit related to the increase of obesity prevalence, and to investigate the development of the MS by the level of PF among Jeju elementary school students.
Study I: Parent-child associations of the levels of physical activity and obesity among elementary students
This study was to analyze parent-child associations between levels of PA and obesity among elementary students.
Study II: Development of the metabolic syndrome by the level of physical fitness
This study was to analyze the development of MS according to the level of PF among elementary students.
5
1.3 Research design
This study was conducted as part of the Jeju City Public Health Center’s 2015 Jeju Child Obesity Reduction Project. To investigate the factors related to obesity in elementary school students, two studies were conducted as shown in Figure 1.
Figure 1. Study Design
Study I
Analysis of parent-child associations of the levels of
physical activity and obesity among elementary students
Study II
Analysis of development of the metabolic syndrome
by the level of physical fitness
6
1.4 Research hypotheses
The following hypotheses were established to clarify the purpose of this study.
1) The parent–children level of obesity and PA habits were correlated.
(1) There was a positive correlation of obesity level between parents and children. (2) There was a positive correlation of level of PA habits between parents and children.
2) The level of PF was different according to presence of obesity.
(1) The level of PF (muscle strength, muscle endurance, flexibility, cardiovascular fitness, body composition) was high in normal students.
(2) The level of PF (muscle strength, muscle endurance, flexibility, cardiovascular fitness, body composition) was low in obese students.
3) The risk factor and prevalence of MS were different according to presence of obesity. (1) The risk factor and prevalence of MS were low in normal students.
(2) The risk factor and prevalence of MS were high in obese students.
4) The risk of MS was different according to the levels of obesity and PF.
(1) The risk of MS was low among students with low levels of obesity and high PF. (2) The risk of MS was high among students with high levels of obesity and low PF.
5) The risk of MS was different according to levels of PF. (1) Students with high PF levels had a low risk of MS. (2) Students with a low PF level had a high risk of MS.
7
1.5 Research limitation
This study has the following limitations.
1) This study selected elementary school students attending some schools in Jeju.
2) The cross-sectional study is limited in determining the causal relationship between obesity, physical activity, physical fitness level and MS risk factors in elementary school students.
3) The degree of growth development, sexual maturity, and exercise performance varied among the participants.
4) We could not control the genetic, psychological, cultural, and environmental factors by the demographic variables of the subjects.
8
1.6 Definition of terms
1) Obesity
Obesity can be viewed as simply putting on excessive weight, but technically it is characterized by a state in which excess fat tissue accumulates in the body and body fat is elevated above normal.
2) Obese children
Obese children means obesity in school-aged children aged 6 to 12 years.
3) Body mass index
Body mass index (BMI) is a measure of obesity by dividing the body weight (kg) by the height (m)2
according to the formula [BMI = body weight (kg) ÷ height (m)2]. The diagnosis of obesity in children and adolescents was based on the 85-94.9th percentiles as overweight and the 95th percentiles as obesity according to gender and age (Korea Center for Disease Control and Prevention, 2007).
4) Waist Circumference
Waist Circumference (WC) is a measure of abdominal obesity. The method of measuring WC is most commonly used when considering cost and simplicity. Abdominal obesity in children and adolescents was diagnosed to exceed the 90th percentiles according to the International Diabetes Federation (IDF), age, and sex (Zimmet et al., 2007).
5) Percent body fat
Percent body fat (PBF) refers to the ratio of body fat to body weight. In the Physical Activity Promotion System (PAPS), the PBF values and their corresponding weight classification for boys are as follows: 15% to 24.9% overweight; 25% to 32.9% moderate obesity; and over 33% obesity. For girls, the corresponding values are as follows: 27% to 31.9% overweight; 32% to 39.9% moderate obesity; and over 40% obesity (Ministry of Education, 2009).
9
1.7 Abbreviations
The abbreviations used in this study are as follows.
․ BMI : Body Mass Index (kg/m2)
․ DBP : Diastolic Blood Pressure (mmHg) ․ FG : Fasting Glucose (mg/dL)
․ FI : Fasting Insulin (μU/mL) ․ HC : Hip Circumference (cm)
․ HDL-C : High Density Lipoprotein Cholesterol (mg/dL)
․ HOMA-IR : Homeostasis Model Assessment of Insulin Resistance ․ IDF : International Diabetes Federation
․ LDL-C : Low Density Lipoprotein Cholesterol (mg/dL) ․ MET : Metabolic Equivalent of Task
․ MPA : Moderate Physical Activity (min/week) ․ MS : Metabolic Syndrome
․ PA : Physical Activity
․ PACER : Progressive Aerobic Cardiovascular Endurance Run (number) ․ PAPS : Physical Activity Promotion System
․ PBF : Percent Body Fat (%) ․ PF : Physical Fitness
․ SBP : Systolic Blood Pressure (mmHg) ․ SMM : Skeletal Muscle Mass (kg) ․ SR : Sit and Reach (cm)
10 ․ SU : sit-up (number/minute)
․ TC : Total Cholesterol (mg/dL) ․ TG : Triglyceride (mg/dL)
․ VPA : Vigorous Physical Activity (min/week) ․ WC : Waist Circumference (cm)
․ WHR : Waist Hip Ratio (%)
11
2. Review of Related Literature
2.1 Introduction
This chapter reviews the literature related to this study.
2.2 Physical fitness and metabolic syndrome in childhood
Physical fitness (PF) is defined as the ability to perform daily task without fatigue and the ability to perform PA and/or physical exercise integrating most of the bodily functions, such as skeletomuscular, cardio-respiratory, hematocirculatory, endocrine-metabolic, and psycho-neurological, involved in bodily movement (Caspersen, Powell, & Christenson, 1985; Clarke, 1971; Martínez-Vizcaíno & Sánchez-López, 2008). PF comprises health-related fitness including cardiorespiratory endurance, muscular endurance, muscular strength, body composition, and flexibility and skill-related fitness including agility, balance, coordination, power, reaction time, and speed (Martínez-Vizcaíno & Sánchez-López, 2008; Utesch, Dreiskämper, Strauss, & Naul, 2017). The health-related components of PF are important to childhood health.
The overall risk of death from disease is significantly reduced by PA and PF training, even if overweight or obese (Barlow, Kohl III, Gibbons & Blair, 1995; Welk & Blair, 2000). In 2001, Williams PT of the Lawrence Berkeley National Laboratory in the USA identified both PA and PF levels measured by VO2max as independent risk factors for coronary artery disease (CAD). Williams PT (2001) conducted a meta-analysis that confirmed the relationship between PA/high PF levels and the independent risk factors of CAD and cardiovascular disease (CVD). When both PA and PF increased from the lowest percentile to a higher percentile, especially exceeding 15%, both CAD and CVD showed decreased risk (Williams, 2001). High fitness levels showed a more direct relationship with reduced risk of disease than PA. As these results continue to be controversial among epidemiologists, more research and discussion of this issue will be needed (Blair & Jackson, 2001).
The importance of PF for health is well known and especially, PF in children and adolescents is a major biomarker for health and is related to various diseases. High PF in youth is related to low
12
prevalence of asthma-like symptoms in adulthood (Guldberg–Møller, Hancox, Mikkelsen, Hansen, & Rasmussen, 2015). Melinder et al. (2015) reported that low PF is also associated with the risk of inflammatory bowel disease (IBD). Low PF increased the risk of Crohn’s disease (CD) and ulcerative colitis (UC) in adolescence, and an inverse association between PF and IBD risk suggested a protective role of exercise in the risk of IBD (Melinder et al., 2015). Furthermore, cardiorespiratory fitness is associated with obesity and the cardiorespiratory and muscular fitness is related to the risk factors of cardiovascular disease (Boreham & Riddoch, 2001; Ortega, Ruiz, Castillo, & Sjöström, 2008). A relationship between fitness and fatness and cardiovascular disease has been found in children and adolescents. Eisenmann JC et al. reported significant differences between low-fat and high-fat groups within a fitness group and found a linear relationship across groups for the risk of cardiovascular disease in 1,635 youth aged 8-18 years old (Eisenmann, Welk, Ihmels, & Dollman, 2007).
Obesity is a major determinant of various diseases such as MS. Potential mechanisms are often suggested as ways in which PF can reduce the risk of MS in insulin resistance and obesity and the benefits of PF for health have been proven through the results of various studies. Increasing PF can prevent and/or help the risk of MS by promoting enhanced cardiovascular function and muscular endurance (Robinson & Graham, 2004; Spain & Franks, 2001). Furthermore, the authors concluded that MS risk in the high BMI/high fitness group was significantly lower than the high BMI/low fitness group. It was concluded that the relationship between fatness and aerobic fitness was important for decreasing MS risk in Japanese children (Sasayama, Ochi, & Adachi, 2015). In the analysis of PF, obesity, and insulin resistance of childhood and adulthood, low levels of cardiorespiratory fitness in childhood increased odds of adult obesity and insulin resistance, and decreases in PF levels between childhood and adulthood were associated with increased obesity and insulin resistance per unit decrease (Dwyer et al., 2009). Hasselstrøm H et al. reported that the PF level in youth (aged 17 and 25 years) was especially associated with adiposity in adulthood compared to PA level (Hasselstrøm, Hansen, Froberg, & Andersen, 2002). Also, after adjustment for age and sex, PF was associated with reduced odds of MS and especially, compared with PA, PF showed strong effects in controlling risk factors of cardiovascular disease (Sassen et al., 2009). Evidence from these studies suggested that PF is not only
13
a major factor of MS but also an independent component of MS. Hence, the lack of PF can play a pivotal role for the development of cardiovascular disease, type 2 diabetes, and MS in childhood, which can affect the high risk of obesity and MS in adulthood. Consequently, PF is necessary for health and the prevention of various diseases children and adolescents, as well as adults.
14
2.3 Obesity and physical activity in childhood
Obesity means a state of accumulation of excess body fat in the body according to the number of adipocytes (Bray, 1992). Obesity is diagnosed with measurements for WC, body fat, and central and peripheral fat mass. Obesity is usually expressed as BMI calculated as body weight in kilograms divided by height (kg/m2). Assessments of obesity classification vary depending on the country. In Korea, obesity is defined as BMI ≥ kg/m2, whereas in the United States, obesity is BMI ≥ 25 kg/m2 for overweight and BMI ≥ 30 kg/m2 for obese using BMI categories.
Childhood obesity means obesity in school-aged children aged 6 to 12 years. Despite the literature on childhood obesity, it is difficult to define childhood obesity accurately. In terms of the BMI of children and adolescents, BMI is determined for specific percentiles of age and sex to account for variability of sex and age. According to the Centers for Disease Control and Prevention (CDC), obesity is defined as a BMI at or above the 95th percentile, and overweight is defined as a BMI at or above the 85th percentile but less than the 95th percentile in the same age and sex (The U.S. Department of Health and Human Services, 2008). According to International Obesity Task Force (IOTF), a standard definition should use age/sex-specific cut-off criteria for study purposes (Cole, Bellizzi, Flegal, & Dietz, 2000).
According to WHO, obesity has increased the incidence of metabolic diseases, such as hypertension, diabetes, and dyslipidemia, which are key causes of increased mortality (World Health Organization, 2016; World Health Organization, 2000). Obesity can occur at any time, especially during childhood and adolescence, when physical and mental changes occur rapidly. Obesity in childhood and young people has been described as a crisis in public health and is increasing the threat to health worldwide. Obesity is a chronic disease worldwide (Lobstein et al., 2004; World Health Organization, 2000).
According to results from the 2011-2012 National Health and Nutrition Examination Survey (NHANES), 16.9% of children and adolescents (2-19 years old) in the United States were obese, and 14.9% overweight (Control & Prevention, 2016). In a study of 40,780 children and adolescents (aged 2
15
to 19 years; 48.8% female) in the United States from 2011-2014, Odgen et al. reported a prevalence of obesity of 17.0% (95% CI, 15.5% - 18.6%) and extreme obesity. Obesity especially increased during the periods of 1988 - 1994 and 2013-2014 in adolescents aged 12-19 years. Extreme obesity also increased in the same periods among children aged 6 to 11 (Ogden et al., 2016). Kim et al. reported that the prevalence of childhood obesity (aged 2 to 19 years) was similar to that of American from the early 2000s, but the prevalence of extreme obesity in boys especially increased from 2001 to 2014 in Korea (Nam, Kim, Rhie, & Lee, 2017). These findings raised concerns that being overweight or obese in childhood continues into adulthood and leads to increased risk for various diseases, including diabetes and MS.
The growing prevalence of childhood obesity has also led to increased incidence of various diseases, such as diabetes and MS (Censin et al., 2017; Schwartz & Chadha, 2008; Weiss, 2011). In overweight and obese children, the body composition, including BMI and body weight, is different compared to children of normal weight. Jun et al. reported that fat mass and fat-free mass were higher in obese than normal weight children and, especially as age increased, the fat mass index (FMI) and fat-free mass index (FFMI) significantly increased (Ma, Feng, Zhang, Pan, & Huang, 2009). As the body composition changed due to being overweight or obese, the level of serum insulin and homeostasis model assessment-insulin resistance (HOMA-IR), a method for diagnosing insulin resistance, was also higher. These values have been reported to be positively correlated with total cholesterol (TC), LDL-C, and TG in overweight and obese children, and are risks associated with type 2 diabetes, cardiovascular disease, and MS, as well as secondary and chronic diseases (Chiarelli & Marcovecchio, 2008; Haque, Khan, Chowdhury, Khaled, & Barua, 2017). MS in childhood and adolescence is carried to adulthood, which increases the risk of cardiovascular disease, diabetes, and MS in adults (Magnussen et al., 2010; Morrison, Friedman, Wang, & Glueck, 2008; Stockman, 2009). Therefore, it is important to diagnose, treat, and prevent obesity in children and adolescents at an early stage.
Physical activity (PA) is “body movement” produced by the contraction of skeletal muscles; it also refers to increased energy expenditure above basal level (The U.S. Department of Health and Human Services, 2008). Regular PA offers various health benefits. Evidence supporting the inverse
16
relationship between physical activity and obesity, cardiovascular disease, hypertension, stroke, osteoporosis, type 2 diabetes, colon cancer, breast cancer, anxiety and depression is constantly being explored. This evidence is observed not only in experimental studies, but also in the results of large-scale specimen observations. The recently revised recommendations of the American College of Sports Medicine (ACSM) and American Heart Association (AHA) on physical activity and health indicated that since the 1955 recommendations were issued, epidemiological observations have registered 10,000 people. Consequently, the positive-reaction relationship between the risk of cardiovascular disease and early mortality and physical activity in various ethnic groups in both men and women has been clearly identified (American College of Sports Medicine, 2013)
Many studies have focused on finding successful interventions for preventing child obesity. Studies have reported that obesity is often prevented by various behavioral interventions, especially physical activity. Trost et al. reported that obese children are significantly lower in moderate physical activity (MPA), vigorous physical activity (VPA), and physical activity self-efficacy compared with non-obese children (Trost, Kerr, Ward, & Pate, 2001). Furthermore, in New Zealand, a country with the third highest prevalence of overweight and obese in children and adults, obese children and adolescents aged 4.8-16.8 years were found to have low levels of PA (Anderson et al., 2017; Siwik et al., 2013). A study that targeted children aged 8 - 11 years (BMI above the 85th percentile) and their parents presented a three-month intervention for reducing BMI z scores in overweight children while increasing levels of PA as well as implementing changes in family behavior and attitudes (Siwik et al., 2013). Intervention studies have indicated the importance of PA for beneficial health and behavioral outcomes in ordinary circumstances; the authors recommended that school-aged youth, aged 6 - 18 years, should participate
daily in one or more hours of MPA or VPA (Strong et al., 2005). In other words, PA has the following
benefits: 1) prevention or reduction of cardiovascular disease, high blood pressure, injuries, and obesity; and 2) improvement of self-confidence, self-image, and body composition. PA is needed for the prevention and treatment of childhood obesity (Roberts, 2000).
Therefore, increased PA has been recommended as a method for weight reduction and improved health lifestyle in overweight and obese children.
17
2.4 Metabolic syndrome and physical activity in children
Metabolic syndrome (MS) is called “syndrome X” or “insulin resistance syndrome”. It was initially called “insulin resistance” because MS was observed in various metabolic disorders caused by insulin resistance. MS is generally characterized by the combination of obesity (WC or BMI, and especially, abdominal obesity), dyslipidemia (high TG and low HDL-C), glucose metabolism (glucose intolerance, fasting glucose (FG)), hyperinsulinemia, and hypertension, as well as a risk factor for type 2 diabetes and CVD (Cowey & Hardy, 2006; Earl S Ford, 2005; Grundy, 2006; Grundy et al., 2005; Reaven, 1988, 2005). The definition of MS differs slightly from institution related MS; it is especially difficult to define MS in children because the period of pediatric adolescence is a period in which physiological changes according to sex and age are significant. Overweightness and obese children tend to have hypertension. Overweight and obesity cause insulin resistance, which increases sodium reabsorption. This process activates the sympathetic nervous system and renin-angiotensin system, resulting in hypertension (Hansen, Gunn, & Kaelber, 2007; Kalupahana & Moustaid-Moussa, 2012; Segura & Ruilope, 2007; Yvan-Charvet & Quignard-Boulange, 2011). Furthermore, obesity in children is correlated with increased visceral fat, increased insulin resistance, and cardiovascular risk factors (Bacha, Saad, Gungor, Janosky, & Arslanian, 2003; Kwon et al., 2011). The worldwide prevalence of obesity and diabetes in children and adolescents is rising. In the 1997-2004 National Health and Nutrition Examination Survey (NHANES), the prevalence of MS was 4.5% of adolescents aged 12-17 years. Indeed, as age increased, the prevalence of MS was higher in males than females in the U.S according to IDF definition (E. S. Ford, Li, Zhao, Pearson, & Mokdad, 2008). Grundy et al. reported that the prevalence of MS was one-third of overweight/obese adolescents NHANES (Grundy et al., 2005). An analysis of Medline and Embase databases articles published between August 2007 and January 2009 showed that the prevalence of MSin the general population and community – based sampling was 1.2% to 22.6% with up to 60% of the children and adolescents found to be overweight or obese (Tailor, Peeters, Norat, Vineis, & Romaguera, 2010). The prevalence of MS, according to the National Cholesterol Education Program Adult Treatment Panel III (NCEP), was 4.2%. As defined by
18
WHO, the prevalence of MS was 8.4% in 1,513 school-aged adolescents. In obese teens, the prevalence of MS rises to 19.5%, defined by NCEP, and 38.9%, defined by WHO (Goodman, Daniels, Morrison, Huang, & Dolan, 2004). In other words, as the prevalence of obesity increased, so did the prevalence of MS (Kirk et al., 2005). Meanwhile, MS in children and adolescents predict a higher prevalence of CVD as well as diabetes and MS-related diseases in adulthood (Burns, Letuchy, Paulos, & Witt, 2009; Franks et al., 2007; Morrison et al., 2008).
MS is associated with PA, which is a key factor related to preventing or reducing MS (Brambilla, Pozzobon, & Pietrobelli, 2011). McMurray et al. reported that MS adolescents had 5.16 times lower PA levels (McMurray, Bangdiwala, Harrell, & Amorim, 2008). In addition, the MS of participants was 14.1%, and this study found that PA was an indicator of the related risk factors of MS, including HDL-C, WHDL-C, and TG. Indeed, low physical activity in both males and females aged to 6 - 18 years significantly increased the risk of MS (R. Kelishadi et al., 2007). Kelly et al. demonstrated that participants who exercise had lower MS-related risks compared with participants who do not exercise in overweight and obese children and adolescents (Kelly et al., 2004).
Consequently, PA has been recommended to prevent or reduce MS, including insulin resistance and CVD in obese children and adolescents.
19
3. Study I: Obesity, physical activity survey
Analysis of Parent-child Associations of the
Levels of Physical Activity and Obesity
among Elementary Students
20
3.1 Purpose of the study
This study aimed to analyze parent-child associations of levels of physical activity and obesity among elementary students according to obesity and duration of PA participation.
3.2 Methods
3.2.1 Subjects
This study was conducted with third- to sixth grade students (aged 9–12 years) attending four elementary schools in Jeju. The subjects were selected with the cooperation of the Jeju Special Self-governing Province Education Office and the teachers of each elementary school. The subjects were 567 students (287 boys and 280 girls) who submitted their consent to participate in the research, 1,134 parents (567 fathers and 567 mothers) who submitted their consent to participate in the research. The study protocol was explained to prospective volunteer subjects. Those who provided consent form agreements signed by themselves and their parents were selected to participate. The participant characteristics are shown in <Table 1 and 2>.
Table 1. Participants Characteristics in the Study I
Variables Boys (n=287) Girls (n=280) Total (n=567) Grade (%) 3rd 27.2 22.9 25.0 4th 26.8 21.1 24.0 5th 24.7 33.9 29.3 6th 21.3 22.1 21.7 Age (yrs) 10.40± 1.10 10.55± 1.07 10.48± 1.09 Height (kg) 145.57± 10.30 146.15± 9.32 145.86± 9.82 Weight (kg) 41.22± 11.07 40.71± 9.88 40.96± 10.49
Body Mass Index (kg/m2) 19.22± 3.57 18.88± 3.34 19.05± 3.46 Sexual maturity (%)
- yes 10 (3.5) 72 (25.9) 82 (14.5)
21
Table 2. Parents Characteristics in the Study I
Variables Fathers (n=567) Mothers (n=567) Age group (%) 20s 0.4 0.5 30s 17.3 34.5 40s 72.9 63.0 50s 9.3 2.0 60s 0.2 -Age (yrs) 43.24± 4.47 41.16± 7.01 Height (kg) 173.00± 5.11 159.88± 5.89 Weight (kg) 74.05± 10.02 56.96± 8.26
Body Mass Index (kg/m2) 24.71± 2.86 22.31± 3.33
22
3.2.2 Study protocol
This study was approved by the Institutional Review Board of Jeju National University (2015-10-003). We distributed 1,746 self-administered questionnaires to the students with the cooperation of their teachers at four elementary schools on October 16, 2015. A total of 1,275 copies were collected by November 13 (73% recovery rate). Questionnaires that were not submitted or were submitted by those who did not agree to participate in the study were excluded, leaving a total of 1,032 copies for analysis. Based on the assumption that all of the parents' questionnaires were submitted (excluding students who did not have a parent questionnaire, or who submitted only one parent questionnaire), 567 copies (567 father’s copies and 567 mother’s copies) were used as data for the final analysis. The questionnaire investigated the subjects' height, weight, maturity, and physical activity (Figure 2).
23
3.2.3 Data sources
1) Student questionnaire
The questionnaire for the students was modified and supplemented with the questionnaire for elementary school students, and the physical activity habit level survey used the International Physical Activity Questionnaire (IPAQ).
(1) Questionnaire on health status
The health status survey was composed of 13 items on subjective health status, sleeping habit, self - esteem, body composition, height, weight, and weight control experience.
(2) Physical activity habit level survey
The physical activity participation time survey was composed of 12 items on sexual maturity, VPA, MPA, walk, sedentary activity, exercise disturbance factor, exercise self-efficacy, etc.
(3) Demographic Survey Questions
The demographic survey consisted of six items on gender, date of birth, residence area, residence duration, living family status,
24 2) Parent questionnaire
The questionnaires for parents were modified and supplemented by the National Health and Nutrition Survey questionnaire, which was used by the Department of Health and Welfare, Ministry of Health and Welfare, in accordance with the design of the study. The PA survey used the International Physical Activity Questionnaires (IPAQ).
(1) Questionnaire on health status
The health status was composed of eight items, including diagnosis of disease, smoking status, drinking status, alcohol consumption, and body image.
(2) Physical health examination of child
The child physical health survey was composed of six items, including diagnosis of the child's disease, obesity among family members, child's body type, and child's weight-control experience.
(3) Physical activity habit level survey
This tool was composed of seven items on VPA, MPA, walking, and sedentary activity.
(4) Demographic Survey Questions
The demographic survey consisted of three items that gathered information on the respondents’ relationship with the student participant, age, education, height, weight, occupation, working style, physical labor intensity, and socioeconomic level.
25 3) Analysis of physical activity level
The IPAQ is a self-report PA measurement tool. In this study, we used a simplified version. PA level was expressed as a metabolic equivalent of task (MET) (min / week) after measuring the level of VPA, MPA, walking, and sedentary time during the previous seven days. We derived continuous scores and categorical classification scores. The continuous score was calculated as the sum of the walking MET, the MPA MET, and the VPA MET; PA of less than 10 minutes was regarded as having no PA. The procedure for the calculating continuous and categorical scores is as follows (IPAQ Research Committee, 2005).
① Continuous score
· Walking MET = 3.3 (MET level) × walking time (min) × day (day)
· Medium physical activity MET = 4.0 (MET level) × moderate physical activity time (min) × day · Vigorous physical activity MET = 8.0 (MET level) × vigorous physical activity time (min) × day ② Categorical score
· Inactivity (category 1): This is the lowest level of PA that is included in subjects not included in categories 2 and 3 and is considered insufficient.
· the lowest activity (category 2): active VPA for more than 20 minutes for more than 3 days per week, PA for more than 30 minutes per day for more than 5 days per week, or a combination of walking, MPA, and VPA for more than 5 days per a week at 600 MET (min / week).
· Health promotion PA (category 3): active VPA for more than 3 days per a week at 1500 MET (min / week), or a combination of walking, MPA, and VPA more than 7 days at 3000 MET (min / week). ③ Considerations in the IPAQ Scoring Process
· In calculating MET-min / week, the time is calculated by switching to minutes. · All intensity PA (walking, MPA, and VPA) can’t be more than 16 hours.
· Walking, MPA, and VPA is calculated by entering 240 minutes if reported to be over 4 hour (or 240 minutes).
26 4) Sexual maturity
To determine the degree of sexual maturity, boys measured the development of their penis and pubic hair, and girls measured the development of their breasts pubic hair. We also investigated whether boys had experience in ganacratia, girls had experienced their menarche, and if there was a start time, the experience of boys and the presence or absence of their menarche were used as a measure of sexual maturity (Tanner, 1962).
5) Body mass index standards
The criterion for obesity in elementary school students was applied as the 95th percentile for BMI for each age (representative value) presented in the 2007 growth chart (Korea Center for Disease Control and Prevention, 2007). The obesity criteria for parents were applied as 25 kg / m2 BMI or more (Korean Society of Obesity, 2001).
① The standards of BMI 95th percentile in boys · 9 years : 23.34
· 10 years : 24.48 · 11 years : 25.50 · 12 years : 26.35
② The standards of BMI 95th percentile in grils · 9 years : 22.09
· 10 years : 23.08 · 11 years : 23.99 · 12 years : 24.77
27
3.2.4 Statistical analysis
Statistical Package for the Social Sciences (SPSS version 18.0 for Windows; SPSS Inc., Chicago, IL, USA) was used for all statistical analysis.
1) The categorical variable described the measurement items in term of their frequency, whereas continuous variable were calculated for mean, standard deviation, and median values.
2) All data were divided into boy and girl students, father and mother, obesity (normal, obese) taking into consideration the physical and behavioral characteristics of the subjects. Statistical significance was defined as p < .05.
3) Pearson's correlation method was used to analyze the relationship between BMI and the log-transformed value of subjects.
28
3.3 Results
The results of Study 1 for levels of obesity and PA habit are as follows.
3.3.1 Survey for Obesity Frequency
1) Obesity Frequency by Genders
Results for the obesity frequency by genders are shown in <Table 3>. Of the sample, 12.5% of the boys and 13.6% of the girls were obese.
Table 3. Frequency of Obesity by Genders
Variable Boys (%) Girls (%) Total (%)
Frequency 36 (12.5) 38 (13.6) 206 (13.1)
By the BMI standard of ≥ inclusion in the 95th percentile BMI: body mass index
2) Obesity Frequency by Parents
Results for the obesity frequency by parent are shown in <Table 4>. A total of 42.5% of fathers were and 16.2% of mothers were obese.
Table 4. Frequency of Obesity by Parents
Variable Fathers (%) Mothers (%) Total (%)
Frequency 241 (42.5) 92 (16.2) 333 (29.4)
By the BMI standard of ≥ inclusion in 25 kg/m2 BMI: body mass index
29
3.3.2 Survey for the level of physical activity habit and sedentary time
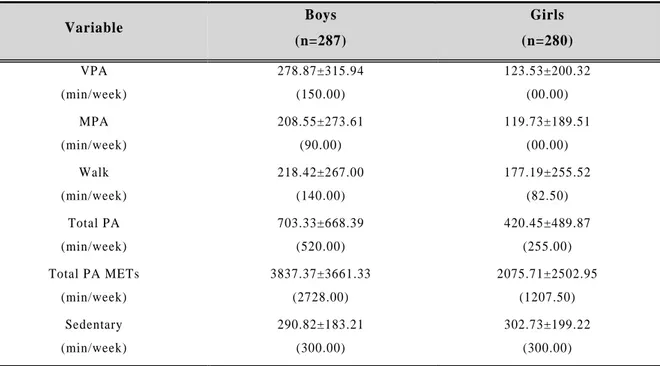
1) Mean values of physical activity habit and sedentary time by genders
The mean values of PA habit by genders are shown in <Table 5>. Boys had a higher mean value for PA habit than girls.
Table 5. Mean Values of Physical Activity Habit and Sedentary Time by Genders
Variable Boys (n=287) Girls (n=280) VPA (min/week) 278.87± 315.94 (150.00) 123.53± 200.32 (00.00) MPA (min/week) 208.55± 273.61 (90.00) 119.73± 189.51 (00.00) Walk (min/week) 218.42± 267.00 (140.00) 177.19± 255.52 (82.50) Total PA (min/week) 703.33± 668.39 (520.00) 420.45± 489.87 (255.00) Total PA METs (min/week) 3837.37± 3661.33 (2728.00) 2075.71± 2502.95 (1207.50) Sedentary (min/week) 290.82± 183.21 (300.00) 302.73± 199.22 (300.00) Mean± Standard Deviation (median value)
METs: metabolic equivalent of task, MPA: moderate physical activity, Total PA: total physical activity, VPA: vigorous physical activity.
30
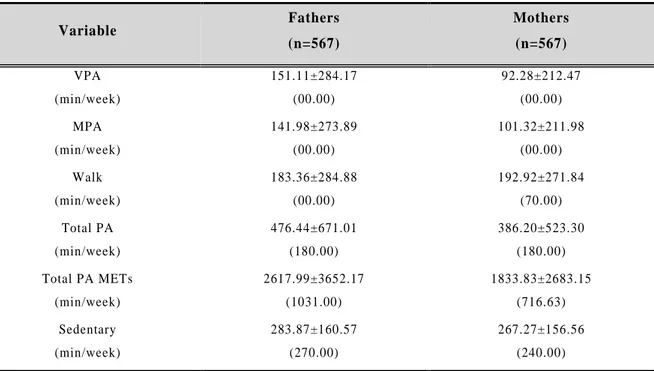
2) Mean values of physical activity habit and sedentary time by parent
The mean values of PA habit and sedentary time by parents are shown in <Table 6>. Fathers had a higher mean value for PA than mothers.
Table 6. Mean Values of Physical Activity Habit and Sedentary Time by Parents
Variable Fathers (n=567) Mothers (n=567) VPA (min/week) 151.11± 284.17 (00.00) 92.28± 212.47 (00.00) MPA (min/week) 141.98± 273.89 (00.00) 101.32± 211.98 (00.00) Walk (min/week) 183.36± 284.88 (00.00) 192.92± 271.84 (70.00) Total PA (min/week) 476.44± 671.01 (180.00) 386.20± 523.30 (180.00) Total PA METs (min/week) 2617.99± 3652.17 (1031.00) 1833.83± 2683.15 (716.63) Sedentary (min/week) 283.87± 160.57 (270.00) 267.27± 156.56 (240.00) Mean± Standard Deviation (median value)
METs: metabolic equivalent of task, MPA: moderate physical activity, Total PA: total p hysical activity, VPA: vigorous physical activity.
31
3) Classification by metabolic equivalent of task between genders
<Table 7> lists the classification by METs between genders. A total of 34.2% of the subjects performed HEPA, and 36.7%, MA. Meanwhile, 29.1% were classified as inactive (less than 600 METs).
Table 7. Classification by Metabolic Equivalent of Task among Genders
Variable Boys (%) Girls (%) Total (%) (n=567) Normal (n=251) Obese (n=36) Normal (n=242) Obese (n=38) HEPA (≥ 3,000) 45.4 38.9 23.6 23.7 34.2 MA (≥ 600) 33.1 33.3 40.5 39.5 36.7 Inactive (< 600) 21.5 27.8 36.0 36.8 29.1
by BMI standard ≥ 95th percentile by IPAQ standard METs (min/week)
32
4) Classification by metabolic equivalent of task among parents
<Table 8> gives the classification by METs among parents. A total of 23.5% of the subjects performed HEPA, and 28.0%, MA. Meanwhile, 48.5% were classified as inactive (less than 600 METs).
Table 8. Classification by Metabolic Equivalent of Task among Parents
Variable Fathers (%) Mothers (%) Total (%) (n=1,134) Normal (n=326) Obese (n=241) Normal (n=475) Obese (n=92) HEPA (≥ 3,000) 24.5 30.9 17.1 30.4 23.5 MA (≥ 600) 23.3 24.9 34.4 19.6 28.0 Inactive (< 600) 52.1 44.4 48.0 50.0 48.5 by BMI standard ≥ 25 kg/m2 by IPAQ standard METs (min/week)
33
3.3.3 Correlation between levels of obesity and physical activity
1) Correlation between levels of physical activity and body mass index among boys and girls As shown in <Table 9>, both boys and girls had a negative correlation with PA and BMI.
Table 9. Correlation between Levels of Physical Activity and Body Mass Index among Genders Correlation R p Walk Total PA Total PA METs Sedentary Boys -.032 .587 -.114 .054 -.105 .080 -.011 .881 Girls -.023 .704 -.048 .423 -.067 .268 .063 .441
34
2) Correlation between levels of physical activity and body mass index among parents
Correlations between the level of PA and BMI among parents are shown in <Table 10>. Fathers had a negative correlation between PA and BMI, but total PA METs of mothers were a positively correlated with BMI.
Table 10. Correlation Between Levels of Physical Activity and Body Mass Index among Parents Correlation R p Walk Total PA Total PA METs Sedentary Fathers .070 .095 .073 .082 .054 .226 .012 .848 Mothers .030 .479 .069 .101 .089 .037 .004 .939
35 3) Correlation of body mass index between parents-children
<Table 11> gives the correlations of BMI between parents and children. Parents’ BMI was positively correlated with the boy’s BMI, whereas mothers’ BMI was positively correlated with boys’ and girls’ BMI.
Table 11. Correlation of Body Mass Index between Parents -Children
Correlation R p Fathers Mothers Boys .081 .172 .117 .048 Girls .188 .002 .241 <.001 BMI: body mass index
36
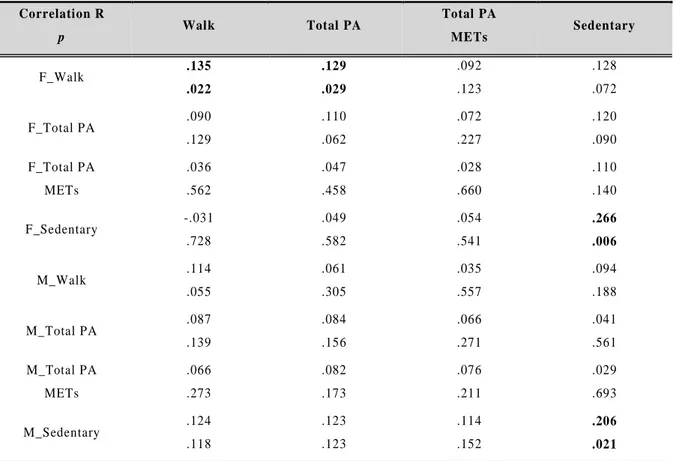
4) Correlation of physical activity level between parents and boys
<Table 12> lists the findings on the correlation of PA levels between parents and boys. Fathers’ walking was positively correlated with boys’ walking and total PA. Parents’ sedentary time was positively correlated with boys’ sedentary time.
Table 12. Correlation of Physical Activity Level between Parents and Boys
Correlation R p Walk Total PA Total PA METs Sedentary F_Walk .135 .022 .129 .029 .092 .123 .128 .072 F_Total PA .090 .129 .110 .062 .072 .227 .120 .090 F_Total PA METs .036 .562 .047 .458 .028 .660 .110 .140 F_Sedentary -.031 .728 .049 .582 .054 .541 .266 .006 M_Walk .114 .055 .061 .305 .035 .557 .094 .188 M_Total PA .087 .139 .084 .156 .066 .271 .041 .561 M_Total PA METs .066 .273 .082 .173 .076 .211 .029 .693 M_Sedentary .124 .118 .123 .123 .114 .152 .206 .021 F: Fathers, M: Mothers, METs: metabolic equivalent of task, Total PA: total physical activity.
37
5) Correlation of physical activity level between parents and girls
<Table 13> shows the correlation of PA level between parents and girls. Walking, total PA, and total PA METs of fathers was positively correlated with total PA METs of girls. Walking and total PA of mothers was positively correlated with total PA, and total PA METs of girls.
Table 13. Correlation of Physical Activity Level between Girls and Parents
Correlation R p Walk Total PA Total PA METs Sedentary F_Walk .040 .509 .110 .066 .126 .037 .020 .807 F_Total PA -.003 .967 .098 .101 .119 .049 .028 .730 F_Total PA METs .005 .934 .109 .081 .128 .041 .020 .818 F_Sedentary -.045 .633 -.113 .229 -.122 .198 .035 .799 M_Walk .096 .108 .099 .097 .090 .137 .069 .404 M_Total PA .108 .072 .121 .043 .122 .042 .090 .275 M_Total PA METs .114 .059 .130 .032 .135 .026 .101 .223 M_Sedentary -.023 .780 -.021 .794 -.028 .736 .179 .091 F: Fathers, M: Mothers, METs: metabolic equiv alent of task, Total PA: total physical activity.
38
4. Study II: Survey of Health Status
Development of Metabolic Syndrome by the
Level of Physical Fitness
39
4.1 Purpose of the study
This study aimed to analyze the development of MS according to obesity and PF levels by measuring the levels of obesity and PA, PF and MS factors in elementary school students.
4.2 Materials and methods
4.2.1 Subjects
This study was conducted with fourth- and fifth-grade students (10 to 11 years old) in three Jeju elementary schools (two in Jeju-si, one from outside the town). The participants were selected through the cooperation of the Jeju Special Self - Governing Province Education Office and teachers of the elementary schools. The study recruited a total of 390 subjects (212 boys and 178 girls). Excluding two students who did not have a questionnaire and 10 students who did not participate, the study recruited a total of 378 subjects (202 boys and 176 girls) who submitted their consent to participate in the research. The study protocol was explained to the prospective volunteer subjects, and those who provided consent form agreements signed by themselves, and their parents were selected to participate. The participants’ characteristics are shown in <Table 14>.
Table 14. Participants Characteristics in the Study II
Variables Boys (n=202) Girls (n=176) Total (n=378) Grade (%) 4th 101 (50) 90 (51.1) 191 (50.5) 5th 101 (50) 86 (48.9) 187 (49.5) Age (yrs) 10.61± 0.61 10.48± 0.51 10.55± 0.58 Height (kg) 145.13± 6.89 145.45± 7.39 145.28± 7.12 Weight (kg) 46.24± 12.74 43.40± 11.45 44.92± 12.22 Body Mass Index (kg/m2) 21.67± 4.52 20.27± 3.97 21.02± 4.32
Sexual maturity (%)
- yes 3 (1.5) 33 (19.1) 36 (9.52)
40
4.2.2 Study protocol
This study was approved by the Research Ethics Review Committee of Cheju National University (IRB JEJUNUH 2015-10-003). The subjects were selected from students who agreed to participate in the study among the students who were found to have moderate abnormal obesity at anthropometry measurements in the first half of 2015. The survey was conducted from October 13, 2015 to October 27, 2015, and all researchers (in the fields of medicine, physical education, and nutrition) visited directly in accordance with the schedule of the school. The investigations conducted anthropometric measurements, physical fitness measurements, blood analysis, one-on-one diet interviews, and a self - administered survey. A total of 421 copies of the questionnaires were distributed and 390 copies were collected (recovery rate 92.6%). Once students who failed to submit questionnaires or who opted out of the survey were excluded, a total of 378 students remained, and these were used for the analysis.
41
4.2.3 Data sources
1) Anthropometric measurements
The height and weight of the participants, barefoot and in casual clothes, were taken using JENIX auto measuring equipment (DONGSAN JENIX, Seoul, Korea). BMI was calculated as weight (kg) divided by height squared (m2). WC was measured at the thinnest circumference between the iliac ridge and the twelfth rib in the arm of the participants at a relaxed state. The hip circumference (HC) was measured at participant’s hips, from the most protrusive area behind the hips, symphysis pubis, and the thickest point connecting greater trochanter, in a relaxed state. The body composition was measured for skeletal muscle mass (SMM), lean body mass (LBM), body fat mass (BFM), and PBF using Inbody 720 (Biospace Co., Korea), as a precision body composition analyzer using bioelectrical impedance analysis (BIA).
2) Blood pressure
Blood pressure (BP) was measured as systolic blood pressure (SBP) and diastolic blood pressure (DBP) in the left upper arm when the participants had relaxed for at least five minutes. The reading was taken using an automatic blood pressure monitor (OMRON HEM-770A, Japan).
3) Blood collection and analysis
The blood collection process was as follows: 1) All blood samples were collected from the subjects between 08:00 and 09:00 after a 12 h fast. 2) Before blood collection, the participants were stabilized for about 30 minutes; venous blood was then collected from the upper arm vein using a thermionic tube without any anti-coagulant. 3) After blood collection, the blood samples were centrifuged at 3,000 rpm for 15 minutes; blood plasma was isolated and stored at -80 °C. 4) The blood plasma was analyzed for levels of FG, TG, total cholesterol (TC), HDL-C, LDL-C, and fasting insulin (FI). FG was measured using the hexokinase method, and TG, using the glycerol blanked method. TC was measured using the enzyme method. HDL-C was measured using a clinical chemo-immunoassay (Olympus AU5400, Japan) by the direct selective method. LDL-C was calculated using the formula of Friedewald, Levy, and
42
Fredrickson (1972) (LDL-C = TC - HDL-C - TG ÷ 5). FI was measured using the immunoassay system (Advia Centaur XP, Siemens, USA) by chemiluminescent immunoassay. The blood analysis was performed at Jeju University Hospital.
4) Insulin resistance
Insulin resistance was analyzed according to the HOMA-IR; the calculation formula is as follows (Matthews et al., 1985):
HOMA-IR = FI (μU/mL) × FG (mg/dL) / 405
5) Metabolic Syndrome (MS)
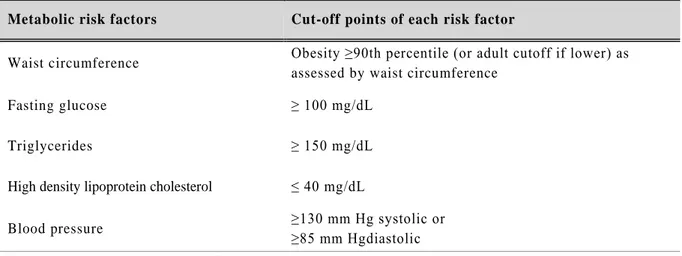
This study used the Pediatric Adolescent Standards defined by the International Diabetes Federation (IDF) in 2007. The diagnostic criteria are given in <Table 15>. The IDF diagnostic criteria published in 2007 are diagnosed as MS when it certainly includes abdominal obesity and has two or more of the remaining four components. MS is not defined in children under 10 years of age, and different criteria are used for the age group of 10–15 years and over 16 years. Diagnostic criteria for those over 16 years old are the same as those for adults.
Table 15. The International Diabetes Federation Definition of the at Risk Group and Metabolic Syndrome in Children and Adolescents
Metabolic risk factors Cut-off points of each risk factor
Waist circumference Obesity ≥90th percentile (or adult cutoff if lower) as assessed by waist circumference
Fasting glucose ≥ 100 mg/dL
Triglycerides ≥ 150 mg/dL
High density lipoprotein cholesterol ≤ 40 mg/dL
Blood pressure ≥130 mm Hg systolic or
≥85 mm Hgdiastolic Metabolic syndrome definition: Three or more of the following by Zimmet et al., 2007
43 6) Physical fitness measurements
PF was examined in terms of muscle strength, muscle endurance, flexibility, and cardiopulmonary fitness, which are suggested health-related physical strength factors (Gordon & Pescatello, 2009). The evaluation of the PF test is based on the criteria of the Physical Activity Promotion System (PAPS) currently applied to elementary, middle, and high school students (Ministry of Education, 2009).
(1) Muscular strength test
Muscle strength is measured grip strength (GS) and back strength (BS) using a dynamometer (DW-701, Japan) and back strength dynamometer (T.K. K.5102, Japan), respectively.
To measure GS, the subjects were asked to stand in a relaxed posture with their legs wide, naturally straightened, and open at the shoulder width, and with both arms at 15° intervals from body. The display of the dynamometer faced outward, and the width was adjusted to fit the hand (the second joint of the finger was at right angles). The subjects were asked to pull “start” for 2 to 3 secs; the peak value was recorded in 0.1-kg increments. To measure BS, the subjects were asked to stand on the foot of the back strength dynamometer with a 15 cm wide stance. The subjects stretched their knees and arms and bent their upper body forward by 30° to hold the grip of the back strength dynamometer. The subjects adjusted the length of the back tension line to fit their height and then pulled it about 10 cm above the knee. The subjects were then asked to tilt their upper body at the “start” signal and pull the handle for 3 sec. This process was performed twice; the peak value is recorded in 0.1 kg units.
The GS and BS were calculated by dividing the measured value by weight (%) taking into consideration the obesity level of the subject; physical fitness was be evaluated according to the level of obesity. The calculation formula is as follows.
44 (2) Muscular endurance test
Muscle endurance was measured by sit-up (SU). The subject was laid down in a comfortable position on their back, and the subject’s knees were bent and such that the heel and the hip were at an angle of ninety degrees. The soles of the feet were kept flat so that they were spaced apart by a gap of one foot size. With the arms extended straight and the hands along the thighs, the upper body was then lifted up and forward so that the palm of the hand could slide up the thigh and wrap around the knee in response to a beeping sound once every three seconds. Then, when the measurer checked the time, the subject immediately went back to the ready position and repeatedly performed the upper SU. If the SU was not maintained for at least one second of the three-second interval, the SU was not counted, and if two in a row were not counted, then the count was terminated. A signal rhythm file for SU with a 'start' signal was played and the performance times were recorded.
.
(3) Flexibility test
Flexibility is measured by sit and reach (SR) using T. K. K.5103 (Japan). Each subject was asked to sit in the correct posture with both soles fully contacting the vertical plane of the measuring instrument; the subject’s two legs were spread open. Then the subject raised both hands, bent forward with the knees fully upright, and then pushed the measuring instrument to the maximum stop as slowly as possible. Then, the subject slowly pushed the instrument to stretch as far forward as possible with two middle fingers; the distance was measured at the point where the fingertip stopped after about two seconds. The subjects performed this method twice and recorded the peak measured values in 0.1 unit.
45 (4) Cardiorespiratory fitness test
Cardiorespiratory fitness was measured using a Progressive Aerobic Cardiovascular Endurance Run (PACER). A mark cone was set up at both ends of a 15 m distance and the subjects were instructed how to perform the shuttle run. After installing the mark cone at both ends of the 15 m distance, the subjects were instructed how to carry out PACER. The subjects started at a set line, and at the “depart” signal, ran across the 15 m distance before the signal from the audio equipment rang. Before the beep, the subjects were expected to arrive at the appointed position on the opposite side. They would wait until the signal sounded before returning to the starting position. If the subjects did not reach the specified position before the signal, they were allowed to change directions when the signal sounded. If the subjects did not reach the specified position before the second signal, they were eliminated. The total number of runs was logged.
46
7) The Physical Activity Promotion System standard and total score calculation
(1) Muscle strength test (Grip Strength)
Table 16. Grip Strength Evaluation Standard (kg)
Grade Level Boys Girls 4 5 4 5 Very Low 8.9∼11.4 9.9∼12.4 8.5∼10.4 10.6∼11.9 Low 11.5∼14.9 12.5∼16.9 10.5∼13.4 12.0∼15.4 Medium 15.0∼18.4 17.0∼22.9 13.5∼17.9 15.5∼18.9 High 18.5∼30.9 23.0∼30.9 18.0∼28.9 19.0∼28.9 Very High 31.0∼36.0 31.0∼37.0 29.0∼33.6 29.0∼35.0
(2) Muscle endurance test (Sit-up)
Table 17. Sit-up Evaluation Standard (num)
Grade Level Boys Girls 4 5 4 5 Very Low 0∼6 0∼9 0∼5 0∼6 Low 7∼21 10∼21 6∼17 7∼22 Medium 22∼39 22∼39 18∼28 23∼35 High 40∼79 40∼79 29∼59 36∼59 Very High 80∼120 80∼120 60∼90 60∼90
(3) Flexibility test (Sit and reach)
Table 18. Sit-up Reach Evaluation Standard (cm)
Grade Level Boys Girls 4 5 4 5 Very Low -5.1∼-4.1 -5.1∼-4.1 -0.1∼0.9 -0.1∼0.9 Low -4.0∼0.9 -4.0∼0.9 1.0∼4.9 1.0∼4.9 Medium 1.0∼4.9 1.0∼4.9 5.0∼6.9 5.0∼6.9 High 5.0∼7.9 5.0∼7.9 7.0∼9.9 7.0∼9.9 Very High 8.0∼18.0 8.0∼18.0 10.0∼22.0 10.0∼22.0