PUBLIC HEALTH WEEKLY REPORT, PHWR
CONTENTS
Vol. 13, No. 32, 2020
감염병 통계
정책 & 가이드
2372
코로나바이러스감염증-19대응지침(지자체용)9-1판소개코로나19 발생보고서
2336
2020년5월이후코로나바이러스감염증-19주요집단발생특징역학·관리보고서
2383
국내아나플라즈마증실험실진단검사,2019년2347
ACOVID-19OutbreakinACounty,RepublicofKoreaCOVID-19 Special Issue
2354
QuarantineResponsetoCOVID-19:TheCOVID-19National QuarantineStationatIncheonAirport2366
AnalysisofCOVID-19QuarantineResultswithAdjusted CriteriaforFlightsfromaHigh-Risk2392
환자감시 : 전수감시, 표본감시 병원체감시 : 인플루엔자 및 호흡기바이러스 급성설사질환, 엔테로바이러스 매개체감시 : 말라리아 매개모기, 일본뇌염 매개모기 중증열성혈소판감소증후군 매개참진드기중앙방역대책본부 환자·접촉자관리단 김영화, 염한솔, 황인섭, 박광숙, 권재우, 김미영, 박영준, 곽진, 박옥* *교신저자 : [email protected] 본 보고서는 2020년 5월 1일부터 7월 31일까지 최근 3개월 간, 「감염병의 예방 및 관리에 관한 법률」 제11조에 따라 의료기관 등에서 질병관리본부 질병보건통합관리시스템을 통해 코로나바이러스감염증-19(코로나19) 환자 등을 신고하고, 중앙 및 지자체 역학조사반이 역학조사한 우리나라의 코로나19 환자 주요 집단발생에 대한 보고서이다. 2020년 7월 31일 기준, 우리나라의 코로나19 전체 확진자는 14,305명, 사망자는 301명이다. 17개 모든 시도에서 확진자가 보고되었으며, 특히 대구, 서울, 경기, 경북 지역에서 많이 발생하였다. 성별로는 여자가 54.8%로 남자보다 높게 발생하였고, 가장 많이 발생한 연령대는 20대(25.3%)였다. 사망자는 60세 이상이 93.0%(280명)였으며, 남자가 53.2%로 여자보다 높았다. 치명률은 2.1%였고, 연령대로 구분하였을 때 80세 이상의 치명률이 24.9%로 가장 높았다. 최근 3개월 간 역학조사 결과 확인된 주요 집단 발생은 클럽, 종교소모임, 물류센터, 방문판매모임, 운동시설 등이며, 그 중 종교소모임, 물류센터, 방문판매모임, 운동시설에서 총 10명이 사망하였다. 주요 검색어 : 코로나바이러스감염증-19, 집단발병, 감염병감시, 역학조사, 생활 속 거리두기
초 록
2020년 5월 이후 코로나바이러스감염증-19
주요 집단 발생 특징
들어가는 말
코로나바이러스감염증-19(코로나19)는 2020년 7월 31일까지 전 세계적으로 17,106,007명이 발생하였고, 우리나라는 2020년 1월 20일 첫 확진자 발생 이후 7월 31일까지 총 14,305명이 발생하였다. 우리나라는 지난 2월 23일부터 현재까지 코로나19 감염병 위기단계를 「심각」수준으로 유지하고 있으며, 국무총리를 본부장으로 하는 중앙재난안전대책본부를 가동하여 범정부적으로 방역에 집중하고 있다. 본 보고서는 ‘생활 속 거리두기’로 전환한 5월 6일 이후 집단 발생 및 산발사례 발생이 지속되고 있는 상황에서, 해외유입을 제외한 주요 집단별 발생 특성을 분석하였다. 의료기관 등에서 신고한 코로나19 발생 자료는 감염경로 확인을 위한 역학조사 결과에 따라 변동될 수 있으며, 지역별 통계는 신고기관의 주소에 기반하여 지자체에서 발표하는 코로나19 발생 현황과 상이할 수 있어 자료의 해석에 주의가 필요하다.몸 말
1. 성, 연령, 지역별 발생 및 사망 특성
확진자의 성별은 여자가 54.8%로 남자보다 많이 발생하였으며, 인구 10만 명당 발생률은 27.6명이었다. 연령별로는 20대가 25.3%로 가장 많았고 그 다음으로는 50대가 17.6%였다. 지역별로는 대구 48.5%, 서울 11.2%, 경기 10.8%, 경북 9.8% 순으로, 대구ㆍ경북 및 수도권을 중심으로 많은 확진자가 발생했음을 알 수 있다. 지역별표 1. 코로나19 성, 연령, 지역별 발생 및 사망 분포(누적) 구분 2020. 1. 20. ~ 7. 31. 0시 기준 발생 사망 총 합계 (명, %) 국내감염 (명, %) 해외유입 (명, %) 인구 10만 명당 발생률 (%) 사망자 (명, %) 치명률 (%) 성 남자 6,463 (45.2) 4,911 (41.2) 1,552 (64.8) 25.0 160 (53.2) 2.5 여자 7,842 (54.8) 6,998 (58.8) 844 (35.2) 30.2 141 (46.8) 1.8 연령대 10세 미만 246 (1.7) 176 (1.5) 70 (2.9) 5.9 - 10~19세 782 (5.5) 609 (5.1) 173 (7.2) 15.8 - 20~29세 3,620 (25.3) 2,779 (23.3) 841 (35.1) 53.2 - 30~39세 1,810 (12.6) 1,211 (10.2) 599 (25.0) 25.7 2 (0.7) 0.1 40~49세 1,930 (13.5) 1,565 (13.1) 365 (15.2) 23.0 3 (1.0) 0.2 50~59세 2,519 (17.6) 2,296 (19.3) 223 (9.3) 29.1 16 (5.3) 0.6 60~69세 1,853 (13.0) 1,749 (14.7) 104 (4.4) 29.2 41 (13.6) 2.2 70~79세 947 (6.6) 931 (7.8) 16 (0.7) 26.3 90 (29.9) 9.5 80세 이상 598 (4.2) 593 (5.0) 5 (0.2) 31.5 149 (49.5) 24.9 지역 서울 1,600 (11.2) 1,260 (10.6) 340 (14.2) 16.4 11 (3.7) 0.7 부산 171 (1.2) 130 (1.1) 41 (1.7) 5.0 3 (1.0) 1.8 대구 6,940 (48.5) 6,881 (57.8) 59 (2.5) 284.8 191 (63.5) 2.8 인천 383 (2.7) 303 (2.5) 80 (3.3) 13.0 2 (0.7) 0.5 광주 204 (1.4) 179 (1.5) 25 (1.0) 14.0 2 (0.7) 1.0 대전 166 (1.2) 147 (1.2) 19 (0.8) 11.3 2 (0.7) 1.2 울산 59 (0.4) 34 (0.3) 25 (1.0) 5.1 1 (0.3) 1.7 세종 50 (0.3) 45 (0.4) 5 (0.2) 14.6 - 경기 1,546 (10.8) 1,137 (9.6) 409 (17.1) 11.7 31 (10.3) 2.0 강원 74 (0.5) 53 (0.4) 21 (0.9) 4.8 3 (1.0) 4.1 충북 73 (0.5) 56 (0.5) 17 (0.7) 4.6 - 충남 190 (1.3) 159 (1.3) 31 (1.3) 9.0 1 (0.3) 0.5 전북 39 (0.3) 18 (0.2) 21 (0.9) 2.1 - 전남 38 (0.3) 17 (0.1) 21 (0.9) 2.0 - 경북 1,401 (9.8) 1,369 (11.5) 32 (1.3) 52.6 54 (17.9) 3.9 경남 159 (1.1) 110 (0.9) 49 (2.1) 4.7 - 제주 26 (0.2) 11 (0.1) 15 (0.6) 3.9 - 검역 1,186 (8.3) - 1,186 (49.5) - - -총 합계 14,305 (100.0) 11,909 (100.0) 2,396 (100.0) 27.6 301 (100.0) 2.1
인구 10만 명당 발생률은 대구 284.8명, 경북 52.6명, 서울 16.4명, 세종 14.6명, 광주 14.0명 순이었다. 사망자의 성별은 남자가 53.2%로 여자보다 많았으며, 치명률은 2.1%였다. 사망자의 93.0%가 60세 이상이었고, 연령이 높을수록 치명률이 증가하여 80세 이상에서의 치명률은 24.9%였다. 지역별로는 사망자 중 63.5%가 대구였고, 경북 17.9%, 경기 10.3% 순이었다(표 1).
2. 주요 집단별 발생 특성
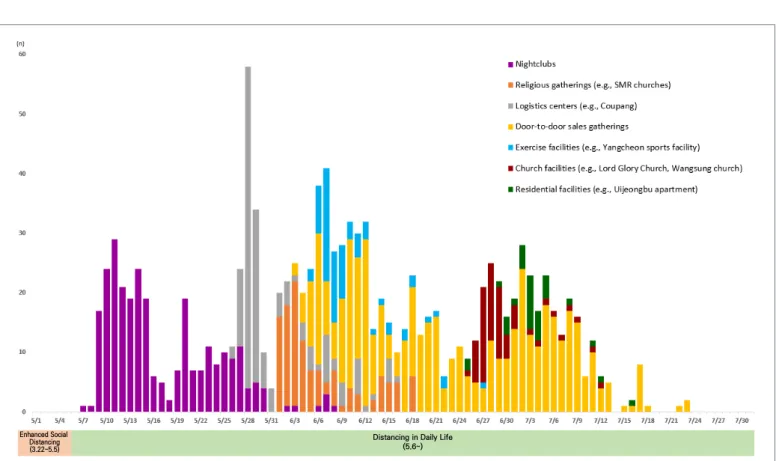
5월 6일 사회적 거리두기에서 ‘생활 속 거리두기’로 전환한 이후, 현재까지 지역사회 소규모 또는 대규모 집단 감염 및 산발적인 감염 사례가 지속되고 있다. 최근 3개월 간 주요 집단별 발생 특성은 다음과 같다(그림 1, 표 2, 표 3, 표 4).가. 클럽 관련(수도권)
서울의 한 클럽을 중 심으 로 다 수의 확진자가 발생한 사례로, 확진자의 74.0%가 남자였고, 연령으로는 20대(44.0%)가 가장 많았다. 전국적으로 확진자가 보고되었으며, 서울(50.2%), 경기(21.3%), 인천(19.5%) 순으로 수도권에서 91%의 확진자가 발생하였다. 확진자의 평균 연령은 33.1세였고, 사망자는 없었다.나. 종교소모임 관련(수도권)
인천 및 서울과 경기 일부 지역에서 성경모임, 목회자모임 등 각종 종교소모임을 통해 확진자가 발생한 사례로, 확진자의 58.0%가 여자였고, 연령으로는 60대(37.0%)가 가장 많았다. 수도권에서만 확진자가 발생하였고, 인천(47.9%), 서울(31.1%), 경기(21.0%) 순이었다. 확진자의 평균 연령은 55.9세였고, 집단 내 생활속 거리두기 (5.6~) 사회적 거리두기 (3.22~5.5) 그림 1. 최근 3개월 코로나19 일별 발생 현황(5.1.~7.31.) * 주요 집단 발생(1,208명): 해외유입, 기타 확진자는 제외확진자 중 1명이 사망하였다.
다. 대형 물류센터 관련(수도권)
경기의 한 대형 물류센터에서 다수의 확진자가 발생한 사례로, 확진자의 53.3%가 여자였고, 연령으로는 30대(23.0%)가 가장 많았다. 수도권에서만 확진자가 발생하였고, 경기(44.1%), 인천(40.1%), 서울(15.8%) 순이었다. 확진자의 평균 연령은 39.2세였고, 집단 내 확진자 중 1명이 사망하였다.라. 방문판매모임 관련(수도권, 광주, 대전)
방문판매모임으로부터 시작하여 각종 소규모 집단까지 확산되어 확진자가 발생한 사례로, 확진자의 62.3%가 여자였고, 연령으로는 60대(30.3%)가 가장 많았다. 서울, 광주, 대전 등 3개 지역에서 각각의 방문판매모임과 관련한 확진자는 광주(28.7%), 서울(26.6%), 경기(19.1%), 대전(11.5%) 순이었으며, 수도권 및 충청호남권 위주로 환자가 발생하였다. 방문판매모임 관련 확진자의 평균 연령은 56.4세였고, 집단 내 사망자는 총 7명(치명률 1.4%) 이었으며 모두 60세 이상이었다.마. 운동시설 관련(수도권)
서울의 한 탁구장을 통해 확진자가 발생한 사례로, 확진자의 52.1%가 남자였고, 연령으로는 50대(41.1%)가 가장 많았다. 수도권에서만 확진자가 발생하였고, 서울(60.3%), 경기(38.3%), 인천(1.4%) 순이었다. 확진자의 평균 연령은 54.6세였고, 집단 내 확진자 중 1명이 사망(치명률 1.4%)하였다.바. 종교시설 관련(서울, 경기)
서울과 경기 두 곳의 종교시설에서 다수의 확진자가 발생한 사례로, 확진자의 성별 분포는 동일하였으며, 연령으로는 20대와 표 2. 최근 3개월 간 성별, 연령별 주요 집단 발생 분포 구분 2020. 5. 1. ~ 7. 31. 0시 기준 주요 집단 전체 (명, %) 클럽 관련 (명, %) 수도권 종교 소모임 관련 (명, %) 대형물류센터 관련 (명, %) 방문판매모임 관련 (명, %) 운동시설 관련 (명, %) 종교시설 관련 (명, %) 주거시설 관련 (명, %) 성별 남자 605 (50.1) 205 (74.0) 50 (42.0) 71 (46.7) 184 (37.7) 38 (52.1) 33 (50.0) 24 (72.7) 여자 603 (49.9) 72 (26.0) 69 (58.0) 81 (53.3) 304 (62.3) 35 (47.9) 33 (50.0) 9 (27.3) 연령대 10세 미만 24 (2.0) 5 (1.8) 1 (0.8) 6 (3.9) 11 (2.3) - 1 (1.5) 10~19세 64 (5.3) 35 (12.6) 3 (2.5) 13 (8.6) 9 (1.8) 2 (2.7) 1 (1.5) 1 (3.0) 20~29세 234 (19.4) 122 (44.0) 6 (5.0) 28 (18.4) 41 (8.4) 6 (8.2) 24 (36.4) 7 (21.2) 30~39세 131 (10.8) 36 (13.0) 3 (2.5) 35 (23.0) 26 (5.3) 3 (4.1) 24 (36.4) 4 (12.1) 40~49세 111 (9.2) 23 (8.3) 11 (9.2) 24 (15.8) 40 (8.2) 9 (12.3) 3 (4.5) 1 (3.0) 50~59세 230 (19.0) 23 (8.3) 37 (31.1) 28 (18.4) 104 (21.3) 30 (41.1) 4 (6.1) 4 (12.1) 60~69세 267 (22.1) 27 (9.7) 44 (37.0) 13 (8.6) 148 (30.3) 13 (17.8) 7 (10.6) 15 (45.5) 70~79세 107 (8.9) 5 (1.8) 12 (10.1) - 83 (17.0) 4 (5.5) 2 (3.0) 1 (3.0) 80세 이상 40 (3.3) 1 (0.4) 2 (1.7) 5 (3.3) 26 (5.3) 6 (8.2) - -계 1,208 (100.0) 277 (100.0) 119 (100.0) 152 (100.0) 488 (100.0) 73 (100.0) 66 (100.0) 33 (100.0) 연령 평균 47.4세 33.1세 55.9세 39.2세 56.4세 54.6세 35.4세 49.8세 중위수 (최소~최대) 51세 (1~95세) 27세 (1~84세) 59세 (7~88세) 37세 (1~90세) 60세 (1~95세) 57세 (11~87세) 30세 (3~79세) 59세 (16~74세)30대가 각각 36.4%로 가장 많았다. 경기(53.0%), 서울(47.0%) 두 지역에서만 확진자가 발생하였다. 확진자의 평균 연령은 35.4세였고, 이 집단 중 사망자는 없었다. 표 4. 최근 3개월 간 주요 집단 발생 내 사망 분포 구분 2020. 5. 1. ~ 7. 31. 0시 기준 주요 집단 전체 (명) 클럽 관련 (명) 수도권 종교 소모임 관련 (명) 대형물류센터 관련 (명) 방문판매모임 관련 (명) 운동시설 관련 (명) 종교시설 관련 (명) 주거시설 관련 (명) 성 남자 3 - - - 2 1 - 여자 7 - 1 1 5 - - -연령대 60~69세 1 - - - 1 - - 70~79세 5 - 1 - 4 - - 80세 이상 4 - - 1 2 1 - -계 10 - 1 1 7 1 - -치명률 (%) 0.8 - 0.8 0.7 1.4 1.4 - -* 60세 미만 사망자 없음 표 3. 최근 3개월 간 지역별 주요 집단 발생 분포 구분 2020. 5. 1. ~ 7. 31. 0시 기준 주요 집단 전체 (명, %) 클럽 관련 (명, %) 수도권 종교 소모임 관련 (명, %) 대형물류센터 관련 (명, %) 방문판매모임 관련 (명, %) 운동시설 관련 (명, %) 종교시설 관련 (명, %) 주거시설 관련 (명, %) 지역 서울 415 (34.4) 139 (50.2) 37 (31.1) 24 (15.8) 130 (26.6) 44 (60.3) 31 (47.0) 10 (30.3) 부산 4 (0.3) 4 (1.4) - - - 대구 2 (0.2) 2 (0.7) - - - 인천 205 (17.0) 54 (19.5) 57 (47.9) 61 (40.1) 32 (6.6) 1 (1.4) - 광주 140 (11.6) - - - 140 (28.7) - - 대전 57 (4.7) 1 (0.4) - - 56 (11.5) - - 울산 - - - 세종 2 (0.2) - - - 2 (0.4) - - 경기 329 (27.2) 59 (21.3) 25 (21.0) 67 (44.1) 93 (19.1) 28 (38.3) 35 (53.0) 22 (66.7) 강원 7 (0.6) 2 (0.7) - - 4 (0.8) - - 1 (3.0) 충북 9 (0.7) 9 (3.2) - - - 충남 19 (1.6) 1 (0.4) - - 18 (3.7) - - 전북 7 (0.6) 2 (0.7) - - 5 (1.0) - - 전남 8 (0.7) - - - 8 (1.6) - - 경북 1 (0.1) 1 (0.4) - - - 경남 2 (0.2) 2 (0.7) - - - 제주 1 (0.1) 1 (0.4) - - - -계 1,208 (100.0) 277 (100.0) 119 (100.0) 152 (100.0) 488 (100.0) 73 (100.0) 66 (100.0) 33 (100.0)
사. 주거시설 관련(서울, 경기)
경기의 한 아파트를 중심으로 다수의 확진자가 발생한 사례로, 확진자의 72.7%가 남자였고, 연령으로는 60대(45.5%)가 가장 많았다. 경기(66.7%), 서울(30.3%), 강원(3.0%)으로 세 지역에서만 확진자가 발생하였다. 확진자의 평균 연령은 49.8세였고, 이 집단 중 사망자는 없었다.맺는 말
우리나라는 2020년 1월 20일 국내 첫 확진자 발생 이후 2020년 7월 31일까지 총 14,305명의 환자가 발생하였다. 본 보고서에서는 최근 3개월 간 해외유입을 제외한 주요 집단 발생 특성을 살펴보고자 하였다. 지난 5월 초 연휴 이후에 생활 속 거리두기 전환을 기점으로 방문판매, 종교시설, 다중이용시설 등을 중심으로, 주로 수도권, 호남권에서 소규모 및 대규모 감염 사례가 계속 발생하였다. 국내 발생은 소규모 전파가 지속적으로 발생하고 있어, 국내 발생 전파 차단을 위해서는 방역수칙을 지속적으로 준수하는 것이 필요하다. 8월을 맞이하여 안전한 여름휴가를 보낼 수 있도록, 실내에서는 마스크를 상시 착용하고, 휴게소, 식당·카페 등 음식점에서는 최소시간 머무르며 음식물 섭취 시 외에는 대화를 자제하며, 손을 자주 씻고 거리두기도 계속 유지하는 것이 필요하다. 또한 발열이나 호흡기 증상이 있으면 여행가지 않고 집에 머무르며, 증상 악화 시 콜센터나 보건소에 문의하고, 밀폐·밀접한 장소나 혼잡한 여행지 및 시간대는 피하며, 침방울이 튀는 행위나 신체접촉은 자제해야 한다. 지역사회 감염을 차단하기 위해서는 일상에서 항상 방역수칙을 준수하는 것이 중요하다. 감염 위험이 높은 장소 및 시설에 대해, 보다 적극적인 방역 대책을 마련할 필요성이 있다. ① 이전에 알려진 내용은? 2020년 1월 중국에서 코로나19 발생이 보고된 이후, 우리나라뿐만 아니라 전 세계적으로 환자 발생이 지속적으로 보고되고 있다. ② 새로이 알게 된 내용은? 우리나라의 코로나19 확진자는 7월 31일 기준 총 14,305명 발생하였고, 그 중 301명이 사망하였다. 5월 초 생활 속 거리두기 전환 이후 발생한 지역사회 주요 집단 감염 사례별 특성을 살펴보았고, 지역사회에서 방역을 강화해야 할 집단이 어떤 것들이 있는 지 알 수 있었다. ③ 시사점은? 중앙방역대책본부는 「감염병예방법」에 의해 의료기관 등에서 코 로나19 환자 등 을 신고하고, 중앙 및 지자체 역학조사반이 역학조사 한 결과를 바탕으로, 최근 3개월 간 우리나라의 코로나19 환자 주요 집단 발생 동향을 분석하고 결과를 공유하여, 앞으로의 코로나19 발생에 보다 효과적인 대응전략 및 방역 조치 수립에 활용할 수 있게 하였다.참고문헌
1. WHO. Coronavirus disease (COVID-2019) Situation reports - 193 [31 JULY 2020], Available from: https://www.who.int/emergencies/ diseases/novel-coronavirus-2019/situation-reports
2. KCDC [internet]. Available from: http://ncov.mohw.go.kr.
3. 질병관리본부 코로나바이러스감염증-19 중앙방역대책본부. 한국 초기 코로나바이러스감염증-19 환자 28명의 역학적 특성. 주간 건강과 질병. 2020;13(9):464-474.
Coronavirus Disease-19 (COVID-19) 3-month outbreak infection report as of
July 31, 2020, in the Republic of Korea
Kim Younghwa, Yeom Hansol, Hwang Insob, Park Kwangsuk, Kwon Jaewoo, Kim Miyoung, Park Young Joon, Gwack Jin, Park Ok Case and Contact Management Task Force, Central Disease Control Headquarters
This 3-month report (May 1, 2020 to July 31, 2020) on the Coronavirus Disease-19 (COVID-19) situation in Korea was conducted by the disease management division of the Korea Centers for Disease Control and Prevention (KCDC). This report was based on the number of confirmed cases reported through the integrated system in accordance with Article 11 of the 「Infectious Disease Prevention and Management Act」 and on epidemiological investigations conducted by central and local health authorities.
By July 31, 2020, there were 14,305 confirmed cases of COVID-19; including 301 deaths. Confirmed cases were reported in all 17 provinces and provinces and cities in Korea, with the highest number of cases recorded in the provinces of Gyeonggi and Gyeongbuk and in the cities of Daegu and Seoul. The majority of these cases were from cluster outbreaks.
The major cluster outbreaks confirmed by epidemiological investigation over a 3-month period included nightclubs, religious gatherings (e.g., SMR churches), logistics centers (e.g., Coupang), door-to-door sales gatherings, exercise facilities (e.g., Yangcheon sports facility), church facilities (e.g., Lord Glory Church, Wangsung church) and residential facilities (e.g., Uijeongbu apartment).
Keywords: 2019 Novel Coronavirus (2019-nCoV), Coronavirus Disease-19 (COVID-19), Outbreaks, Epidemiological monitoring,
Table 1. The number of confirmed/deceased cases and the incidence rate
January 20, 2020 - July 31, 2020
Confirmed cases Deaths
Total (n, %) Domestic cases (n, %) Imported cases (n, %) Incidence rate (n, per 0.1M population) Total (n, %) Fatality rate Gender Male 6,463 (45.2) 4,911 (41.2) 1,552 (64.8) 25.0 160 (53.2) 2.5 Female 7,842 (54.8) 6,998 (58.8) 844 (35.2) 30.2 141 (46.8) 1.8
Age group (yrs)
≤9 246 (1.7) 176 (1.5) 70 (2.9) 5.9 - 10-19 782 (5.5) 609 (5.1) 173 (7.2) 15.8 - 20-29 3,620 (25.3) 2,779 (23.3) 841 (35.1) 53.2 - 30-39 1,810 (12.6) 1,211 (10.2) 599 (25.0) 25.7 2 (0.7) 0.1 40-49 1,930 (13.5) 1,565 (13.1) 365 (15.2) 23.0 3 (1.0) 0.2 50-59 2,519 (17.6) 2,296 (19.3) 223 (9.3) 29.1 16 (5.3) 0.6 60-69 1,853 (13.0) 1,749 (14.7) 104 (4.4) 29.2 41 (13.6) 2.2 70-79 947 (6.6) 931 (7.8) 16 (0.7) 26.3 90 (29.9) 9.5 ≥80 598 (4.2) 593 (5.0) 5 (0.2) 31.5 149 (49.5) 24.9 Region Seoul 1,600 (11.2) 1,260 (10.6) 340 (14.2) 16.4 11 (3.7) 0.7 Busan 171 (1.2) 130 (1.1) 41 (1.7) 5.0 3 (1.0) 1.8 Daegu 6,940 (48.5) 6,881 (57.8) 59 (2.5) 284.8 191 (63.5) 2.8 Incheon 383 (2.7) 303 (2.5) 80 (3.3) 13.0 2 (0.7) 0.5 Gwangju 204 (1.4) 179 (1.5) 25 (1.0) 14.0 2 (0.7) 1.0 Daejeon 166 (1.2) 147 (1.2) 19 (0.8) 11.3 2 (0.7) 1.2 Ulsan 59 (0.4) 34 (0.3) 25 (1.0) 5.1 1 (0.3) 1.7 Sejong 50 (0.3) 45 (0.4) 5 (0.2) 14.6 - Gyeonggi 1,546 (10.8) 1,137 (9.6) 409 (17.1) 11.7 31 (10.3) 2.0 Gangwon 74 (0.5) 53 (0.4) 21 (0.9) 4.8 3 (1.0) 4.1 Chungbuk 73 (0.5) 56 (0.5) 17 (0.7) 4.6 - Chungnam 190 (1.3) 159 (1.3) 31 (1.3) 9.0 1 (0.3) 0.5 Jeonbuk 39 (0.3) 18 (0.2) 21 (0.9) 2.1 - Jeonnam 38 (0.3) 17 (0.1) 21 (0.9) 2.0 - Gyeongbuk 1,401 (9.8) 1,369 (11.5) 32 (1.3) 52.6 54 (17.9) 3.9 Gyeongnam 159 (1.1) 110 (0.9) 49 (2.1) 4.7 - JeJu 26 (0.2) 11 (0.1) 15 (0.6) 3.9 - Airport Screening 1,186 (8.3) - 1,186 (49.5) - - -Total 14,305 (100.0) 11,909 (100.0) 2,396 (100.0) 27.6 301 (100.0) 2.1
Table 2. Case status and the distribution by age and gender of the major clusters (3-month period) May 1, 2020 - July 31, 2020 Major clusters Total (n, %) Nightclubs (n, %) Religious gatherings: SMR churches (n, %) Logistics centers: Coupang (n, %) Door-to-door sales gatherings (n, %) Exercise facilities: Yangcheon sports facility (n, %) Church facilities* (n, %) Residential facilities: Uijeongbu apartment (n, %) Gender Male 605 (50.1) 205 (74.0) 50 (42.0) 71 (46.7) 184 (37.7) 38 (52.1) 33 (50.0) 24 (72.7) Female 603 (49.9) 72 (26.0) 69 (58.0) 81 (53.3) 304 (62.3) 35 (47.9) 33 (50.0) 9 (27.3)
Age group (yrs)
≤9 24 (2.0) 5 (1.8) 1 (0.8) 6 (3.9) 11 (2.3) - 1 (1.5) 10-19 64 (5.3) 35 (12.6) 3 (2.5) 13 (8.6) 9 (1.8) 2 (2.7) 1 (1.5) 1 (3.0) 20-29 234 (19.4) 122 (44.0) 6 (5.0) 28 (18.4) 41 (8.4) 6 (8.2) 24 (36.4) 7 (21.2) 30-39 131 (10.8) 36 (13.0) 3 (2.5) 35 (23.0) 26 (5.3) 3 (4.1) 24 (36.4) 4 (12.1) 40-49 111 (9.2) 23 (8.3) 11 (9.2) 24 (15.8) 40 (8.2) 9 (12.3) 3 (4.5) 1 (3.0) 50-59 230 (19.0) 23 (8.3) 37 (31.1) 28 (18.4) 104 (21.3) 30 (41.1) 4 (6.1) 4 (12.1) 60-69 267 (22.1) 27 (9.7) 44 (37.0) 13 (8.6) 148 (30.3) 13 (17.8) 7 (10.6) 15 (45.5) 70-79 107 (8.9) 5 (1.8) 12 (10.1) - 83 (17.0) 4 (5.5) 2 (3.0) 1 (3.0) ≥80 40 (3.3) 1 (0.4) 2 (1.7) 5 (3.3) 26 (5.3) 6 (8.2) - -Total 1,208 (100.0) 277 (100.0) 119 (100.0) 152 (100.0) 488 (100.0) 73 (100.0) 66 (100.0) 33 (100.0) Mean (yrs) 47.4 33.1 55.9 39.2 56.4 54.6 35.4 49.8 median (min-max) 51 (1 - 95) 27 (1 - 84) 59 (7 - 88) 37 (1 - 90) 60 (1 - 95) 57 (11 - 87) 30 (3 - 79) 59 (16 - 74)
Table 3. Case status and the distribution by region of the major clusters (3-month period) May 1, 2020 - July 31, 2020 Major clusters Total (n, %) Nightclubs (n, %) Religious gatherings: SMR churches (n, %) Logistics centers: Coupang (n, %) Door-to-door sales gatherings (n, %) Exercise facilities: Yangcheon sports facility (n, %) Church facilities* (n, %) Residential facilities: Uijeongbu apartment (n, %) Region Seoul 415 (34.4) 139 (50.2) 37 (31.1) 24 (15.8) 130 (26.6) 44 (60.3) 31 (47.0) 10 (30.3) Busan 4 (0.3) 4 (1.4) - - - Daegu 2 (0.2) 2 (0.7) - - - Incheon 205 (17.0) 54 (19.5) 57 (47.9) 61 (40.1) 32 (6.6) 1 (1.4) - Gwangju 140 (11.6) - - - 140 (28.7) - - Daejeon 57 (4.7) 1 (0.4) - - 56 (11.5) - - Ulsan - - - Sejong 2 (0.2) - - - 2 (0.4) - - Gyeonggi 329 (27.2) 59 (21.3) 25 (21.0) 67 (44.1) 93 (19.1) 28 (38.3) 35 (53.0) 22 (66.7) Gangwon 7 (0.6) 2 (0.7) - - 4 (0.8) - - 1 (3.0) Chungbuk 9 (0.7) 9 (3.2) - - - Chungnam 19 (1.6) 1 (0.4) - - 18 (3.7) - - Jeonbuk 7 (0.6) 2 (0.7) - - 5 (1.0) - - Jeonnam 8 (0.7) - - - 8 (1.6) - - Gyeongbuk 1 (0.1) 1 (0.4) - - - Gyeongnam 2 (0.2) 2 (0.7) - - - JeJu 1 (0.1) 1 (0.4) - - - -Total 1,208 (100.0) 277 (100.0) 119 (100.0) 152 (100.0) 488 (100.0) 73 (100.0) 66 (100.0) 33 (100.0)
Table 4. Death status and the distribution by age and gender of the major clusters (3-month period) May 1, 2020 - July 31, 2020 Major clusters Total (n) Nightclubs (n) Religious gatherings: SMR churches (n) Logistics centers: Coupang (n) Door-to-door sales gatherings (n) Exercise facilities: Yangcheon sports facility (n) Church facilities (n) Residential facilities: Uijeongbu apartment (n) Gender Male 3 - - - 2 1 - Female 7 - 1 1 5 - -
-Age group (yrs)*
60-69 1 - - - 1 - - 70-79 5 - 1 - 4 - - ≥80 4 - - 1 2 1 - -Total 10 - 1 1 7 1 - -Fatality rate 0.8 - 0.8 0.7 1.4 1.4 -
-* No deaths under the age of 60
Enhanced Social Distancing (3.22~5.5)
Distancing in Daily Life (5.6~)
Figure 1. The progression of major cluster outbreak from May 1 to July 31, 2020
Introduction
In South Korea, by midnight on April 12, 2020, a total of 10,537 positive cases of coronavirus disease 2019 (COVID-19) had been recorded, with 217 deaths [1]. From the first reported case on January 20 to February 20, when an outbreak related to the Shincheonji religious group started, the average number of
new positive cases per day was 1.5 [2]. However, with the surge in cases due to the community outbreak among Shincheonji followers in the Daegu and Gyeongbuk region, the number of new cases per day peaked at 813 on February 29. Subsequently, the central government’s infection control and social distancing measures reduced the number of new cases, which dropped to 25 by April 13. However, additional localized outbreaks have been
A COVID-19 Outbreak in A County, Republic of Korea
A total of eleven coronavirus infection-19 (COVID-19) cases were reported on April 5th, 2020 after the first confirmed case was reported in A County on March 24th, 2020. A County is Chungcheongnam-do Province. The Chungcheongnam-do rapid response team and the A County Health Center conducted an epidemiological survey to identify the outbreak, determine the extent of the outbreak, prevent transmission, and prevent further outbreaks.
This report examined the epidemiological investigation process of the eleven confirmed case by using the data of the A County Health Center and the on-site epidemiological investigation report of the rapid response team. In addition, this report calculated and analyzed the general characteristics.
The report found that nine out of the eleven confirmed cases occurred at a church gathering. Furthermore, an epidemiological survey confirmed that some of the church's congregation wore masks with inadequate protection and many worshippers did not observe social distancing. A complete survey was conducted on April 1st for the individuals who attended the last worship which is on March 22nd to confirm cases and then conducted total complete survey on April 3rd for the rest in the church, but there were no additional confirmed cases. Out of the eleven cases, one was an imported case and one was a confirmed case from a community with no epidemiological connection. The report found the following general characteristics of the eleven confirmed cases. There were-five males (45.5%) and, six females (55.5%). The average age was 49.8 (21-78) with a median age of 48. Ten cases were domestic (90.9%), and one case was an imported case from Britain (9.1%). In terms of initial symptoms, six cases (25.0 %) had fever or heat sensation, five had cough or sputum (20.8 %), and four patients (16.7 %) had chills. The initial symptoms of the confirmed cases were mostly minor and non-specific and were not significantly much different from known COVID-19 cases. A total of 121 people were classified according to the guidelines as contact persons of the eleven confirmed cases. The contact cases were managed by A County Health Center. This report concluded that locations that foster large gatherings, such as those found in religious facilities, must be managed by establishing effective response strategies and by sharing epidemiological and clinical analysis data on COVID-19.
Keywords: Coronavirus Disease-19 (COVID-19), Church, Outbreaks, Epidemiological monitoring
reported in relation to closed spaces where close contact among people occurs for a prolonged period of time, such as a church in Seongnam, a church in Suwon, and a church in Busan. Similarly, outbreaks have been reported in other countries in closed spaces where frequent person-to-person contact occurs, such as a jail in China and residential care facilities in the United States [3].
Chungcheongnam-do Province first reported a case in Gyeryong on February 21, and subsequently had outbreaks of 102 cases in relation to a Zumba dance facility in Cheonan and eight cases in the Seosan industrial complex. On April 10, 138 positive cases were reported. A community outbreak in relation to a church was identified during the epidemiological investigation of 11 positive cases in A County from March 24 to April 5. Nine cases were tied to the church, one case was imported, and one case was due to an unrelated community infection. This report presents the results of the epidemiological investigation of 11 COVID-19 cases in A County from March 24 to April 5, 2020. The process of the epidemiological investigation is described using data from the A County health clinic and the field epidemiological investigation report from the rapid response team. General characteristics, the epidemic curve, and relationship diagrams were calculated for analysis.
Result
Process of the epidemiological investigation
The first and second positive cases in A County, Chungcheongnam-do Province on March 24 were a married couple. Case #1 had experienced muscle pain and fever since March 20. After a few days, the symptoms worsened, so the patient remained at home without going out. The patientsuspected COVID-19 infection once the symptoms did not improve and tested positive for COVID-19 at a testing center in a hospital in A County on March 23. Case #2 experienced fever starting on March 21 and tested positive together with case #1. Case #1 did not report any activities outside of the home since a day prior to symptom onset, and contact tracing was conducted to determine the location of exposure (e.g., the workplace, church, home, or the supermarket that case #2 visited). The final list of contacts included two family members, 32 employees in the workplace (an insurance company), two insurance clients, and four church members.
The third positive case identified on March 27 was a contact of case #2. Case #3 was already in quarantine at home, so the three family members that shared the home were classified as contacts. The fourth case, who was identified on the same day, was an imported case that did not have epidemiological relevance to the church.
The epidemiological investigation concluded that the fifth positive case identified on March 30 was not linked to the church and classified the case as unidentified community infection.
The epidemiological investigation of case #6, who was identified on March 31, confirmed that case #6 attended the same church as cases #1 to #3. The identified contacts of case #6 included one family member, one medical provider (as case #6 visited a medical facility), two other patients at the medical facility, and one acquaintance. Case #7, who was identified on the same day, was a contact of case #2 who was already in quarantine and did not have any further contacts.
On April 1, COVID-19 was detected in two other church members (cases #8 and #9). The epidemiological investigation of case #8 identified one family member and two shop owners in a market as contacts. For case #9, the contacts included one family member, six people in a restaurant, one person in a hair salon, and one acquaintance.
Case #11, who was identified on April 5, was the spouse of case #6 and a member of the church related to the outbreak. 4on April 1, but subsequently experienced COVID-19 symptoms and received a second test on April 5 that came back positive. Case #11 did not have any further contacts.
The number of contacts of the 11 confirmed cases was 121, including 13 family members who lived with the positive cases, 33 colleagues, four church members, 13 acquaintances, and 49 community contacts. Those who were listed as contacts
were ordered to quarantine for 14 days by the health clinic. If the contacts experienced COVID-19-related symptoms during self-quarantine, they could immediately get tested at a testing site. The locations visited by the confirmed cases were sterilized immediately.
Among the 11 confirmed cases in A County that were identified from March 24 to April 5, 2020, nine were related to the church, with the rest being one imported case and one epidemiologically unrelated case of unidentified community
Table 1. Demographic characteristics of eleven COVID-19 confirmed cases in A County, Republic of Korea (n=11)
Characteristics n % Sex Male 5 45.5 Female 6 55.5 Age 20-29 1 9.1 30-39 2 18.2 40-49 3 27.3 50-59 2 18.2 60-69 1 9.1 ≥70 2 18.2 Mean±SD 49.8±16.5 (Median 48.0) Nationality Korean 10 90.9
The United Kingdom 1 9.1
Sings and Symptoms at on onset (can be duplicated) Respiratory Symptom
Fever, Heat sensation 6 25.0
Sore Throat 2 8.3 Cough or Sputum 5 20.8 Runny nose 1 4.1 Other symptoms Muscle ache 3 12.5 Chills 4 16.7 Vomiting 2 8.3 Headache 1 4.1
infection. While investigating the cases related to the outbreak in the church, it was identified that social distancing was not adhered to inside the church and that some church members did not wear masks properly. Thus, the common exposure date was set as March 22, which was the date of the last service. When two of the church members were first identified as COVID-19 cases, the risk exposure for those who attended the same service on the same date was regarded as low, so the entire church was not designated as at risk. However, since COVID-19-positive cases were reported both among church members identified as contacts and those who were not identified as contacts, all 190 church members who attended the service on March 22 were tested, and two additional positive cases were identified. To find hidden infection cases, all 390 registered members of the church, including 190 who attended the service on March 22, were tested, but there were no further positive cases. The list of church members was compared to the list of Shincheonji followers, but none of the church members were associated with the Shincheonji religious group. The remaining two of the 11 total positive cases were checked for relevance to the church. One
case started experiencing symptoms on the same day as arrival and thus did not have any epidemiological relationship with the church. The other case was a church-goer, but went to a different church that did not have epidemiological relevance to the church where the outbreak was identified.
Since the date of symptom onset only differed by one day between case #1 and #2, who were a married couple and shared a daily routine, it was hypothesized that they were infected by an unknown index case and started the outbreak. In order to investigate the exact route of infection, global positioning system (GPS), which is a satellite location system, and Drug Utilization Review (DUR), which is a service to ensure the safety of drug prescriptions, records were analyzed. The results suggested that cases #1 and #2 had no history of traveling abroad or to Daegu and did not visit any locations other than the ones reported.
General Characteristics
Among the 11 confirmed cases, five were male (45.5%), and six were female (55.5%). The mean, median, and range of age
Figure 1. The epidemiological curves of the Signs and symptoms of the eleven COVID-19 cases at the onset date in A County, Republic of Korea
were 49.8 years, 48 years, and 21 to 78 years, respectively. Three cases were in their 40s (27.3%); two were in their 30s, 50s, and 70s, respectively (18.2% in each category); and one each was in their 20s or 60s (9.1% in each category). Ten of the patients were A County residents, and one was British. The initial symptoms reported by the confirmed cases were fever or heat sensation in six cases (25.0%), cough or phlegm in five cases (20.8%), chills in four cases (16.7%), muscle pain in three cases (12.5%), sinus pressure in two cases (8.3%), vomiting in two cases (8.3%), and one case each for runny nose and headache (4.1% each) (Table 1).
Epidemic Curve
The first symptoms were recorded on March 20, 2020, and the onset of symptoms (bar graph) continued through April 5, with a relatively even distribution throughout this period. The
dates of the positive tests (line graph) were also dispersed like the onset of symptoms, with two positive tests from March 20 to 21, four from March 25 to 27, four from March 30 to April 1, and one on April 5 (Figure 1).
Relationship Diagram
As shown in the relationship diagram of the 11 confirmed cases in A County, Chungcheongnam-do Province from March 24 to April 5, cases #1 and #2 were infected by an unknown index case. Cases #3 and #7, who were in the church broadcast room with case #2 during the March 22 church service, tested positive. Cases #8 and #9, who attended the same service on the same day and sat directly in front of and behind case #6 in the worship room, also tested positive. Family members of case #6 (case #11) and case #9 (case #10) were infected. Case #4 was an
① Patient ② ⑦ ⑪ ③ ⑩ ⑥ ⑤ ⑧ ⑨ ④ Infection Inflow to foreign Church
imported case, from whom no community infections resulted. Case #5 was infected from an unknown case, did not show epidemiological relevance to the church where the outbreak occurred, and did not result in further community infection (Figure 2).
Conclusion
From March 24 to April 5, 2020, 11 COVID-19 cases were confirmed in A County. Nine of these cases occurred in relation to a church, and the remaining two occurred sporadically. In the church where the outbreak was identified, the initial infections occurred through religious activities among church members, and the infection was transmitted to the families of church members, resulting in an outbreak. This finding demonstrates that ordinary religious activities in various religious groups, not just Shincheonji activities, can lead to outbreaks of COVID-19. Religious activities in church include reading Bible verses aloud and singing hymns in a closed space with close contact and little to no movement for about 1 hour. Since COVID-19 is transmitted through droplets, these characteristics make an outbreak highly likely if a church member is infected with COVID-19. The remaining two cases were an imported case and an infection from an unknown source with no epidemiological relation to the church. The sex ratio among the 11 confirmed cases was even, and the age range was broad. The primary symptoms were consistent with known COVID-19 symptoms, including high rates of fever or heat sensation and respiratory symptoms such as cough and phlegm.
The vast majority (81.5%) of all COVID-19 cases in South Korea (as of April 13) were related to community outbreaks in spaces where many people are concentrated and droplets are easily produced, such as religious groups, care facilities and
hospitals, and call centers. In the church in A County where the outbreak occurred, a high risk of exposure to droplets was identified, as there was less than 2 m of distance between church members and suboptimal mask wearing [1].
Although the rate of new COVID-19 cases is reducing in response to control measures by the central government and intense social distancing measures, local outbreaks can occur anywhere, and in order to prevent further outbreaks, it is necessary to analyze and share the processes of epidemiological investigation and epidemiological information from any outbreaks that occur, including these confirmed cases in A County, Chungcheongnam-do Province.
During the epidemiological investigation, the response guideline was revised on April 2, and the criterion for identifying contacts was revised from those who contacted a case 1 day before symptom onset to those who contacted a case 2 days before symptom onset. If the epidemiological investigation of the first patients in A County had initially been conducted according to the revised guidelines, everyone who subsequently was identified as positive from the church community would have been classified as contacts, and early detection and minimization of contacts would have been possible.
Although the number of COVID-19 cases in South Korea is showing a downward trend, the occurrence of multiple localized outbreaks associated with church groups shows that the spread of COVID-19 in religious facilities should be contained by avoiding in-person services, recommending online services, and making sure that COVID-19 prevention measures (wearing masks, checking temperature, social distancing, sterilizing the space, using hand sanitizers, and listing participants) are adhered to during in-person services. The results of this study were based on the results of the epidemiological investigations that have been conducted so far, meaning that the results of the analysis might change depending on further investigation.
Acknowledgement
We thank patients who participated in the case study of this outbreak and the Chungcheongnam-do Province quarantine and response headquarters (HyeonOk Baek, MinKyo Cheon, HoYeong Lee, YeongRim Jeong, HyeonGi Lee, YongMi Kim, JeongDong Sin, WonTae Cho, GwanYong Jeong) who contributed to the epidemiological investigation and response.
① What was previously known?
Local outbreaks of COVID-19 in religious groups in South Korea started with the religious activities of the Shincheonji group.
② What is newly added?
The report demonstrated that usual religious activities in various religious groups can lead to an outbreak of COVID-19. Religious activities in church include reading Bible verses aloud and singing hymns in a closed space with close contact and little to no movement for about 1 hour. Since COVID-19 is transmitted through droplets, these characteristics make an outbreak highly likely if a church member is infected.
③ Implications?
Since there have been several outbreaks related to churches, the spread of COVID-19 in religious facilities should be contained by avoiding in-person services, recommending online services, and making sure that COVID-19 prevention measures (wearing masks, checking temperature, social distancing, sterilizing the space, using hand sanitizers, and listing participants) are adhered to during in-person services.
Reference
1. KCDC [internet]. Available from: http://ncov.mohw.go.kr.
2. Chungnam Center for Infectious Diseases Control and Prevention; Epidemiology & Case Management Team, COVID-19 National Emergency Response Center, KCDC. Investigation of COVID-19 outbreaks through Zumba dance classes in Korea. Public Health Weekly Report. 2020;13(13):726-736.
3. Moran Ki & Task Force for 2019-nCoV. Epidemiologic characteristics of early cases with 2019 novel coronavirus (2019-nCoV) disease in Republic of Korea. Epidemiol Health. February 9, 2020:e2020007. doi: 10.4178/epih.e2020007.
This article has been translated from the Public Health Weekly Report (PHWR) volume 13, Number 20, 2020.
Introduction
After the first cases of pneumonia of unknown origin were reported from Wuhan, Hubei Province, China on December 31, 2019, the Incheon Airport National Quarantine Station implemented heightened quarantine procedures on January 3, 2020. On January 19, 2020, the first confirmed coronavirus disease 2019 (COVID-19) case in Korea was categorized as a patient under investigation (PUI) during the quarantine process, transferred and isolated in a designated isolation ward, and confirmed to be infected with COVID-19 on the next day.
As COVID-19 spread across China, the quarantine station installed assessment clinics inside the arrival hall of Incheon Airport starting on January 28, 2020. The Incheon Airport National Quarantine Station began to offer COVID-19 polymerase chain reaction (PCR) testing on January 31, and 405 cases of COVID-19 were confirmed during quarantine processing at the Incheon Airport National Quarantine Station as of May 15, 2020, including the first confirmed case in Korea.
This report presents an analysis of the COVID-19 quarantine response at Incheon Airport from January 2, 2020, the day prior
Quarantine Response to COVID-19: The COVID-19 National Quarantine
Station at Incheon Airport
The purpose of this report was to present the characteristics of the quarantine response to COVID-19 by analyzing indicators at the Incheon Airport National Quarantine Station (the IANQS). In 2020, quarantine in South Korea gradually strengthened following the global spread of COVID-19. As a result, the daily number of inbound travelers decreased, but the collection rate of health declaration forms (HDFs) reached 96.6 percent of those who entered South Korea.
The target period for analysis was from January 2nd to May 15th, 2020 and the main results are as follows.
First, the total number of quarantine targets was 5,690,933, and the collected number of HDFs was 892,918. A total of 405 patients including the first confirmed patient (#1) were confirmed by the IANQS among patients under investigation (PUIs) who were detected at the quarantine phase.
Second, cases with COVID-19 symptoms were affected by the outbreak trends of the departure country. From January to the end of February 2020, the majority of cases with symptoms departed from China, and after March, the number of cases with symptoms increased significantly due to the spread of COVID-19 in Europe and the United States. Flight analyses showed the same results that the percentage of PUI passengers was high in flights from departure cities with high prevalence.
Third, 84% of 404 confirmed cases from March 14th to May 15th, 2020 had been in Europe and the United States.
Keywords: COVID-19, Quarantine, Imported case, Airport
Jiyun Park, Dongyoung Kim, Gihoon Kwon, Hansuk Kim
to the implementation of heightened quarantine measures, until May 15, 2020. The timeframe for the analysis was determined based on significant trends in situational fluctuations.
Result
Changes in quarantine subjects
A quarantine subject is defined as any person who is required to submit a health declaration form when seeking entry to South Korea. Travelers who need to submit health declaration forms are determined by the designation of a quarantine control region (formerly, quarantinable disease risk areas) or other policy measures of the government.
On January 20, 2020, when the first confirmed case was reported, the government elevated the epidemic threat level to yellow and issued instructions for a heightened response. When the threat level was raised to orange on January 27, all travelers from China (except Hong Kong and Macau) were required to submit health declaration forms. The threat level was then raised to red on February 24. As confirmed cases surged around Europe, the compulsory submission of health declaration
forms expanded to entrants from Iran and Italy on March 11, travelers from five European states (the United Kingdom, France, Germany, the Netherlands, and Spain) on March 15, and travelers from all European countries on March 16. On March 12, the World Health Organization declared the COVID-19 outbreak to be a pandemic. As the number of confirmed cases imported from foreign countries has grown, the Korean government has implemented stricter quarantine measures, requiring all persons entering South Korea to submit health declaration forms.
The daily average number of travelers in January was 106,534. However, the number of people seeking entry to South Korea drastically dropped since February, when stricter quarantine measures came into force. However, the proportion of travelers required to complete health declaration forms rose to 96.6% in May (May 1 to May 15, 2020). This figure includes connecting passengers who did not land in Korea according to the KCDC Integrated System. Excluding connecting passengers, 100% of travelers entering South Korea have been required to submit health declaration forms since March 19 (Table 1).
The requirement to submit health declaration forms was limited to travelers from quarantinable disease risk areas until January 28, 2020. During this period, on average, 11,041 forms were submitted per day (January 2 to January 26, 2020).
Table 1. No. of Daily Inbound Travelers, Collection of Health Declaration Forms (HDFs), Collection Rate of Health Declaration Forms (HDFs)
(N, %)
Period Average No. of Daily Inbound Travelers* Average No. of Daily HDF Collection Average Rate of HDF Collection
Jan. (2020.1.2.~2020.1.31.) 106,534 11,957 11.3 Feb. (2020.2.1.~2020.2.29.) 65,657 6,695 9.9 March (2020.3.1.~2020.3.31.) 12,445 4,526 45.9 April (2020.4.1.~2020.4.30.) 4,867 4,637 95.5 May (2020.5.1.~2020.5.15.) 3,938 3,801 96.6 *Including transit
However, as the disease risk areas were expanded and stricter quarantine measures were implemented by the Incheon Airport National Quarantine Station, the number of required forms rose by 10,202 to 20,309 on January 27. Even though the concentrated quarantine measures for transit countries targeting MERS and Ebola, as well as the cholera risk area, were temporarily suspended to focus efforts on the response to COVID-19, the average daily number of health declaration forms remained 16,469 from January 28 to January 31.
Europe experienced large-scale spread of COVID-19 during March. Based on this situation, the Incheon Airport National Quarantine Station promptly decided to require health declaration forms from airline travelers originating from Europe. The required number of health declaration forms rose from 1,193 on March 11 to 1,620 on March 12 and 2,788 on March 13. The
government requirement of health declaration forms officially came into force on March 16, when we required 2,399 forms. The number of required forms on March 19, when the requirement was extended to all travelers, rose by 8,500 compared to March 18, with 10,872 forms. The proportion of travelers required to submit forms spiked by 403% from March 18 to March 19, from 22.0% to 88.7% (Fig. 1).
Status of quarantine response for PUIs
1)from
major countries
Quarantine measures started to be implemented in response to COVID-19 on January 3, 2020. At that time, COVID-19 had been reported in the vicinity of Wuhan in Hubei Province, China; therefore, quarantine measures were mainly imposed on
0 20,000 40,000 60,000 80,000 100,000 120,000 N o. o f q ua ra nt in e ta rg et s 검역대상자 수 건강상태질문서 징구자수 20,309 2020/1/2/ 1/27
Whole China Targeting 3/19Global
Targeting 10,872 3/16 All European Countries Targeting 2,399 0% 20% 40% 60% 80% 100% 0 5,000 10,000 15,000 3. 16. 3. 17. 3. 18. 3. 19. 3. 20. 3. 21. 403% Increase Compared
with Previous Date
3/11 Europe Targeting
(Preemptively)
1,193
(Unit: n)
No. of quarantine targets Collection rate of health declaration forms(HDFs)
Figure 1. Total number of inbound travelers and the collection rate of health declaration forms (HDFs)
1) A person who indicated on the health declaration form that he or she had experienced symptoms (fever, chills, headache, etc.), took medicine related to the symptoms, visited a local clinic or had come into contact with animals, or had an unrecognized fever detected by thermal monitoring.
flights from Wuhan, China. However, only a small proportion of travelers were from Wuhan, compared to those from the entire territory of China, so this report focuses on the quarantine measures implemented after January 28, when the quarantinable disease risk area was expanded to the entirety of China (except Hong Kong and Macau).
A. Stricter quarantine measures for travelers from China (January 28 to February 29, 2020)
As the quarantinable disease risk area was expanded from the previously designated five provinces and cities of China to the entirety of mainland China (except Hong Kong and Macau) on January 27, 2020, the Korea Centers for Disease Control tried to prevent the influx of the disease by temporarily suspending concentrated quarantine measures for transit countries targeting Ebola and MERS.
However, entries originating from China had already
been declining, especially after February 4, when even stricter quarantine measures were introduced for people inbound from China. As such, the number of PUIs also declined. There were 355 PUIs among travelers from China on January 28, but the number dropped to 9 on February 27. In the last week of the month (February 24 to February 29), the average number of PUIs was 21.6, and the proportion of PUIs among all travelers from China remained around 1.2% (Fig 2).
The number of PUIs increased temporarily on February 21, 2020; we believe that the updated definition of PUIs2) in February
2020 affected the likelihood of triage during assessment.
B. Concentrated quarantine efforts for travelers from European countries (March 1 to March 19, 2020)
In March, COVID-19 began to spread in Europe, centered around Italy, and the Incheon Airport National Quarantine Station prepared to respond. On March 11, Iran and Italy
N o. o f q ua ra nt in e ta rg et s Ca se s w ith S ym pt om s 0 100 200 300 400 500 600 700 800 900 1,000 0 2,000 4,000 6,000 8,000 10,000 12,000 14,000 16,000 18,000 20,000 1.28. 1. 29. 1. 30. 1. 31. 2. 1. 2. 2. 2. 3. 2. 4. 2. 5. 2. 6. 2. 7. 2. 8. 2. 9. 2. 10. 2. 11. 2. 12. 2. 13. 2. 14. 2. 15. 2. 16. 2. 17. 2. 18. 2. 19. 2. 20. 2. 21. 2. 22. 2. 23. 2. 24. 2. 25. 2. 26. 2. 27. 2. 28. 2. 29. 검역대상자수 (중국 ) 유증상자수 HDF from inbound People from China 10,972 355 1,618 9 1,566 29 Strengthen Quarantine Process to China 9,869 159 Revised Quarantine Guideline for COVID -19
(Ver.5)
3,622
89
(Unit: n)
No. of quarantine targets from China Cases with symptoms
Figure 2. Intensive Quarantine Period for Inbound Travelers from China (January 28 - February 29, 2020)
were added to the quarantine control regions, and the Incheon Airport National Quarantine Station proactively required health declaration forms for passengers on flights originating from Europe (including some Middle Eastern origin flights3)) and one
traveler who entered the Czech Republic was confirmed to have COVID-19 during quarantine processing at Incheon Airport on March 14. Therefore, the health declaration form became mandatory for travelers from all European states. While the number of entry attempts rose and fell based daily fluctuations in flight operations, the proportion of PUIs continued to rise before the health declaration form requirement was extended to all travelers worldwide (March 19) (Fig. 3).
C. Concentrated quarantine efforts for European and American travelers (March 19 to April 18, 2020)
The government mandated health declaration form submission for all travelers from anywhere in the world on March 19, 2020. We analyzed the number of travelers and PUIs from Europe and the United States, where COVID-19 was particularly prevalent during that time.
The average daily number of PUIs from Europe and the United States before March 19 remained around 175 people (3.6%). However, as quarantine requirements began to be imposed on all travelers, the number of PUIs from Europe and the United States spiked to 474, with an increase of 401 cases compared to the day prior (March 18). The rate of PUIs jumped to 12.8% of all travelers originating from Europe and the United States (Fig. 4).
These results imply that people with COVID-19 symptoms from the United States may have slipped through quarantine processing by not submitting a health declaration form. The 3) This term refers to flights originating from the UAE or Qatar bound for Incheon International Airport. Health declaration forms had already been collected from those flights due
to MERS quarantine procedures, but an increasing number of passengers used Qatar and UAE connections as many direct flights from Europe were disrupted.
0 100 200 300 400 500 600 700 800 900 1,000 0 300 600 900 1,200 1,500 1,800 2,100 2,400 2,700 3,000 3.1. 3.2. 3.3. 3.4. 3.5. 3.6. 3.7. 3.8. 3.9. 3.10. 3.11. 3.12. 3.13. 3.14. 3.15. 3.16. 3.17. 3.18. 3.19. 검역대상자수 (유럽 ) 유증상자수 Active collection of
HDFs from Europe Official collection ofHDFs from Europe
2,890 3 647 43 570 100 1,115 230 N o. o f q ua ra nt in e ta rg et s Ca se s w ith symptoms (Unit: n) Incheon Airport#2 Confirmed Case
No. of quarantine targets from Europe Cases with symptoms
number of entries from Europe and the United States decreased to 2,223 persons on April 2, two weeks after stricter quarantine measures were imposed, corresponding to around 60% of prior entry attempts. However, the average proportion of PUIs remained 11% to 12% on average. As imported COVID-19 cases increased, particularly from Europe and the United States, the government imposed mandatory isolation for admitted travelers, starting with European travelers on March 24, expanding to travelers from the United States on March 27, and then including all travelers from outside of Korea beginning on April 1.
Passenger and PUI status for major originating
cities
As different nations experienced the peak of the COVID-19 outbreak, the distribution of PUIs based on the originating city also changed. Thus, we analyzed the number of passengers and PUIs on flights from the major originating cities (London, Paris, New York, and the Middle East [Doha and Abu Dhabi])
during different periods. We included flights from the Middle East because we confirmed that many travelers who had entered Europe connected through flights from the Middle East as a detour due to the disruption of commercial flight services directly from Europe. In order to examine the characteristics of imported COVID-19 cases, we determined the dates when flights carrying passengers operated, and then analyzed the changes in passengers and PUIs.
A. The proportion of PUIs among travelers from major originating cities
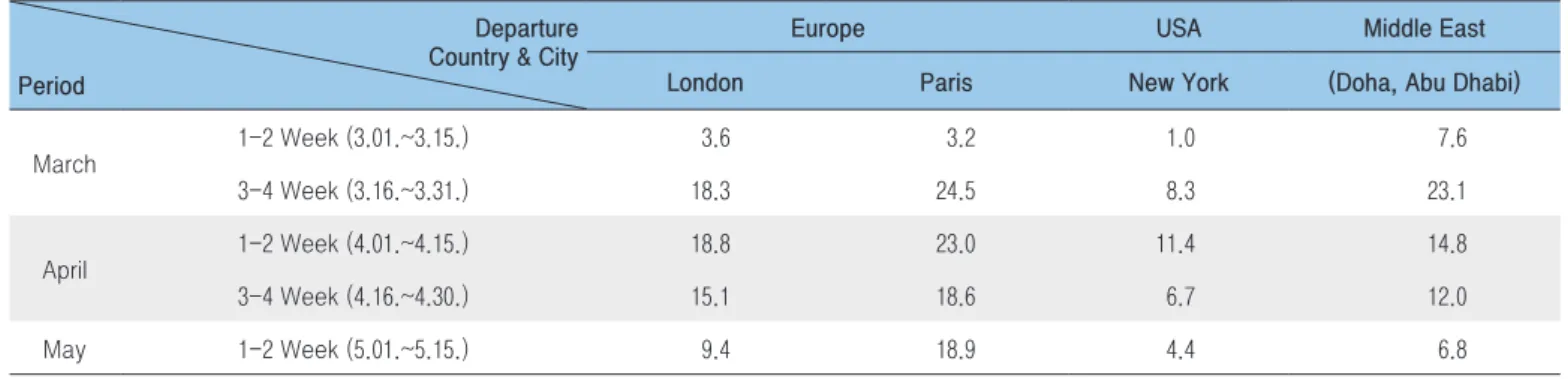
The highest proportion of PUIs relative to entry attempts via major commercial flight routes was found during the third and fourth weeks of March and the first and second weeks of April for flights from Europe. Notably, the proportion of PUIs on flights from Paris on March 23 spiked to 33.7%, and the proportion remained above 10% into the third and fourth weeks of April (Table 2). N o. o f q ua ra nt in e ta rg et s Ca se s w ith S ym pt om s 0 300 600 900 1,200 1,500 0 500 1,000 1,500 2,000 2,500 3,000 3,500 4,000 4,500 5,000 3.15. 3.16. 3.17. 3.18. 3.19. 3.20. 3.21. 3.22. 3.23. 3.24. 3.25. 3.26. 3.27. 3.28. 3.29. 3.30. 3.31. 4.1. 4.2. 4.3. 4.4. 4.5. 4.6. 4.7. 4.8. 4.9. 4.10. 4.11. 4.12. 4.13. 4.14. 4.15. 4.16. 4.17. 4.18. 검역대상자수 (미국 ,유럽 ) 유증상자수 474 3,703 All Inbound Travelers Targeting 4,602 456 2,223 284 1,646 165 3,833 430 Obligation of self -isolation (Global) (Unit : n )
No. of quarantine targets
from Europe and United States Cases with symptoms
Obligation of self
-isolation (US)
B. Changes in trends for each originating city
We looked into changes in the numbers of travelers and PUIs on flights from major cities (London, Paris, New York, and those in the Middle East), and the results were as follows (Fig. 5).
Flights from London, UK were operated three times per week by two airlines. Flights originating from Paris, France were operated by one airline, with two to three flights per week. For the London-origin flights, while the number of travelers varied by date, the highest number of passengers entered between March 27 and March 29 during the period of interest. In particular,
Table 2. Cases with Symptoms Compared with the Number of Inbound Travelers from High Prevalence Countries and Cities
(N, %)
Departure Country & City Period
Europe USA Middle East London Paris New York (Doha, Abu Dhabi)
March 1-2 Week (3.01.~3.15.) 3.6 3.2 1.0 7.6 3-4 Week (3.16.~3.31.) 18.3 24.5 8.3 23.1 April 1-2 Week (4.01.~4.15.) 18.8 23.0 11.4 14.8 3-4 Week (4.16.~4.30.) 15.1 18.6 6.7 12.0 May 1-2 Week (5.01.~5.15.) 9.4 18.9 4.4 6.8 0 50 100 150 200 250 300 0 100 200 300 400 500 600 700 800 3. 17 . 3. 19 . 3. 21 . 3. 22 . 3. 23 . 3. 24 . 3. 25 . 3. 26 . 3. 27 . 3. 28 . 3. 29 . 3. 30 . 3. 31 . 4. 1. 4. 2. 4. 3. 4. 5. 4. 7. 4. 9. 4. 11 . 4. 12 . 4. 16 . 4. 19 . 4. 23 . 4. 26 . 4. 30 . 5. 3. 5. 7. 5. 10 . 5. 14 . 0 50 100 150 200 250 300 0 100 200 300 400 500 600 700 800 3. 16 . 3. 17 . 3. 18 . 3. 19 . 3. 20 . 3. 21 . 3. 22 . 3. 23 . 3. 24 . 3. 25 . 3. 27 . 3. 29 . 4. 1. 4. 3. 4. 6. 4. 8. 4. 10 . 4. 13 . 4. 17 . 4. 20 . 4. 24 . 4. 27 . 5. 1. 5. 4. 5. 8. 5. 11 . 5. 15 . 탑승자수 유증상자수 0 50 100 150 200 250 300 0 100 200 300 400 500 600 700 800 3. 16 . 3. 18 . 3. 20 . 3. 22 . 3. 24 . 3. 26 . 3. 28 . 3. 30 . 4. 1. 4.3. 4.5. 4.7. 4.9. 4. 11 . 4. 13 . 4. 16 . 4. 20 . 4. 23 . 4. 27 . 4. 29 . 5. 1. 5.3. 5.5. 5.7. 5.9. 5. 11 . 5. 13 . 5. 15 . 0 50 100 150 200 250 300 0 100 200 300 400 500 600 700 800 3. 16 . 3. 18 . 3. 20 . 3. 22 . 3. 24 . 3. 26 . 3. 28 . 3. 30 . 4. 1. 4.3. 4.5. 4.7. 4.9. 4. 11 . 4. 13 . 4. 15 . 4. 17 . 4. 19 . 4. 21 . 4. 23 . 4. 25 . 4. 27 . 4. 29 . 5. 1. 5.3. 5.5. 5.7. 5.9. 5. 11 . 5. 13 . 5. 15 .
A. From London B. From Paris
C. From New York D. From the Middle East
N o. o f p as se ng er s Ca se s w ith s ym pt om s (Unit: n)
No. of passenger Case of symptoms
150 travelers from London were classified as PUIs on March 27. For the flights originating from Paris, the number of entry attempts remained approximately 300 until the end of March. The proportion of PUIs rose to 33.7% on March 23. On that date, there were 273 people, with 92 reported PUIs.
Flights from New York were operated by two airlines, with five to seven flights per week on average. Only one to three PUIs per day were reported from March 1 to March 18. However, as stricter quarantine procedures were imposed, the number of PUIs rose to 59 on March 19. Since then, the number of PUIs from New York remained generally stable from March 16 to April 15, with an average of 40.4 people, and only started to decline in mid-April.
Due to the impact of European sojourners, flights originating from the Middle East continued to have a high proportions of PUIs; notably, on March 18, there were 155 PUIs (24.1%) among 642 passengers. This trend continued into early April, with 100.6 PUIs on average between March 16 and March 31. Then, the proportion of PUIs started to decline, with averages of 28.7
people during the first half of April (April 1 to April 15) and 15.7 people during the second half of April (April 16 to April 30).
Status of testing and confirmed cases of
COVID-19 during quarantine processing at
Incheon Airport
A. Testing and confirmed cases (daily, cumulative) during quarantine processing at Incheon Airport
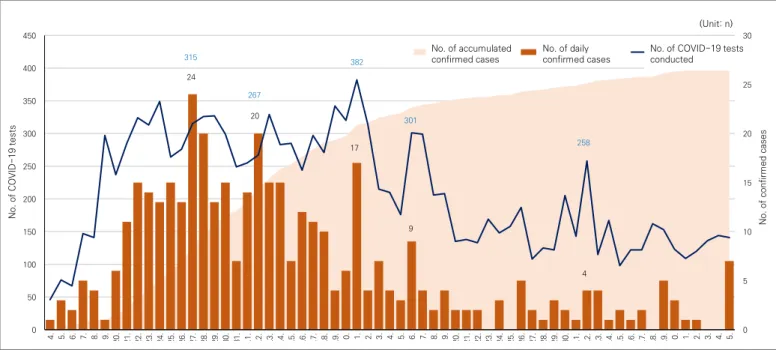
The Incheon Airport National Quarantine Station installed an assessment clinic within the airport on January 28 to prevent the influx of COVID-19. The assessment clinic conducted COVID-19 PCR tests on its premises, with 14,178 tests performed through May 15. We aggregated the confirmed cases from March 14, when the second confirmed case was reported from quarantine processing at the airport, with the following results (Fig. 6). N o. o f C O VI D-19 te st s N o. o f c on fir m ed c as es 0 5 10 15 20 25 30 0 50 100 150 200 250 300 350 400 450 3. 14 . 3. 15 . 3. 16 . 3. 17 . 3. 18 . 3. 19 . 3. 20 . 3. 21 . 3. 22 . 3. 23 . 3. 24 . 3. 25 . 3. 26 . 3. 27 . 3. 28 . 3. 29 . 3. 30 . 3. 31 . 4. 1. 4. 2. 4. 3. 4. 4. 4. 5. 4. 6. 4. 7. 4. 8. 4. 9. 4. 10 . 4. 11 . 4. 12 . 4. 13 . 4. 14 . 4. 15 . 4. 16 . 4. 17 . 4. 18 . 4. 19 . 4. 20 . 4. 21 . 4. 22 . 4. 23 . 4. 24 . 4. 25 . 4. 26 . 4. 27 . 4. 28 . 4. 29 . 4. 30 . 5. 1. 5. 2. 5. 3. 5. 4. 5. 5. 5. 6. 5. 7. 5. 8. 5. 9. 5. 10 . 5. 11 . 5. 12 . 5. 13 . 5. 14 . 5. 15 . 누적확진자수 일별 확진자수 검사건수 17 20 24 9 382 301 258 4 315 267 (Unit: n) No. of accumulated
confirmed cases No. of dailyconfirmed cases No. of COVID-19 tests conducted
The number of tests changed as the number of PUIs entering quarantine processing fluctuated. It steadily rose since March 14, when a confirmed case was reported among travelers from Europe. On March 27, 315 tests were administered with 24 confirmed cases; this was the day with the most confirmed cases reported by the station. Subsequently, the number of tests and confirmed cases remained high until mid-April, with a daily average of 294 tests from March 20 to April 10, but declined starting in mid-May.
B. Geographic origin of confirmed cases reported during quarantine processing at Incheon Airport
The regions of origin from which the confirmed cases reported during the Incheon airport quarantine phase (404 cases) are presented below (Fig. 7). Although there were 404 confirmed
cases, we analyzed 408 cases4) due to duplication of regions of
origin. The United States was the most common point of origin (179 cases, 43.9%) followed by Europe (160 cases, 39.2%), the Middle East (16 cases, 3.9%), Asia (36 cases, 8.8%), and others (17 cases, 4.2%).5) This is commensurate with the fact that the
majority of imported cases were from the United States or Europe.
In an analysis of changes in the regions of origin of confirmed cases, many were initially from European countries, but as time progressed, more confirmed cases were from the United States. International trends in the spread of the COVID-19 pandemic were analyzed by tracking the dates where the most confirmed cases arrived from various regions. On March 27, among 24 confirmed cases, 18 were from Europe, five were from the United States, and one was from Thailand. On April 11, among 17 confirmed cases, two were from Europe, 12 were
4) One duplicate case of the US and Europe, and 3 cases of the US and others were reported. 5) Including North America (except the United States), South America, and Africa.
0 5 10 15 20 25 3. 14 . 3. 15 . 3. 16 . 3. 17 . 3. 18 . 3. 19 . 3. 20 . 3. 21 . 3. 22 . 3. 23 . 3. 24 . 3. 25 . 3. 26 . 3. 27 . 3. 28 . 3. 29 . 3. 30 . 3. 31 . 4. 1. 4. 2. 4. 3. 4. 4. 4. 5. 4. 6. 4. 7. 4. 8. 4. 9. 4. 10 . 4. 11 . 4. 12 . 4. 13 . 4. 14 . 4. 15 . 4. 16 . 4. 17 . 4. 18 . 4. 19 . 4. 20 . 4. 21 . 4. 22 . 4. 23 . 4. 24 . 4. 25 . 4. 26 . 4. 27 . 4. 28 . 4. 29 . 4. 30 . 5. 1. 5. 2. 5. 3. 5. 4. 5. 5. 5. 6. 5. 7. 5. 8. 5. 9. 5. 10 . 5. 11 . 5. 12 . 5. 13 . 5. 14 . 5. 15 . 미국 유럽 중동 아시아 기타 160 (39.2%) 179 (43.9%) 16 (3.9%) 36 (8.8%) 17 (4.2%)
US Europe The Middle East Asia Etc.
(Unit: n, %)
from the US, two were from Japan, and one was from Canada. After May, many confirmed cases arrived from the Middle East, because quarantine measures were heightened due to mass outbreaks at construction sites in the Middle East region.
PUIs in quarantine processing and measures to
treat confirmed patients
A. PUI processing procedures
COVID-19 PUIs identified in Incheon Airport are tested in one of two ways. A sample is obtained either after transferring a PUI to a negative-pressure isolation facility within the Central Quarantine Medical Support Center or on-site in the arrival hall after triage. In principle, PUIs are taken to negative-pressure isolation facilities if they exhibit typical symptoms of COVID-19, if they are suffering a relatively severe onset of illness, or if a sample must be taken from the lower respiratory tract. Otherwise, PUIs are tested on-site at the arrival hall, with individual isolation
performed in a temporary waiting room.
As the number of PUIs spiked due to the COVID-19 pandemic, we required a waiting space where PUIs are directed to isolate while waiting for their test results. Hence, the Incheon Airport National Quarantine Station rented 3 temporary waiting facilities. Fewer PUIs were directed to negative-pressure isolation facilities after we began utilizing temporary waiting areas, which could be attributed to the better health status of travelers from foreign countries. Most of the cases (94.3%, 13,365 tests) only required a sample from the upper respiratory tract, as they did not exhibit symptoms such as excessive mucus production.
The number of PUIs and COVID-19 confirmed cases continued to decline since mid-April, so the Incheon Airport National Quarantine Station gradually scaled back the operations of the temporary waiting areas. Currently, we are operating one temporary waiting area in addition to negative-pressure isolation facilities. The records of COVID-19 PUI processing in quarantine processing at Incheon Airport are presented below (Fig. 8).
0 50 100 150 200 250 300 350 400 3. 15. 3. 16. 3. 17. 3. 18. 3. 19. 3. 20. 3. 21. 3. 22. 3. 23. 3. 24. 3. 25. 3. 26. 3. 27. 3. 28. 3. 29. 3. 30. 3. 31. 4. 1. 4. 2. 4. 3. 4. 4. 4. 5. 4. 6. 4. 7. 4. 8. 4. 9. 4. 10. 4. 11. 4. 12. 4. 13. 4. 14. 4. 15. 4. 16. 4. 17. 4. 18. 4. 19. 4. 20. 4. 21. 4. 22. 4. 23. 4. 24. 4. 25. 4. 26. 4. 27. 4. 28. 4. 29. 4. 30. 5. 1. 5. 2. 5. 3. 5. 4. 5. 5. 5. 6. 5. 7. 5. 8. 5. 9. 5. 10. 5. 11. 5. 12. 5. 13. 5. 14. 5. 15. 음압시설격리 현장진단검사 45 309 288 42 226 32 337 45 (Unit: n) Negative pressure
isolated facility test Air-side test
B. Treating COVID-19 confirmed patients diagnosed during quarantine processing
The processing of a COVID-19 confirmed patient includes procedures for assigning an isolation ward and transportation, and the details vary depending on the patient’s severity, residence, and nationality. Any patient suffering from severe symptoms is to be transferred to the National Medical Center. In cases with a mild onset, each confirmed patient is assigned to an isolation facility according to his or her place of residence: if nearby, the patient may be assigned to an institution specializing in infectious diseases within their metropolitan or provincial area, whereas if such institutions are distant from the patient’s residence, he or she is assigned to a community treatment center. The treatment of cases identified in quarantine processing at Incheon Airport is presented below (Fig. 9).
In some cases, confirmed patients were transferred to a public health center, as they were directed to return home due to a shortage of temporary waiting areas. However, after
sufficient waiting rooms were secured, such cases no longer occurred. Confirmed patients were taken exclusively to the National Medical Center and community treatment centers between March 23 and March 26, before the transfer procedure was established. However, after the government announced the transfer procedure for cases confirmed in quarantine processing, more patients were assigned to isolation wards in their region of residence.
Conclusion
The number of quarantine subjects and PUIs reflected the global trends of the COVID-19 pandemic. The number of PUIs identified in quarantine processing spiked during as the outbreak surged in Europe and the United States, and then stabilized. Recently, we have confirmed an increased influx of patients from the Middle East.
These trends shows that changes in outbreak models in each
0 5 10 15 20 25 3. 14. 3. 15. 3. 16. 3. 17. 3. 18. 3. 19. 3. 20. 3. 21. 3. 22. 3. 23. 3. 24. 3. 25. 3. 26. 3. 27. 3. 28. 3. 29. 3. 30. 3. 31. 4. 1. 4. 2. 4. 3. 4. 4. 4. 5. 4. 6. 4. 7. 4. 8. 4. 9. 4. 10. 4. 11. 4. 12. 4. 13. 4. 14. 4. 15. 4. 16. 4. 17. 4. 18. 4. 19. 4. 20. 4. 21. 4. 22. 4. 23. 4. 24. 4. 25. 4. 26. 4. 27. 4. 28. 4. 29. 4. 30. 5. 1. 5. 2. 5. 3. 5. 4. 5. 5. 5. 6. 5. 7. 5. 8. 5. 9. 5. 10. 5. 11. 5. 12. 5. 13. 5. 14. 5. 15. 보건소인계 시도병상배정 생활치료센터 국립중앙의료원 121 (30%) 117 (29%) 119 (30%) 47 (12%) District health
center Provincial center Communitytreatment center National medical center (Unit: n, %)