O R I G I N A L R E S E A R C H
Prediction of
first acute exacerbation using COPD
subtypes identi
fied by cluster analysis
This article was published in the following Dove Press journal: International Journal of Chronic Obstructive Pulmonary Disease
Hee-Young Yoon,1
So Young Park,1
Chang Hoon Lee,2
Min-Kwang Byun,3 Joo Ock Na,4
Jae Seung Lee,5
Won-Yeon Lee,6 Kwang Ha Yoo,7
Ki-Suck Jung,8 Jin Hwa Lee1 1Division of Pulmonary and Critical Care
Medicine, Department of Internal Medicine, College of Medicine, Ewha Womans Seoul Hospital, Ewha Womans University, Seoul, Korea;2Division of
Pulmonary and Critical Care Medicine, Department of Internal Medicine, Seoul National University Hospital, Seoul, Korea;3Division of Pulmonary Medicine,
Department of Internal Medicine, Gangnam Severance Hospital, Yonsei University College of Medicine, Yonsei University Health System, Seoul, Korea;
4Division of Pulmonology, Department of
Internal Medicine, Soonchunhyang University, College of Medicine, Cheonan, Korea;5Department of
Pulmonary and Critical Care Medicine, Asan Medical Centre, University of Ulsan College of Medicine, Seoul, Korea;
6Department of Internal Medicine,
Wonju Christian Hospital, Yonsei University Wonju College of Medicine, Wonju, Korea;7Department of Internal
Medicine, Konkuk University College of Medicine, Seoul, Korea;8Division of
Pulmonary, Allergy and Critical Care Medicine, Department of Internal Medicine, Hallym University Medical Center, Hallym University College of Medicine, Anyang, Korea
Purpose: In patients with COPD, acute exacerbation (AE) is not only an important determinant of prognosis, but also an important factor in choosing therapeutic agents. In this study, we evaluated
the usefulness of COPD subtypes identified through cluster analysis to predict the first AE.
Patients and methods: Among COPD patients in the Korea COPD Subgroup Study (KOCOSS) cohort, 1,195 who had follow-up data for AE were included in our study. We
selected seven variables for cluster analysis– age, body mass index, smoking status, history
of asthma, COPD assessment test (CAT) score, post-bronchodilator (BD) FEV1% predicted,
and diffusing capacity of carbon monoxide % predicted.
Results: K-means clustering identified four clusters for COPD that we named putative
asthma-COPD overlap (ACO), mild asthma-COPD, moderate asthma-COPD, and severe asthma-COPD subtypes. The ACO
group (n=196) showed the second-best post-BD FEV1(75.5% vs 80.9% [mild COPD, n=313] vs
52.4% [moderate COPD, n=345] vs 46.7% [severe COPD, n=341] predicted), the longest 6-min walking distance (424 m vs 405 m vs 389 m vs 365 m), and the lowest CAT score (12.2 vs 13.7
vs 15.6 vs 17.5) among the four groups. ACO group had greater risk forfirst AE compared to the
mild COPD group (HR, 1.683; 95% CI, 1.175–2.410). The moderate COPD and severe COPD
group HR values were 1.587 (95% CI, 1.145–2.200) and 1.664 (95% CI, 1.203–2.302),
respec-tively. In addition, St. George’s Respiratory Questionnaire score (HR: 1.019; 95% CI,
1.014–1.024) and gastroesophageal reflux disease were independent factors associated with the
first AE (HR: 1.535; 95% CI, 1.116–2.112).
Conclusion: Our cluster analysis revealed an exacerbator subtype of COPD independent of
FEV1. Since these patients are susceptible to AE, a more aggressive treatment strategy is
needed in these patients.
Keywords: clustering, prognosis, phenotype, asthma-COPD overlap, exacerbation, comorbidity
Introduction
COPD is a heterogeneous disease characterized by progressive respiratory impair-ment and not fully reversible airway obstruction.1Because COPD not only shows diverse clinical manifestations and prognosis, but also requires different treatments, multiple phenotypes are proposed to compliment this heterogeneity.2–4Along with the classical phenotypes of chronic bronchitis and emphysema,5several additional variables related to the prognosis of COPD, including severity of airway limitation, demographics, radiographicfindings, comorbidities and occurrence of acute exacer-bation (AE) are proposed for categorization.2–4,6
Acute exacerbation of COPD (AE-COPD) is defined as deterioration of respiratory symptoms beyond normal day-to-day variations, resulting in changes of medication.7 Correspondence: Jin Hwa Lee
Division of Pulmonary and Critical Care Medicine, Department of Internal Medicine, College of Medicine, Ewha Womans University, 260 Gonghang-daero Gangseo-gu, Seoul 07804, Korea Tel +8 226 986 1631
Email [email protected]
International Journal of Chronic Obstructive Pulmonary Disease
Dove
press
open access to scientific and medical research
Open Access Full Text Article
International Journal of Chronic Obstructive Pulmonary Disease downloaded from https://www.dovepress.com/ by 203.255.190.41 on 22-Oct-2019
An AE-COPD occurs on average about 0.34–3.00 times per person per year.8Because AE-COPD is directly linked to high mortality and significant economic burden,9,10its pre-diction is important. The most reliable predictor of AE-COPD is history of AE, and there is a specific patient population with intrinsic susceptibility to AE due to expo-sure to triggers.11Patients who experience more than two moderate to severe AE incidents per year are called frequent exacerbators and have distinct characteristics including severely impaired FEV1, dyspnea score, and physiological
score with worse outcomes.12However, not much is known about the specific COPD subtype associated with AE occur-rence based on the various clinical variables related to the occurrence of AE.
Cluster analysis is a method of data mining by defining data groups (clusters) based on measured characteristics to identify representation in specific groups.13 Because sub-types of COPD have commonly airflow limitations but different symptoms, demographics, and prognoses, cluster analysis is used to identify specific phenotypes.14The aim of this study was to identify specific COPD subtypes through cluster analysis of variables known to be asso-ciated with COPD prognosis and to evaluate the usefulness of these subtypes to predict thefirst AE in COPD.
Materials and methods
Study population
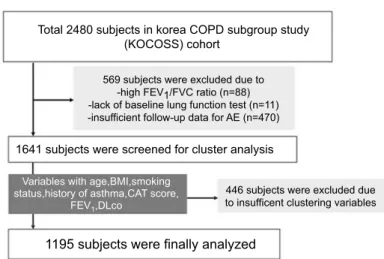
Among the total 2,480 subjects registered in the Korea COPD Subgroup Study (KOCOSS) cohort recruited from 45 study centers between December 2011 and October 2014,151,641 were initially screened for our study. We excluded 569 subjects
that lacked airway limitation (measured FEV1/FVC ≥0.7),
baseline pulmonary function test data, and follow-up data for the occurrence of AE (Figure 1). Finally, 1,195 subjects with seven clustering variables of age, body mass index (BMI), smoking status, history of asthma, COPD assessment test (CAT) score, post-bronchodilator (BD) FEV1% predicted,
and diffusing capacity for carbon monoxide (DLco) % pre-dicted were enrolled. We divided the subjects into four groups based on clustering analysis and named them according to the characteristics of the group as follows: asthma-COPD overlap (ACO), mild COPD, moderate COPD, and severe COPD. This study was approved by the Institutional Review Board of Ewha Womans University Hospital (ECT 2012–04-006–001) and all patients provided written informed consent before cohort entry.
Study design and outcomes
Data on demographics, lung function, 6MWD test, CAT score,16 COPD-specific version of St. George’s Respiratory Questionnaire (SGRQ) score,17 laboratory findings, comorbidities, and medication were retrospec-tively reviewed from electronic medical records in the KOCOSS database. All medical data were obtained from case-report forms evaluated by physicians or trained nurses with 6-month interval patient examina-tions. Spirometry and 6MWD tests were performed according to standard American Thoracic Society guidelines with modification.18,19 The occurrence of AE, defined as respiratory deterioration requiring anti-biotics or systemic corticosteroids with or without inhaler change, was also investigated at 6-month inter-vals by pulmonologists.
Total 2480 subjects in korea COPD subgroup study (KOCOSS) cohort
569 subjects were excluded due to -high FEV1/FVC ratio (n=88) -lack of baseline lung function test (n=11) -insufficient follow-up data for AE (n=470) 1641 subjects were screened for cluster analysis
446 subjects were excluded due to insufficent clustering variables
1195 subjects were finally analyzed
Variables with age,BMI,smoking status,history of asthma,CAT score,
FEV1,DLco
Figure 1 Enrollment of patients.
Abbreviations: BMI, body mass index; DLco, diffusing capacity of the lung for carbon monoxide; CAT, COPD assessment test.
International Journal of Chronic Obstructive Pulmonary Disease downloaded from https://www.dovepress.com/ by 203.255.190.41 on 22-Oct-2019
Statistical analysis
Cluster analysis was performed using a K-means cluster analysis with the seven variables considered to contribute to specific COPD phenotypes.20 Clinical characteristics were compared according to the group after clustering. Continuous and categorical variables are expressed as mean±SD and number (percentage), respectively. One-way ANOVA or Kruskal–Wallis test was used for analyz-ing continuous variables. The Pearson chi-square test or Fisher’s exact test wasused for analyzing categorical vari-ables. The Kaplan–Meier method was used to express AE-free probability, and the differences between COPD groups were assessed using the log-rank test. The risk factors for AE including COPD subtypes were reported as HR with 95% confidence interval (CI) from the Cox’s proportional-hazard model using time from cohort entry to first AE. Variables with a p-value <0.1 from univariate analysis were candidates for multivariate analysis. A p-value <0.05 (two-tailed) was regarded as statistically significant. All statistical analyses were performed using SPSS version 24.0 (SPSS Inc., Chicago, IL, USA).
Results
Comparison of baseline demographics
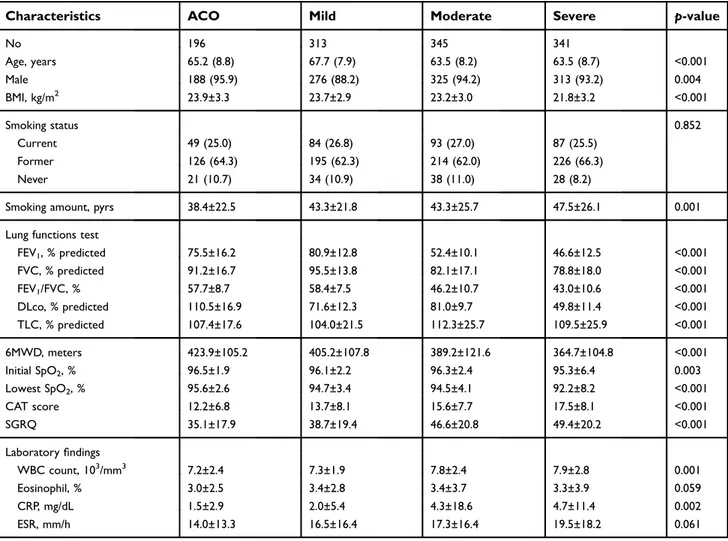
Of a total of 1,195 subjects (mean age: 64.8 years, male: 92.5%), 196 (16.4%), 313 (26.2%), 345 (28.9%), and 341 (28.5%) were classified in the ACO, mild, moderate, and severe COPD groups, respectively, mostly based on the degree of airflow limitation. Among the four groups, the ACO group had the highest proportion of male patients (95.9% [ACO] vs 88.2% [mild] vs 94.2% [moderate] vs 93.2% [severe], p=0.004), the highest mean BMI (23.9 vs 23.7 vs 23.2 vs 21.8 kg/m2, p<0.001), and the second oldest mean age (65.2 vs 67.7 vs 63.5 vs 63.5 years, p<0.001), while pack-years of smoking in the ACO group was the lowest (38.4 vs 43.3 vs 43.3 vs 47.5 pack-years, p=0.001;Table 1). In lung function comparison, the ACO group showed the best DLco (110.5 vs 71.6 vs 81.0 vs 49.8% predicted, p<0.001) and 6MWD (423.9 vs 405.2 vs 389.2 vs 364.7 m, p<0.001) values and the second-best values of FEV1(75.5
vs 80.9 vs 52.4 vs 46.6% predicted, p<0.001), FVC (91.2 vs 95.5 vs 82.1 vs 78.8% predicted, p<0.001), and FEV1
/FVC (57.7 vs 58.4 vs 46.2 vs 43.0, p<0.001). Although the differences were very small, the ACO group also revealed the highest values of initial (96.5% vs 96.1% vs 96.3% vs 95.3%, p<0.003) and lowest SpO2levels (95.6%
vs 94.7% vs 94.5% vs 92.2%, p<0.001).
In laboratory findings, total white blood cell (WBC) count (7.2 vs 7.3 vs 7.8 vs 7.9 103/mm3, p=0.001) and C-reactive protein (1.5 vs 5.4 vs 4.3 vs 4.7 mg/dL, p=0.002) levels were lowest in the ACO group among the four COPD subtypes.
Comorbidities and treatment status
Among the four COPD groups, the ACO group showed the highest rate of gastroesophageal reflux disease (GERD, 16.3% [ACO] vs 9.0% [mild] vs 10.8% [moderate] vs 6.7% [severe], p=0.004) and the second highest rate of asthma (34.7% vs 27.2% vs 37.7% vs 34.3%, p=0.035;Table 2). Hyperlipidemia (13.3% vs 17.0% vs 10.4% vs 9.3%, p=0.014), myocardial infarction (5.6% vs 7.1% vs 5.5% vs 2.3%, p=0.043), and atopic dermatitis (4.6% vs 4.8% vs 3.8% vs 2.9%) were the highest in the mild group, followed by the ACO group.
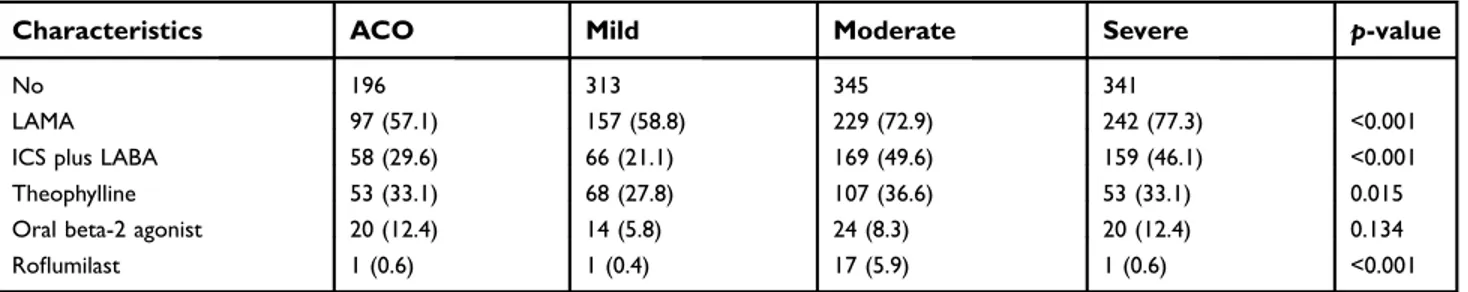
Patients who were prescribed long-acting muscarinic antagonist (LAMA; 57.1% vs 58.8% vs 72.9% vs 77.3%, p<0.001) or inhaled corticosteroid (ICS) plus long-acting beta2 agonist (LABA; 29.6% vs 21.1% vs 49.6% vs 46.1%, p<0.001) were more frequent in the moderate and severe COPD groups compared to the ACO and mild COPD groups (Table 3). The rates of theophylline (33.1% vs 27.8% vs 36.6% vs 33.1%, p=0.015) and ro flu-milast (0.6% vs 0.4% vs 5.9% vs 0.6%, p<0.001) treat-ments were highest in the moderate COPD group and similar in the ACO and severe COPD groups.
Occurrence of AE
The median follow-up period was 18 months (interquartile range: 6 to 36 months), and the ACO group had the long-est follow-up duration (Table 4). Total number of AEs was highest in the moderate COPD group (0.79 [ACO] vs 0.36 [mild] vs 0.90 [moderate] vs 0.86 [severe], p<0.001], while the mean annual frequency of AE (0.29 vs 0.18 vs 0.32 vs 0.39, p<0.001) was highest in the severe COPD group. Of total patients, 424 (35.5%) experienced AE during the follow-up period. The median time for AE occurrence in the ACO group was 42 months (95% CI, 28.5–55.5 months), which was similar to that of the mod-erate COPD group (42.0 months; 95% CI, 28.3–55.7 months; Figure 2-A). The severe COPD group showed the shortest median time for AE (30.0 months; 95% CI, 23.5–36.5 months) among the four COPD groups.
Risk factors for AE
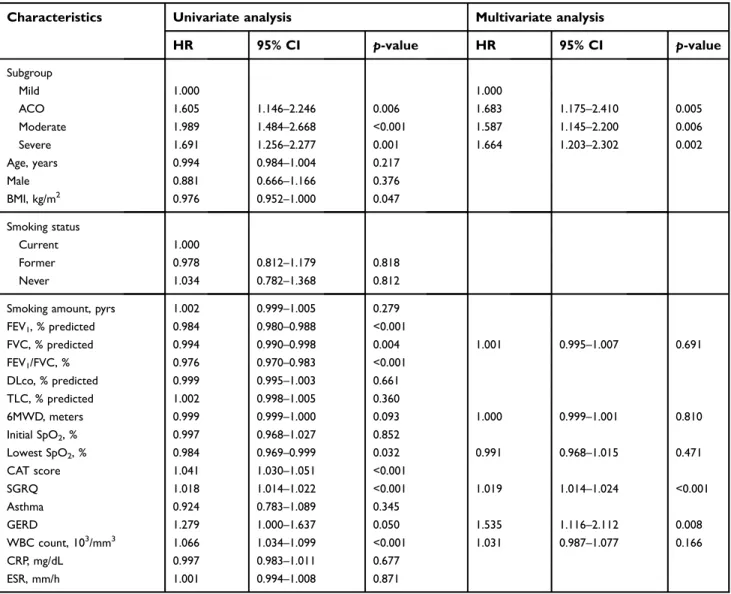
In univariate analysis, COPD subtype, BMI, lung func-tion test (FEV1, FVC, FEV1/FVC), lowest SpO2, CAT
International Journal of Chronic Obstructive Pulmonary Disease downloaded from https://www.dovepress.com/ by 203.255.190.41 on 22-Oct-2019
Table 1 Comparison of baseline characteristics according to the clustering groups
Characteristics ACO Mild Moderate Severe p-value
No 196 313 345 341 Age, years 65.2 (8.8) 67.7 (7.9) 63.5 (8.2) 63.5 (8.7) <0.001 Male 188 (95.9) 276 (88.2) 325 (94.2) 313 (93.2) 0.004 BMI, kg/m2 23.9±3.3 23.7±2.9 23.2±3.0 21.8±3.2 <0.001 Smoking status 0.852 Current 49 (25.0) 84 (26.8) 93 (27.0) 87 (25.5) Former 126 (64.3) 195 (62.3) 214 (62.0) 226 (66.3) Never 21 (10.7) 34 (10.9) 38 (11.0) 28 (8.2)
Smoking amount, pyrs 38.4±22.5 43.3±21.8 43.3±25.7 47.5±26.1 0.001
Lung functions test
FEV1, % predicted 75.5±16.2 80.9±12.8 52.4±10.1 46.6±12.5 <0.001 FVC, % predicted 91.2±16.7 95.5±13.8 82.1±17.1 78.8±18.0 <0.001 FEV1/FVC, % 57.7±8.7 58.4±7.5 46.2±10.7 43.0±10.6 <0.001 DLco, % predicted 110.5±16.9 71.6±12.3 81.0±9.7 49.8±11.4 <0.001 TLC, % predicted 107.4±17.6 104.0±21.5 112.3±25.7 109.5±25.9 <0.001 6MWD, meters 423.9±105.2 405.2±107.8 389.2±121.6 364.7±104.8 <0.001 Initial SpO2, % 96.5±1.9 96.1±2.2 96.3±2.4 95.3±6.4 0.003 Lowest SpO2, % 95.6±2.6 94.7±3.4 94.5±4.1 92.2±8.2 <0.001 CAT score 12.2±6.8 13.7±8.1 15.6±7.7 17.5±8.1 <0.001 SGRQ 35.1±17.9 38.7±19.4 46.6±20.8 49.4±20.2 <0.001 Laboratoryfindings WBC count, 103/mm3 7.2±2.4 7.3±1.9 7.8±2.4 7.9±2.8 0.001 Eosinophil, % 3.0±2.5 3.4±2.8 3.4±3.7 3.3±3.9 0.059 CRP, mg/dL 1.5±2.9 2.0±5.4 4.3±18.6 4.7±11.4 0.002 ESR, mm/h 14.0±13.3 16.5±16.4 17.3±16.4 19.5±18.2 0.061
Note: Data are presented as mean±SD or number (%).
Abbreviations: BMI, body mass index; pyrs, pack-years; ; DLco, diffusing capacity of the lung for carbon monoxide; TLC, total lung capacity; SpO2, oxygen saturation; CAT,
COPD assessment test; SGRQ, St George’s Respiratory Questionnaire; WBC, white blood cell; CRP, C-reactive protein; ESR, erythrocyte sedimentation rate.
Table 2 Comparison of comorbidities according to the clustering groups
Characteristics ACO Mild Moderate Severe p-value
No 196 313 345 341 Hypertension 87 (44.4) 124 (39.6) 136 (39.4) 126 (37.0) 0.410 Asthma 68 (34.7) 85 (27.2) 130 (37.7) 117 (34.3) 0.035 Diabetes mellitus 38 (19.4) 62 (19.9) 59 (17.1) 44 (12.9) 0.083 GERD 32 (16.3) 28 (9.0) 37 (10.8) 23 (6.7) 0.004 Allergic rhinitis 29 (14.9) 33 (10.6) 35 (10.3) 38 (11.4) 0.393 Hyperlipidemia 26 (13.3) 53 (17.0) 35 (10.4) 32 (9.3) 0.014 Myocardial infarction 11 (5.6) 22 (7.1) 19 (5.5) 8 (2.3) 0.043 Osteoporosis 10 (5.1) 17 (5.4) 22 (6.4) 11 (3.2) 0.289 Atopic dermatitis 9 (4.6) 15 (4.8) 8 (2.4) 1 (0.4) <0.001 Heart failure 6 (3.1) 8 (2.6) 13 (3.8) 10 (2.9) 0.840
Periperal vascular disease 4 (2.0) 5 (1.6) 6 (1.7) 5 (1.5) 0.958
Thyroid disease 2 (1.0) 10 (3.2) 7 (2.1) 11 (3.2) 0.331
IBD 1 (0.5) 3 (1.0) 0 (0.0) 5 (1.5) 0.107
Note: Data are presented as number (%).
Abbreviations: GERD, gastroesophageal reflux disease; IBD, inflammatory bowel disease.
International Journal of Chronic Obstructive Pulmonary Disease downloaded from https://www.dovepress.com/ by 203.255.190.41 on 22-Oct-2019
score, SGRQ, and total WBC count were significantly associated with the first AE occurrence (Table 5). On multivariate analysis using non-clustered variables with a p-value <0.1, COPD subtype, SGRQ (HR, 1.019; 95% CI, 1.014–1.024; p<0.001), and GERD comorbid-ity (HR, 1.535; 95% CI, 1.116–2.112; p=0.008) were independent factors associated with the first AE.
According to the multivariate Cox proportional hazard model, the HR for thefirst AE was significantly higher in the ACO (HR, 1.683; 95% CI 1.175–2.410; p=0.005), moderate (HR, 1.587; 95% CI, 1.145–2.200; p=0.006), and severe (HR, 1.664; 95% CI, 1.203–2.302; p=0.002) groups compared with the mild group (Figure 2B).
Table 3 Comparison of treatment use according to the clustering groups
Characteristics ACO Mild Moderate Severe p-value
No 196 313 345 341
LAMA 97 (57.1) 157 (58.8) 229 (72.9) 242 (77.3) <0.001
ICS plus LABA 58 (29.6) 66 (21.1) 169 (49.6) 159 (46.1) <0.001
Theophylline 53 (33.1) 68 (27.8) 107 (36.6) 53 (33.1) 0.015
Oral beta-2 agonist 20 (12.4) 14 (5.8) 24 (8.3) 20 (12.4) 0.134
Roflumilast 1 (0.6) 1 (0.4) 17 (5.9) 1 (0.6) <0.001
Note: Data are presented as number (%).
Abbreviations: LAMA, long-acting muscarinic antagonist; ICS, inhaled corticosteroid; LABA, long-acting beta2 agonist.
Table 4 Number of acute exacerbation of COPD according to the clustering groups
Characteristics ACO Mild Moderate Severe p-value
No 196 313 345 341
Follow-up duration, months 24 (12–36) 12 (6–24) 18 (6–30) 18 (12–36) <0.001
Total number of AE 0.79±1.42 0.36±1.01 0.90±1.58 0.86±1.37 <0.001
Number of AE per year 0.29±0.49 0.18±0.51 0.32±0.49 0.39±0.58 <0.001
Note: Data are presented as mean±SD or median (interquartile range). Abbreviations: AE, acute exacerbation; mo, month.
1.0 0.5 0.6 0.4 0.2 0.0 1.0 ACO Mild Moderate Severe
B
A
0.5 0.6 0.4 0.2 0.0 0Acute exacerbation free proportion Acute exacerbation free proportion
20 40 60 80
Time.months Time.months
100 120 140 0 20 40 60 80 100 120 140
Figure 2 Survival curve for acute exacerbation. (A) Kaplan–Meier curves showed the proportion of acute exacerbation free patients for four COPD subgroups. (B) Multivariate Cox survival curves showed the proportion of acute exacerbation free patients for four COPD subgroups.
International Journal of Chronic Obstructive Pulmonary Disease downloaded from https://www.dovepress.com/ by 203.255.190.41 on 22-Oct-2019
Discussion
Using age, BMI, smoking status, history of asthma, CAT score, FEV1, and DLco variables in clustering, we divided
patients into the following four subtypes: ACO, mild, moderate, and severe COPD. The ACO group had the second-best FEV1 and FVC values and the highest
BMI and DLco. The ACO group also showed the lowest CAT and SGRQ scores and higher rates of asthma and GERD as comorbidities. The COPD subtypes were an independent predictor for first occurrence of AE with SGRQ and GERD, and our ACO group showed a significant 76.6% increase in the rate of AE, with 65.9% and 69.6% increases in the moderate and severe groups, respectively, compared with the mild group.
Our study demonstrated that phenotype is linked to the occurrence of AE through clustering analysis using seven clinical variables without the history of AE. Previous studies identified the frequent exacerbator phenotype based on the history of AE, because a history of AE is the most powerful predictor of AE.11,12,21The Exacerbations of COPD Patients (EXACO) study revealed the frequent exacerbator pheno-type to have more impaired airflow limitation, respiratory symptoms, and daily activity limitations according to four-year follow-up of AE frequency.12 In the Evaluation of COPD Longitudinally to Identify Predictive Surrogate Endpoints (ECLIPSE) study, frequent exacerbators also showed rapid decline in FEV1, the rate of GERD or heartburn
symptoms, and elevated WBC counts compared with
non-Table 5 Univariate and multivariate Cox analysis of risk factors associated with AE occurrence
Characteristics Univariate analysis Multivariate analysis
HR 95% CI p-value HR 95% CI p-value Subgroup Mild 1.000 1.000 ACO 1.605 1.146–2.246 0.006 1.683 1.175–2.410 0.005 Moderate 1.989 1.484–2.668 <0.001 1.587 1.145–2.200 0.006 Severe 1.691 1.256–2.277 0.001 1.664 1.203–2.302 0.002 Age, years 0.994 0.984–1.004 0.217 Male 0.881 0.666–1.166 0.376 BMI, kg/m2 0.976 0.952–1.000 0.047 Smoking status Current 1.000 Former 0.978 0.812–1.179 0.818 Never 1.034 0.782–1.368 0.812
Smoking amount, pyrs 1.002 0.999–1.005 0.279
FEV1, % predicted 0.984 0.980–0.988 <0.001 FVC, % predicted 0.994 0.990–0.998 0.004 1.001 0.995–1.007 0.691 FEV1/FVC, % 0.976 0.970–0.983 <0.001 DLco, % predicted 0.999 0.995–1.003 0.661 TLC, % predicted 1.002 0.998–1.005 0.360 6MWD, meters 0.999 0.999–1.000 0.093 1.000 0.999–1.001 0.810 Initial SpO2, % 0.997 0.968–1.027 0.852 Lowest SpO2, % 0.984 0.969–0.999 0.032 0.991 0.968–1.015 0.471 CAT score 1.041 1.030–1.051 <0.001 SGRQ 1.018 1.014–1.022 <0.001 1.019 1.014–1.024 <0.001 Asthma 0.924 0.783–1.089 0.345 GERD 1.279 1.000–1.637 0.050 1.535 1.116–2.112 0.008 WBC count, 103/mm3 1.066 1.034–1.099 <0.001 1.031 0.987–1.077 0.166 CRP, mg/dL 0.997 0.983–1.011 0.677 ESR, mm/h 1.001 0.994–1.008 0.871
Abbreviations: BMI, body mass index; DLco, diffusing capacity of the lung for carbon monoxide; TLC, total lung capacity; SpO2, oxygen saturation; CAT, COPD assessment
test; SGRQ, St George’s Respiratory Questionnaire; GERD, gastroesophageal reflux disease; WBC, white blood cell; CRP, C-reactive protein; ESR, erythrocyte sedimenta-tion rate.
International Journal of Chronic Obstructive Pulmonary Disease downloaded from https://www.dovepress.com/ by 203.255.190.41 on 22-Oct-2019
frequent exacerbators.11However, the subtype related to the occurrence of AE based on clustering in our study showed mild airway limitation and respiratory symptoms and rela-tively high rates of asthma and GERD as comorbidities. These results suggest that, in addition to other factors known to be associated with AE, the ACO subtype of COPD seems to have a relationship with AE occurrence.
The reason we named one of the four clusters as a putative “ACO” group in this study is as follows. Diagnosis of ACO requires partial but not complete reversi-bility of airway limitation (post-BD FEV1<80% predicted).22
Non-impairment of DLco with post-BD FEV1<80%
predicted in the putative ACO group could be evidence for non-existing emphysema. Among the four groups, the second-most common underlying diseases, asthma and atopic dermatitis, also supported the possibility of ACO.23In clinical practice, the diagnosis of ACO, which indicates coexisting COPD and asthma, is challenging because the standard validated diagnostic criteria are still controversial.24 ACO patients are generally reported to have more frequent AE compared with pure COPD or asthma.25–28 However, ACO patients in a previous study showed relatively severe airway limitation with impaired baseline post-BD FEV1, which is a strong risk factor for
AE.11In our study, the putative ACO subtype had moderate airway limitation but a high rate of AE-COPD. In addition, our ACO group showed different characteristics from the ACO groups as defined in other studies, showing a low level of inflammatory markers and modest airway limitation and preserved functional capacity.27–29 In addition, better dyspnea scale score and functional parameters in the ACO group are also unique to our study compared with those in other studies. These results suggest that other factors are related to the occurrence of AE in addition to the conven-tional COPD severity indicators.
According to our study, the putative ACO group had the highest proportion of patients with GERD but lower propor-tions of patients who received LAMA and ICS plus LABA treatment due to mild airway limitation. The high AE occur-rence rate in the ACO group might be attributed to the high presence of GERD despite relatively mild impairment of lung function. Several studies have reported that GERD is an inde-pendent risk factor for AE-COPD.11,30–35 In the ECLIPSE study, AE-COPD was linked to the history of GERD or heart-burn with prior history of AE.11Meta-analysis based onfive prospective and retrospective COPD studies also demonstrated that the risk of AE-COPD was significantly increased in patients with GERD (relative risk: 7.57; 95% CI,
3.57–14.94).30Martinez et al demonstrated a significant rela-tionship between the frequent exacerbator phenotype (≥2 COPD-AE per year) and GERD (odds ratio, 1.40; p=0.006).35However, since most COPD patients with GERD rarely complain of either reflux symptoms (eg, heartburn, regurgitation) or respiratory symptoms (eg, cough, dyspnea),36there is a possibility that GERD diagnosis often is overlooked. Silent aspiration of gastric contents due to GERD might lead to frequent AE-COPD by increasing bacter-ial burden in the respiratory tract.37Sasaki et al showed that anti-reflux treatment significantly reduced the occurrence of AE in COPD patients without reflux symptoms,38indicating that management of GERD could be beneficial for preventing AE-COPD.
Another reason for the high incidence of AE in our putative ACO group might be the low administration of ICS plus LABA, despite the relatively high proportion of asthma. Current Global Initiative for Asthma management guidelines recommend regular use of low-dose ICS as initial treatment for symptomatic asthma patients. Furthermore, if the predominance of asthma and COPD in ACO patients is difficult to determine, first-line treat-ment should include ICS, followed by addition of other inhalers if needed.39 In our study, ICS usage in the ACO group was low, which might be due to mild impairment of lung function, good exercise capacity, and low symptom score. While the ACO group in our study was an indepen-dent factor forfirst AE occurrence, the annual incidence of AE was highest in the severe group. Although we did not collect data on changes in medication during follow-up, these findings suggest that the ACO group might have experienced inhibition of further development of AE by appropriate treatment such as ICS after occurrence of the first AE event.
The limitations of our study are as follows. First, AE in our study was not based on strict criteria since this was a retrospective cohort study. The accurate time, severity, and clinical course of AE were not evaluated. However, the occurrence of AE was carefully assessed by experi-enced pulmonologists, and all patients were evaluated at 6-month intervals. Second, the relatively short follow-up duration might result in underestimated AE occurrence; however, since the annual exacerbation frequency ranged from two to three times per year depending on the severity of COPD,40 the median 18-month follow-up duration might be sufficient to assess the first development of AE. Lastly, subjects excluded due to insufficient follow-up data (n=470) might have led to selection bias. It was not
International Journal of Chronic Obstructive Pulmonary Disease downloaded from https://www.dovepress.com/ by 203.255.190.41 on 22-Oct-2019
possible to assume the cause of follow-up loss, but it might be another reason for underestimation of AE development.
Conclusion
In conclusion, we identified the COPD subtypes susceptible to AE using cluster analysis with several clinical factors, includ-ing lung function. The ACO group had frequent AE-COPD despite good pulmonary function and exercise capacity and low dyspnea scale, which might be associated with GERD. Thus, subtypes susceptible to AE need more aggressive treat-ment strategies considering their comorbidities. Further stu-dies should highlight the specific phenotype related to mortality or lung function decline in COPD patients.
Acknowledgments
This research was supported by the National Research Foundation of Korea (NRF) grant funded by the Korean government (MSIT) (2010-0027945). The study was pre-sented at the 2018 Annual Autumn Meeting of the Korean Academy of Tuberculosis and Respiratory Diseases in Seoul, South Korea, November 10, 2018. The poster’s abstract was published in “Poster Abstracts” in the Korean Academy of Tuberculosis and Respiratory Diseases:http://www.riss.kr/link?id=A105774412.
Disclosure
The authors report no conflicts of interest in this work.
References
1. Vogelmeier CF, Criner GJ, Martinez FJ, et al. Global strategy for the diagnosis, management, and prevention of chronic obstructive lung disease 2017 report. GOLD executive summary. Am J Respir Crit Care Med.2017;195(5):557–582. doi:10.1164/rccm.201701-0150WS 2. Han MK, Agusti A, Calverley PM, et al. Chronic obstructive
pulmon-ary disease phenotypes. Am J Respir Crit Care Med. 2010;182 (5):598–604. doi:10.1164/rccm.200912-1843CC
3. Marsh SE, Travers J, Weatherall M, et al. Proportional classifications of COPD phenotypes. Thorax. 2008;63(9):761–767. doi:10.1136/ thx.2007.089193
4. Mirza S, Benzo R. Chronic obstructive pulmonary disease phenotypes: implications for care. Mayo Clin Proc. 2017;92(7):1104–1112. doi:10.1016/j.mayocp.2017.03.020
5. American Thoracic Society. Standards for the diagnosis and care of patients with chronic obstructive pulmonary disease. American thor-acic society. Am J Respir Crit Care Med.1995;152(5 Pt 2):S77–121. doi:10.1164/ajrccm.152.1.7599836
6. Kitaguchi Y, Fujimoto K, Kubo K, Honda T. Characteristics of COPD phenotypes classified according to the findings of HRCT. Respir Med. 2006;100(10):1742–1752. doi:10.1016/j. rmed.2006.02.003
7. Rodriguez-Roisin R. Toward a consensus definition for COPD exacerbations. Chest. 2000;117(5Suppl 2):398s–401s. doi:10.1378/ chest.117.5_suppl_2.398s
8. Seemungal TAR, Hurst JR, Wedzicha JA. Exacerbation rate, health status and mortality in COPD–a review of potential interventions. Int J Chron Obstruct Pulmon Dis.2009;4:203–223.
9. Toy EL, Gallagher KF, Stanley EL, Swensen AR, Duh MS. The economic impact of exacerbations of chronic obstructive pulmonary disease and exacerbation definition: a review. Copd. 2010;7 (3):214–228. doi:10.3109/15412555.2010.481697
10. Soler-Cataluña JJ, Martínez-García MÁ, Román Sánchez P, Salcedo E, Navarro M, Ochando R. Severe acute exacerbations and mortality in patients with chronic obstructive pulmonary disease. Thorax.2005;60(11):925. doi:10.1136/thx.2005.040527
11. Hurst JR, Vestbo J, Anzueto A, et al. Susceptibility to exacerbation in chronic obstructive pulmonary disease. N Engl J Med. 2010;363 (12):1128–1138. doi:10.1056/NEJMoa0909883
12. Le Rouzic O, Roche N, Cortot AB, et al. Defining the “frequent exacerbator” phenotype in COPD: a hypothesis-free approach. Chest. 2018;153(5):1106–1115. doi:10.1016/j.chest.2017.10.009
13. McLachlan G. Cluster analysis and related techniques in medical research. Stat Methods Med Res. 1992;1(1):27–48. doi:10.1177/ 096228029200100103
14. Weatherall M, Shirtcliffe P, Travers J, Beasley R. Use of cluster analysis to define COPD phenotypes. Eur Respir J. 2010;36 (3):472–474. doi:10.1183/09031936.00035210
15. Lee JY, Chon GR, Rhee CK, et al. Characteristics of patients with chronic obstructive pulmonary disease at thefirst visit to a pulmonary medical center in Korea: the Korea COpd subgroup study team cohort. J Korean Med Sci.2016;31(4):553–560. doi:10.3346/jkms.2016.31.4.553 16. Tsiligianni IG, van der Molen T, Moraitaki D, et al. Assessing health
status in COPD. A head-to-head comparison between the COPD assessment test (CAT) and the clinical COPD questionnaire (CCQ). BMC Pulm Med.2012;12(1):20. doi:10.1186/1471-2466-12-20 17. Burge PS, Calverley P, Jones PW, Spencer S, Anderson JA,
Maslen T. Randomised, double blind, placebo controlled study of fluticasone propionate in patients with moderate to severe chronic obstructive pulmonary disease: the ISOLDE trial. Bmj. 2000;320 (7245):1297–1303. doi:10.1136/bmj.320.7245.1297
18. Laboratories ACoPSfCPF. ATS statement: guidelines for the six-minute walk test. Am J Respir Crit Care Med.2002;166:111–117. doi:10.1164/ ajrccm.166.1.at1102
19. Anon. Standardization of spirometry, 1994 update. American Thoracic society. Am J Respir Crit Care Med. 1995;152 (3):1107–1136. doi:10.1164/ajrccm.152.3.7663792
20. Haldar P, Pavord ID, Shaw DE, et al. Cluster analysis and clinical asthma phenotypes. Am J Respir Crit Care Med. 2008;178 (3):218–224. doi:10.1164/rccm.200711-1754OC
21. Vestbo J, Agusti A, Wouters EF, et al. Should we view chronic obstructive pulmonary disease differently after ECLIPSE? A clinical perspective from the study team. Am J Respir Crit Care Med. 2014;189 (9):1022–1030. doi:10.1164/rccm.201311-2006PP
22. Miravitlles M. Diagnosis of asthma–COPD overlap: the five command-ments. Eur Respiratory Soc.2017. doi:10.1183/13993003.00506-2017 23. Caillaud D, Chanez P, Escamilla R, et al. Asthma-COPD overlap
syndrome (ACOS) vs‘pure’ COPD: a distinct phenotype? Allergy. 2017;72(1):137–145. doi:10.1111/all.13004
24. Yanagisawa S, Ichinose M. Definition and diagnosis of asthma-COPD overlap (ACO). Allergol Int. 2018;67(2):172–178. doi:10.1016/j.alit.2018.01.002
25. Kauppi P, Kupiainen H, Lindqvist A, et al. Overlap syndrome of asthma and COPD predicts low quality of life. J Asthma.2011;48 (3):279–285. doi:10.3109/02770903.2011.555576
26. Hardin M, Silverman EK, Barr RG, et al. The clinical features of the overlap between COPD and asthma. Respir Res. 2011;12:127. doi:10.1186/1465-9921-12-122
International Journal of Chronic Obstructive Pulmonary Disease downloaded from https://www.dovepress.com/ by 203.255.190.41 on 22-Oct-2019
27. Menezes AMB, Montes de Oca M, Perez-Padilla R, et al. Increased risk of exacerbation and hospitalization in subjects with an overlap phenotype: COPD-asthma. Chest.2014;145(2):297–304. doi:10.1378/ chest.13-0622
28. Hardin M, Cho M, McDonald ML, et al. The clinical and genetic features of COPD-asthma overlap syndrome. Eur Respir J.2014;44 (2):341–350. doi:10.1183/09031936.00216013
29. Duong-Quy S, Tran Van H, Vo Thi Kim A, Pham Huy Q, Craig TJ. Clinical and functional characteristics of subjects with asthma, COPD, and asthma-COPD overlap: a multicentre study in Vietnam. Can Respir J.2018;2018. doi:10.1155/2018/1732946
30. Sakae TM, Pizzichini MMM, Teixeira PJZ, Silva R, Trevisol DJ, Pizzichini E. Exacerbations of COPD and symptoms of gastroeso-phageal reflux: a systematic review and meta-analysis. Jornal Brasileiro De Pneumologia. 2013;39(3):259–271. doi:10.1590/ S1806-37132013000300002
31. Terada K, Muro S, Sato S, et al. Impact of gastro-oesophageal reflux disease symptoms on COPD exacerbation. Thorax. 2008;63 (11):951–955. doi:10.1136/thx.2007.092858
32. Lin YH, Tsai CL, Chien LN, Chiou HY, Jeng C. Newly diagnosed gastroesophageal reflux disease increased the risk of acute exacerba-tion of chronic obstructive pulmonary disease during the first year following diagnosis–a nationwide population-based cohort study. Int J Clin Pract.2015;69(3):350–357. doi:10.1111/ijcp.12501 33. Kim J, Lee JH, Kim Y, et al. Association between chronic obstructive
pulmonary disease and gastroesophageal reflux disease: a national cross-sectional cohort study. BMC Pulm Med. 2013;13(1):51. doi:10.1186/1471-2466-13-51
34. Ingebrigtsen TS, Marott JL, Vestbo J, Nordestgaard BG, Hallas J, Lange P. Gastro-esophageal reflux disease and exacerbations in chronic obstructive pulmonary disease. Respirology. 2015;20 (1):101–107. doi:10.1111/resp.12420
35. Martinez CH, Okajima Y, Murray S, et al. Impact of self-reported gastroesophageal reflux disease in subjects from COPDGene cohort. Respir Res.2014;15(1):62. doi:10.1186/1465-9921-15-62
36. Casanova C, Baudet JS, del Valle Velasco M, et al. Increased gastro-oesophageal reflux disease in patients with severe COPD. Eur Respir J.2004;23(6):841–845.
37. Terada K, Muro S, Ohara T, et al. Abnormal swallowing reflex and COPD exacerbations. Chest. 2010;137(2):326–332. doi:10.1378/ chest.09-0482
38. Sasaki T, Nakayama K, Yasuda H, et al. A randomized, single-blind study of lansoprazole for the prevention of exacerbations of chronic obstructive pulmonary disease in older patients. J Am Geriatr Soc. 2009;57(8):1453–1457. doi:10.1111/j.1532-5415.2009.02349.x 39. Asthma GIf. Global strategy for asthma management and prevention,
2018 Available from:www.ginasthma.org; 2018 Assessed January 2018.
40. Donaldson G, Seemungal T, Bhowmik A, Wedzicha J. Relationship between exacerbation frequency and lung function decline in chronic obstructive pulmonary disease. Thorax. 2002;57(10):847–852. doi:10.1136/thorax.57.10.847
International Journal of Chronic Obstructive Pulmonary Disease
Dove
press
Publish your work in this journal
The International Journal of COPD is an international, peer-reviewed journal of therapeutics and pharmacology focusing on concise rapid reporting of clinical studies and reviews in COPD. Special focus is given to the pathophysiological processes underlying the disease, inter-vention programs, patient focused education, and self management
protocols. This journal is indexed on PubMed Central, MedLine and CAS. The manuscript management system is completely online and includes a very quick and fair peer-review system, which is all easy to use. Visit http://www.dovepress.com/testimonials.php to read real quotes from published authors.
Submit your manuscript here: https://www.dovepress.com/international-journal-of-chronic-obstructive-pulmonary-disease-journal
International Journal of Chronic Obstructive Pulmonary Disease downloaded from https://www.dovepress.com/ by 203.255.190.41 on 22-Oct-2019