O r I g I n a l r e s e a r C h
open access to scientific and medical research Open access Full Text article
Characteristics and self-rated health
of overlap syndrome
Jung Wha Chung1
Kyoung ae Kong2
Jin hwa lee1
seok Jeong lee1
Yon Ju ryu1
Jung hyun Chang1
1Division of Pulmonary and Critical
Care Medicine, Department of Internal Medicine, school of Medicine, ewha Womans University, 2Clinical
Trial Center, ewha Womans University Mokdong hospital, seoul, Korea
Correspondence: Jin hwa lee Division of Pulmonary and Critical Care Medicine, Department of Internal Medicine, school of Medicine, ewha Womans University,1071 anyangcheon-ro, Yangcheon-gu, seoul 158-710, Korea
email [email protected]
Background and objective: Overlap syndrome shares features of both asthma and chronic obstructive pulmonary disease (COPD). The aim of this study was to investigate characteristics of overlap syndrome and their effect on self-rated health (SRH).
Methods: We analyzed data from the Fourth Korea National Health and Nutrition Examination Survey of 2007–2009. Subjects with acceptable spirometry and available wheezing history were included. Subjects were classified into four groups based on forced expiratory volume in one second (FEV1)/forced vital capacity (FVC) results and the presence or absence of self-reported wheezing for the previous 12 months: 1) COPD group, defined as having FEV1/FVC ,0.7 without self-reported wheezing history; 2) asthma group, defined as having self-reported wheezing history without FEV1/FVC ,0.7; 3) overlap syndrome group, having both FEV1/ FVC ,0.7 and wheezing history; and 4) non-obstructive disease (NOD) group, having neither FEV1/FVC ,0.7 nor self-reported wheezing. SRH was categorized as better or lower based on responses to a questionnaire.
Results: From a total 9,104 subjects, 700 were assigned to the COPD group, 560 to the asthma group, 210 to the overlap syndrome group, and 7,634 to the NOD group. Compared to the other groups, subjects in the overlap syndrome group were more likely to have low lung function, a high proportion of smokers, low socioeconomic status, short education duration, lower SRH, and past diagnosis of pulmonary tuberculosis or bronchiectasis. Multiple logistic regression analysis revealed that both overlap syndrome and asthma groups were independently associated with lower SRH after adjustment for age, sex, socioeconomic status, education level, smoking status, comorbidities, and lung function. Female, old age, low education level, low economic status, smoker and other comorbidities were also associated with lower SRH.
Conclusion: Overlap syndrome was accompanied by high morbidity and was associated with lower SRH, which needs more appropriate care.
Keywords: chronic obstructive lung disease, asthma, overlap syndrome, self-rated health, COPD
Introduction
Chronic obstructive pulmonary disease (COPD) and asthma are the most common airway diseases. While COPD patients are likely to be older, smokers, and have persistent and usually progressive airflow limitation, patients with asthma tend to be younger,
non-smokers, and have atopy and/or allergies and reversible airway obstruction.1 However,
in practice, airflow limitation that is not fully reversible is insufficient to explain COPD. Since some patients with asthma also develop poorly reversible airway limitation, differ-ential diagnosis is sometimes difficult for clinicians. In the elderly with COPD, variable airway obstruction is commonly observed. Approximately half of COPD patients have Number of times this article has been viewed
This article was published in the following Dove Press journal: International Journal of COPD
both COPD and asthma (overlap syndrome), and coexistence of the two diseases increases with age.2 Increased airway
hyper-responsiveness (AHR) is reported to be associated with
increased COPD exacerbations and overall mortality.3
Overlap syndrome is defined as having both AHR and incompletely reversible airway obstruction.4,5 In patients
with overlap syndrome, forced expiratory volume in one
second (FEV1) does not return to normal and often worsens
over time. Since these patients are generally excluded from studies examining either disease, the clinical implications
of overlap syndrome remain poorly recognized.4 Despite a
high prevalence of COPD and asthma in the general Korean population,6–8 clinical features of patients with overlap
syn-drome have not been well described.
The aim of our study was to characterize overlap syndrome and investigate its impact on self-rated health (SRH) by using the data from the Fourth Korea National Health and Nutrition
Examination Survey of 2007–2009 (KNHANES IV survey).8
Methods
subjects
Data from the KNHANES IV survey conducted between July 2007 and December 2009 were reviewed retrospectively. The survey was conducted as a cross-sectional observational study using complex, stratified multistage cluster sampling. It was designed as a rolling sample survey based on the 2005 Korean population and housing census; once subjects were
interviewed, they were not interviewed again. Data were obtained from independent samples for each year, repre-senting the total non-institutionalized population of Korea. Among the 24,971 potential subjects, 18,406 were .19 years. We excluded subjects with unavailable respiratory symptoms and poor spirometry results; that is, results that did not meet an acceptable flow-volume loop or were not reproducible. Finally, 9,104 subjects were enrolled (Figure 1). The study was approved by the Korea Centers for Disease Control and Prevention Institutional Review Board, and informed consent was obtained from each participant.
Medical histories of respiratory symptoms and comor-bidities, duration of education, and socioeconomic status were obtained by questionnaire. Height, weight, waist circumference, and blood pressure were measured in all subjects. Triglyceride and high-density lipoprotein (HDL) cholesterol levels were obtained after 12 hours of fasting.
Spirometry was performed on all subjects .19 years. FEV1
and forced vital capacity (FVC) were measured, and a pre-dicted ratio for each parameter was calculated based on age, sex, height, and race.
Definitions
Subjects were assigned to one of four groups based on data reported for the previous 12 months: 1) the COPD group was defined as subjects having an FEV1/FVC ratio ,0.7 without history of self-reported wheezing; 2) the asthma
KNHANES IV* (N=24,971) Exclusion (N=9,302) • Unacceptable spirometry • Non-responders to wheezing questionnaire ≥19 years (N=18,406) Eligible subjects (N=9,104) Asthma (N=560) (N=700)COPD Non-obstructive disease (N=7,634) Overlap syndrome (N=210) Figure 1 study design.
Note: *Knhanes IV, Fourth Korea national health and nutrition examination survey, 2007–2009.8
group was comprised of subjects with a history of wheezing
without FEV1/FVC ,0.7; 3) the overlap syndrome group
included subjects with both FEV1/FVC ,0.7 and a history
of self-reported wheezing; the remaining subjects made up the non-obstructive disease (NOD) group.
SRH was assessed by asking the following question: “Would you say your general health status is excellent, very good, good, fair, or poor?” Based on responses, subjects were categorized into two outcome measures: better (excellent,
very good, and good), and lower (fair and poor).9 Standard
questions were used to assess underlying disease such as, “Has a medical doctor ever told you that you had the follow-ing diseases: COPD, asthma, pulmonary tuberculosis, bron-chiectasis, hypertension, diabetes mellitus, cerebrovascular disease, osteoarthritis, allergic rhinitis, or atopic dermatitis?” with the response alternatives “Yes” or “No” for each option. They were also asked about their wheezing history using the question: “Have you had wheezing or whistling in your chest at any time during the previous year?” Metabolic syndrome was diagnosed when more than three of the five criteria out-lined by the National Cholesterol Education Program’s Adult
Treatment Panel III (NCEP/ATP III) were met.10 Mean blood
pressure was used for diagnosis of metabolic syndrome. Never-smoker was defined as having smoked less than five packs of cigarettes during their lifetime.
statistical analyses
Descriptive analysis was performed for all variables. Categorical variables were analyzed by chi-square test. Regression analysis for sampling survey data and Tukey’s post hoc test were used to compare continuous numeric variables among the four groups. All estimates were cal-culated using the appropriate sampling weight provided in KNHANES IV, and standard errors (SE) were calculated reflecting complex design and survey weight. Simple logistic regression analysis was used to evaluate association between individual factors and lower SRH, and multiple logistic regression analysis of possible risk factors was performed using SAS version 9.2 statistical software (SAS institute Inc., Cary NC, USA). A P-value ,0.05 was considered statistically significant.
Results
subject characteristics
Of the 9,104 subjects with eligible spirometry and available wheezing history, 700 were admitted to the COPD group; 560 to the asthma group; 210 to the overlap syndrome group; and 7,634 to the NOD group. Epidemiological characteristics of the
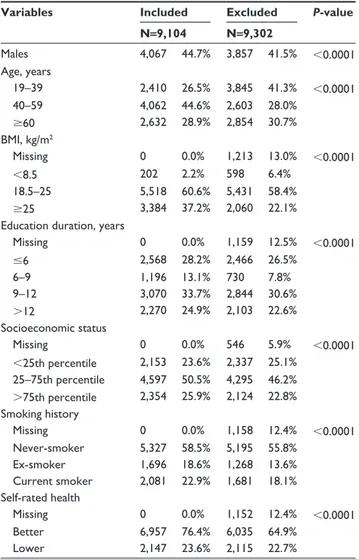
subjects are summarized in Table 1 and comparisons between included and excluded subjects are shown in Table S1.
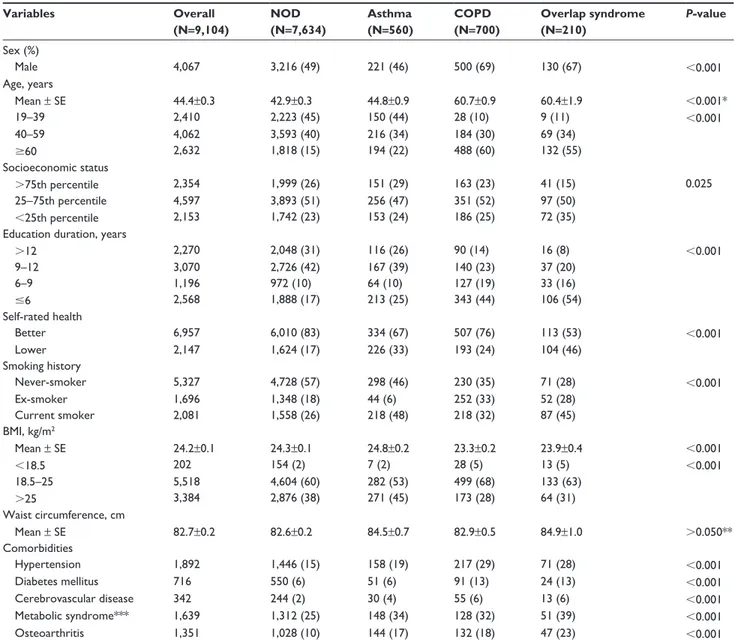
Table 1 shows that the mean age of all subjects was 44.4 years, whereas mean age of the COPD group was 60.7 years, and that of the overlap syndrome group 60.4 years. The overlap syndrome and COPD groups showed a higher proportion of males compared to the asthma group (67% and 69%, respectively, versus 46%). There were more smokers in the overlap syndrome group (73%) than in the COPD, asthma, and NOD groups (65%, 54%, and 44%, respectively). Subjects with overlap syndrome had the highest propor-tion of low socioeconomic status and fewer than 6 years of education, followed by the COPD and asthma groups. Metabolic syndrome and osteoarthritis were most prevalent in the overlap syndrome group. Except for metabolic syn-drome, all comorbidities were more common in the COPD and overlap syndrome groups than the asthma group, which was likely due to their higher mean age. Despite higher mean age and prevalence of comorbidities (except for metabolic syndrome), the COPD group showed better SRH than the asthma group.
To identify factors associated with each airway disease, we performed multinomial logistic regression analysis; results are summarized in Table 2. While sex was associated with both asthma and COPD, old age increased the risks in both COPD and overlap syndrome groups. Low socioeco-nomic status was associated with overlap syndrome, and short education duration and smoking status were associ-ated with all airway diseases. While lower body mass index (BMI) increased risk of both COPD and overlap syndrome, being overweight seemed to decrease risk of COPD. Except for osteoarthritis, other comorbidities were not associated with AHR.
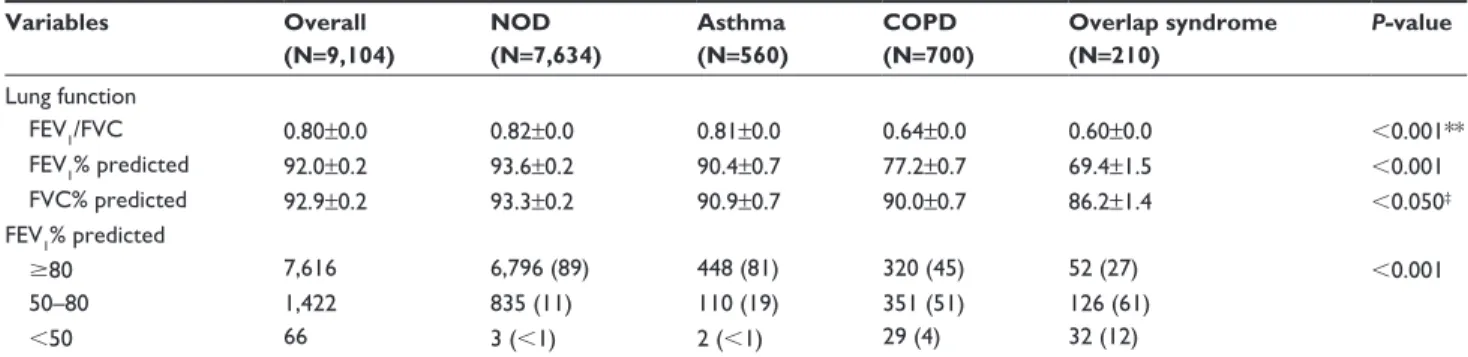
Table 3 shows the lung function of subjects. FEV1/FVC,
FEV1, and FVC were lowest in the overlap syndrome group.
Table 4 shows the history of respiratory and allergic disease based on questionnaire responses. Subjects previously diag-nosed with pulmonary tuberculosis or bronchiectasis were the most common subjects in the overlap syndrome group compared to the other three groups.
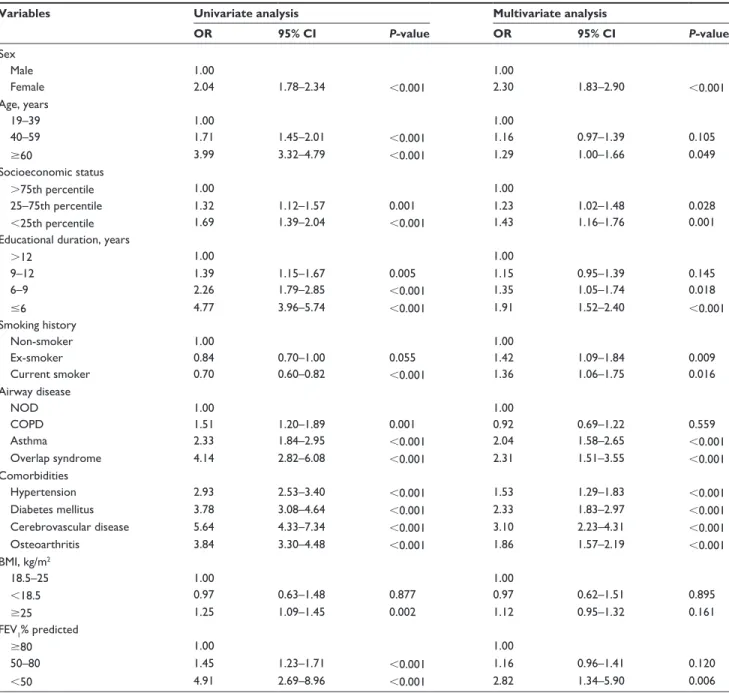
Factors associated with lower srh
Independent factors associated with lower SRH are sum-marized in Table 5. In a multiple logistic regression analysis using NOD as a reference, overlap syndrome was the strongest factor associated with lower SRH (odds ratio [OR]: 2.31, 95% confidence interval [CI]: 1.51–3.55, P,0.001), followed by the asthma group (OR: 2.04, 95% CI: 1.58–2.65, P,0.001).
Table 1 epidemiological characteristics Variables Overall (N=9,104) NOD (N=7,634) Asthma (N=560) COPD (N=700) Overlap syndrome (N=210) P-value sex (%) Male 4,067 3,216 (49) 221 (46) 500 (69) 130 (67) ,0.001 age, years Mean ± se 44.4±0.3 42.9±0.3 44.8±0.9 60.7±0.9 60.4±1.9 ,0.001* 19–39 2,410 2,223 (45) 150 (44) 28 (10) 9 (11) ,0.001 40–59 4,062 3,593 (40) 216 (34) 184 (30) 69 (34) $60 2,632 1,818 (15) 194 (22) 488 (60) 132 (55) socioeconomic status .75th percentile 2,354 1,999 (26) 151 (29) 163 (23) 41 (15) 0.025 25–75th percentile 4,597 3,893 (51) 256 (47) 351 (52) 97 (50) ,25th percentile 2,153 1,742 (23) 153 (24) 186 (25) 72 (35)
education duration, years
.12 2,270 2,048 (31) 116 (26) 90 (14) 16 (8) ,0.001 9–12 3,070 2,726 (42) 167 (39) 140 (23) 37 (20) 6–9 1,196 972 (10) 64 (10) 127 (19) 33 (16) #6 2,568 1,888 (17) 213 (25) 343 (44) 106 (54) self-rated health Better 6,957 6,010 (83) 334 (67) 507 (76) 113 (53) ,0.001 lower 2,147 1,624 (17) 226 (33) 193 (24) 104 (46) smoking history never-smoker 5,327 4,728 (57) 298 (46) 230 (35) 71 (28) ,0.001 ex-smoker 1,696 1,348 (18) 44 (6) 252 (33) 52 (28) Current smoker 2,081 1,558 (26) 218 (48) 218 (32) 87 (45) BMI, kg/m2 Mean ± se 24.2±0.1 24.3±0.1 24.8±0.2 23.3±0.2 23.9±0.4 ,0.001 ,18.5 202 154 (2) 7 (2) 28 (5) 13 (5) ,0.001 18.5–25 5,518 4,604 (60) 282 (53) 499 (68) 133 (63) .25 3,384 2,876 (38) 271 (45) 173 (28) 64 (31) Waist circumference, cm Mean ± se 82.7±0.2 82.6±0.2 84.5±0.7 82.9±0.5 84.9±1.0 .0.050** Comorbidities hypertension 1,892 1,446 (15) 158 (19) 217 (29) 71 (28) ,0.001 Diabetes mellitus 716 550 (6) 51 (6) 91 (13) 24 (13) ,0.001 Cerebrovascular disease 342 244 (2) 30 (4) 55 (6) 13 (6) ,0.001 Metabolic syndrome*** 1,639 1,312 (25) 148 (34) 128 (32) 51 (39) ,0.001 Osteoarthritis 1,351 1,028 (10) 144 (17) 132 (18) 47 (23) ,0.001
Notes: Data are presented as mean ± se or number (percentage). *P,0.001 were obtained except asthma versus nOD group (P=0.173) and COPD versus overlap
syndrome group (P=0.998) by post hoc Tukey’s method; **P.0.05 were obtained except asthma group versus nOD group, P=0.021 by post hoc Tukey’s method. ***a total of 5,551 subjects were analyzed.
Abbreviations: nOD, non-obstructive disease; COPD, chronic obstructive pulmonary disease; n, number of subjects; BMI, body mass index; se, standard error.
Adjusting for other factors such as sex, age, smoking, other comorbidities and FEV1, the COPD group lost statistical significance. In addition, female sex, age .60 years, low socioeconomic status, education duration ,9 years,
pres-ence of smoking history, and FEV1 ,50% were also
asso-ciated with lower SRH. Neither obesity (BMI $25 kg/m2)
nor low weight (BMI ,18.5 kg/m2) were associated with
lower SRH.
Discussion
The current study demonstrated that the overlap syndrome group makes up a significant portion of obstructive lung
disease with high burden of morbidity based on data from a national population-based survey. Overlap syndrome was also independently associated with lower SRH. Subjects were classified into four groups using FEV1/FVC results for airway obstruction and wheezing history as markers of AHR. These groups showed significant differences in variable individual factors during analyses, which provided validity to the study design. Each group represented a unique disease entity. For example, the COPD group had a greater number of clinical factors (increased age, higher prevalence of smoking, and comorbidities) compared to the asthma group. The overlap syndrome group showed a similar trend
Table 3 lung function Variables Overall (N=9,104) NOD (N=7,634) Asthma (N=560) COPD (N=700) Overlap syndrome (N=210) P-value lung function FeV1/FVC 0.80±0.0 0.82±0.0 0.81±0.0 0.64±0.0 0.60±0.0 ,0.001** FeV1% predicted 92.0±0.2 93.6±0.2 90.4±0.7 77.2±0.7 69.4±1.5 ,0.001 FVC% predicted 92.9±0.2 93.3±0.2 90.9±0.7 90.0±0.7 86.2±1.4 ,0.050‡ FeV1% predicted $80 7,616 6,796 (89) 448 (81) 320 (45) 52 (27) ,0.001 50–80 1,422 835 (11) 110 (19) 351 (51) 126 (61) ,50 66 3 (,1) 2 (,1) 29 (4) 32 (12)
Notes: Data are presented as mean ± se or number (percentage). **P,0.001 were obtained except asthma versus nOD group, P=0.004 by post hoc Tukey’s method. ‡P,0.050 were obtained except COPD group versus asthma group (P=0.794), COPD group versus overlap syndrome group (P=0.060) by post hoc Tukey’s method.
Abbreviations: nOD, non-obstructive disease; COPD, chronic obstructive pulmonary disease; n, the number of subjects; FeV1, forced expiratory volume in one second;
FVC, forced volume capacity; se, standard error.
Table 2 Multinomial logistic regression analysis to identify factors associated with airway diseases
Variables Asthma COPD Overlap syndrome
OR 95% CI P-value OR 95% CI P-value OR 95% CI P-value
sex Male 1 1 1 Female 1.81 1.28–2.58 0.0009 0.41 0.28–0.60 ,0.0001 0.61 0.34–1.07 0.087 age, years 19–39 1 1 1 40–59 0.88 0.66–1.17 ns 2.90 1.82–4.63 ,0.0001 2.77 1.09–7.04 0.032 $60 1.26 0.84–1.89 ns 14.53 8.83–23.90 ,0.0001 9.50 3.39–26.63 ,0.0001
socioeconomic status, percentile
.75th 1 1 1
,25th 0.79 0.58–1.08 ns 1.12 0.83–1.50 ns 1.87 1.11–3.16 0.02
25–75th 0.75 0.57–0.99 0.04 1.07 0.81–1.41 ns 1.42 0.90–2.25 ns
education duration, years
.12 1 1 1 #6 1.45 1.00–2.09 0.048 2.16 1.46–3.20 0.0001 4.28 1.87–9.79 0.0006 6–9 1.15 0.75–1.76 ns 2.08 1.38–3.13 0.0004 2.58 1.00–6.62 0.049 9–12 1.03 0.75–1.42 ns 1.13 0.78–1.64 ns 1.32 0.65–2.68 ns smoking never-smoker 1 1 1 ex-smoker 0.67 0.42–1.06 0.085 1.50 1.04–2.17 0.032 2.64 1.44–4.83 0.002 Current 4.06 2.92–5.64 ,0.0001 1.99 1.39–2.87 0.0002 5.07 3.04–8.46 ,0.0001 BMI, kg/m2 18.5–25 1 1 1 ,18.5 0.85 0.32–2.26 ns 2.14 1.05–4.35 0.036 2.57 1.18–5.57 0.02 $25 1.25 0.99–1.58 0.056 0.65 0.51–0.83 0.0005 0.74 0.48–1.14 ns hypertension no 1 1 1 Yes 1.02 0.77–1.35 ns 0.86 0.68–1.08 ns 0.86 0.57–1.30 ns Diabetes mellitus no 1 1 1 Yes 0.86 0.57–1.31 ns 1.05 0.77–1.44 ns 1.12 0.62–2.03 ns Cerebrovascular disease no 1 1 1 Yes 1.56 0.97–2.53 0.068 0.87 0.60–1.28 ns 0.92 0.43–1.95 ns Osteoarthritis no 1 1 1 Yes 1.61 1.19–2.17 0.002 1.09 0.78–1.52 ns 1.41 0.87–2.31 ns
Table 5 Factors associated with lower self-rated health (n=9,104)
Variables Univariate analysis Multivariate analysis
OR 95% CI P-value OR 95% CI P-value sex Male 1.00 1.00 Female 2.04 1.78–2.34 ,0.001 2.30 1.83–2.90 ,0.001 age, years 19–39 1.00 1.00 40–59 1.71 1.45–2.01 ,0.001 1.16 0.97–1.39 0.105 $60 3.99 3.32–4.79 ,0.001 1.29 1.00–1.66 0.049 socioeconomic status .75th percentile 1.00 1.00 25–75th percentile 1.32 1.12–1.57 0.001 1.23 1.02–1.48 0.028 ,25th percentile 1.69 1.39–2.04 ,0.001 1.43 1.16–1.76 0.001
educational duration, years
.12 1.00 1.00 9–12 1.39 1.15–1.67 0.005 1.15 0.95–1.39 0.145 6–9 2.26 1.79–2.85 ,0.001 1.35 1.05–1.74 0.018 #6 4.77 3.96–5.74 ,0.001 1.91 1.52–2.40 ,0.001 smoking history non-smoker 1.00 1.00 ex-smoker 0.84 0.70–1.00 0.055 1.42 1.09–1.84 0.009 Current smoker 0.70 0.60–0.82 ,0.001 1.36 1.06–1.75 0.016 airway disease nOD 1.00 1.00 COPD 1.51 1.20–1.89 0.001 0.92 0.69–1.22 0.559 asthma 2.33 1.84–2.95 ,0.001 2.04 1.58–2.65 ,0.001 Overlap syndrome 4.14 2.82–6.08 ,0.001 2.31 1.51–3.55 ,0.001 Comorbidities hypertension 2.93 2.53–3.40 ,0.001 1.53 1.29–1.83 ,0.001 Diabetes mellitus 3.78 3.08–4.64 ,0.001 2.33 1.83–2.97 ,0.001 Cerebrovascular disease 5.64 4.33–7.34 ,0.001 3.10 2.23–4.31 ,0.001 Osteoarthritis 3.84 3.30–4.48 ,0.001 1.86 1.57–2.19 ,0.001 BMI, kg/m2 18.5–25 1.00 1.00 ,18.5 0.97 0.63–1.48 0.877 0.97 0.62–1.51 0.895 $25 1.25 1.09–1.45 0.002 1.12 0.95–1.32 0.161 FeV1% predicted $80 1.00 1.00 50–80 1.45 1.23–1.71 ,0.001 1.16 0.96–1.41 0.120 ,50 4.91 2.69–8.96 ,0.001 2.82 1.34–5.90 0.006
Abbreviations: OR, odds ratio; CI, confidence interval; NOD, non-obstructive disease; COPD, chronic obstructive pulmonary disease; BMI, body mass index; FEV1, forced
expiratory volume in one second; n, number of subjects.
Table 4 Past history of respiratory or allergic diseases based on responses to questionnaires*
Diseases Overall (N=9,104) NOD (N=7,634) Asthma (N=560) COPD (N=700) Overlap syndrome (N=210) COPD 64 (1) 28 (,1) 9 (2) 11 (1) 16 (7) asthma 325 (3) 116 (1) 95 (14) 34 (6) 80 (40)
COPD and asthma 15 (,1) 1 (,1) 3 (1) 1 (,1) 10 (4)
Tuberculosis 533 (5) 365 (4) 31 (7) 94 (15) 43 (21)
Bronchiectasis 57 (1) 23 (,1) 7 (1) 10 (1) 17 (6)
allergic rhinitis 862 (11) 726 (11) 75 (15) 41 (7) 20 (10)
atopic dermatitis 216 (3) 180 (3) 24 (7) 8 (1) 4 (1)
Notes: Data are presented as number (percentage). *In all comparisons, P,0.001 by chi-square test.
as the COPD group, but most of the clinical factors were worse than those of the COPD group, except for comorbidi-ties. Among subjects of overlap syndrome, almost half of them presented lower SRH, which is the highest rate among the four groups. These results were very similar to those from a previous study that demonstrated that adults with overlap syndrome, asthma, or COPD reported more health impairments compared to those with neither disease, and adults with overlap syndrome and COPD were more likely to have comorbidities.11
Despite these distinctive clinical characteristics, the physician diagnostic rate for obstructive disease was well below 20% in the COPD and asthma groups in that study. This suggests that disease severity in each group tended to be low in this population-based study, and/or that some subjects were considerably underdiagnosed. On the other hand, both difficulty in differential diagnosis and lack of comprehension of these diseases were likely to contribute to a low diagnosis rate.
Some COPD patients have shown characteristics of asthma and have been diagnosed as asthmatics. Some asthma patients share the same features of COPD; yet, there has been no consensus on the definition and diagnostic criteria of over-lap syndrome. According to the Dutch hypothesis, asthma, chronic bronchitis, and emphysema are different expressions of the same disease entity, and influenced by environmental and genetic influences.12,13 A cohort study has suggested that
asthma could be a risk factor for COPD development.14
The clinical features of the overlap syndrome group in the current study were remarkable. The group showed a greater rate of history of structural diseases such as pulmonary tuberculosis and bronchiectasis than the other groups. This could be linked to lower socioeconomic status, since both low economic status and shorter education duration were associ-ated with overlap syndrome. Additionally, 40% of subjects in the overlap syndrome group had been diagnosed with asthma in the past. These results could support the hypothesis that asthma and AHR predispose individuals to develop COPD or fixed airway obstruction later in life.12 Structural diseases can
also be potential predisposing factors.15–18 Childhood
respira-tory infection has been associated with airway obstruction
and/or bronchiectasis.19 Another explanation could be that
overlap syndrome progressed under the influence of environ-mental factors like aging, smoking, or undertreatment due to low educational and socioeconomic status. These hypotheses could provide insights for further understanding of obstruc-tive lung disease, including overlap syndrome.
Some degree of airflow obstruction of as much as FEV1
25–30 mL/year is related to the natural aging process of lung function decrease. Airflow obstruction appears to be more of a fixed pattern in the elderly with asthma, whose symptoms worsen and respond poorly to treatment.20 Similarly, the
prevalence of AHR in COPD patients is increased as much as 3× in the elderly compared to non-elderly patients.21 Studies
have shown that 50% of the elderly with airway disease have airflow variability with some degree of irreversible airway obstruction.4,22 Likewise, aging and cigarette smoking are
other strong risk factors for obstructive lung disease. Smoking increases neutrophilic inflammation and interferes with the anti-inflammatory actions of corticosteroids, ie, steroid resistance.23 Chronic inflammation and airway remodeling are
influenced by smoking in both asthma and COPD patients. Despite the fact that the COPD group had a greater number of subjects aged $60 years with comorbidities and asthma group subjects had more preserved lung function, the COPD group had relatively fewer subjects with lower SRH compared to the asthma group. The overlap syndrome group showed the highest association with lower SRH, followed by the asthma group. The COPD group did not show any asso-ciations with the other groups, despite significant association
between low FEV1 and lower SRH. These results support the
hypothesis that subjective symptoms rather than objective airflow obstruction results can affect individual SRH.
Many studies have focused on symptoms. The presence of dyspnea has been shown to predict 5 year survival better
than airway obstruction in patients with COPD.24 The BODE
Index is a better predictor of mortality than FEV1 alone; it includes BMI, airflow obstruction, the Modified Medical Research Council Dyspnea Scale (MMRC), and the 6 minute walk distance test for exercise capacity.25 The recent Global
initiative for chronic Obstructive Lung Disease (GOLD) classification includes levels of daily symptoms, particularly self-reported dyspnea by MMRC scale, frequency of exac-erbations, and level of lung function to stratify future risk.1
Using this classification, a population-based study demon-strated the role of dyspnea in COPD even among individuals with relatively preserved FEV1.26
While a previous study showed that patients with overlap syndrome had lower health-related quality of life compared to those with asthma,27 the current study’s asthma group rather
than the COPD group showed lower SRH. This inconsistency could be due to differences in study subjects and the question-naires used. Subjects were from a population-based survey, and most of them were more likely to have mild-to-moderate
airflow limitation, whereas the previous study used patients
with a diagnosis of asthma or COPD or both.27 In that study
of search predictors of a decline in health-related quality of life in patients with asthma or COPD, respiratory symptoms were an important predictor of decline in health-related quality of life.28
The current study has several limitations. First, the exami-nation survey was not solely designed for airway disease, and spirometry was not used in all participants. This resulted in selection bias. In addition, the overall participation rate was low, and only subjects with eligible spirometry results were enrolled. Subjects with no symptoms were excluded, and severely ill patients were excluded due to unsuitable data. Different sampling weights provided by KNHANES IV were used to minimize the healthy worker effect.8 Second,
the presence of AHR was not determined based on objective methods but on a subjective questionnaire. This could have led to a misdiagnosis and heterogeneity of subjects in each group. Some asthmatics who were uncontrolled or who had underlying structural disease might have been misclassified to the overlap syndrome group. Some COPD patients with recent exacerbations could also have been misclassified. In the setting of a general population-based study however, the use of objective methods was unfeasible and impractical; although self-assessment methods have been widely used in previous studies.29,30 Third, there was no information about
use of medications that could influence lung function such as inhaled corticosteroids and bronchodilators. Their potential use and effects were excluded, since pre-study omission was not implemented and questionnaires did not include regular medication use. However, most subjects were considered as not having been treated due to the low rate of physician diagnosis. Lastly, SRH is subjective and not a standardized item.
Health status is influenced by many other emotional and psychological factors. There were inter- and intra-individual differences in expression of SRH, even in the NOD group. Health status is not an appropriate marker to apply to all patients equally in practice. Nevertheless, a recent study reported that SRH was strongly associated with quality of life
in asthma subjects.31 SRH as a simple method for assessing
health status related to disease has an advantage of being easier to explain to patients compared to a complicated respiratory questionnaire.
Conclusion
Obstructive lung disease is considered an aggregate of hetero-geneous diseases with unique features. Compared to subjects with airway obstruction and no wheezing, subjects from our
asthma and overlap syndrome groups showed lower SRH, although each subgroup did not represent a specific clini-cal disease entity. This study provides further evidence that overlap syndrome is an important and understudied disease, and that this population needs more appropriate care when considering the high burden of morbidity and lower SRH.
Acknowledgments
This research was supported by the Basic Science Research Program through the National Research Foundation of Korea (NRF) funded by the Ministry of Science, ICT & Future Planning (2010-0027945).
Author contributions
Study concept and design, JH Lee; data acquisition and quality control, JW Chung, KA Kong, SJ Lee; analysis and interpretation: JW Chung, KA Kong, JH Lee; critical revision of manuscript, all authors. All authors contributed toward data analysis, drafting and revising the paper and agree to be accountable for all aspects of the work.
Disclosure
The authors report no conflicts of interest in this work.
References
1. Vestbo J, Hurd SS, Agusti AG, et al. Global strategy for the diagnosis, management, and prevention of chronic obstructive pulmonary disease: GOLD executive summary. Am J Respir Crit Care Med. 2013;187(4): 347–365.
2. Soriano JB, Davis KJ, Coleman B, Visick G, Mannino D, Pride NB. The proportional Venn diagram of obstructive lung disease: two approximations from the United States and the United Kingdom. Chest. 2003;124(2):474–481.
3. Hospers JJ, Postma DS, Rijcken B, Weiss ST, Schouten JP. Histamine airway hyper-responsiveness and mortality from chronic obstructive pul-monary disease: a cohort study. Lancet. 2000;356(9238):1313–1317. 4. Gibson PG, Simpson JL. The overlap syndrome of asthma and COPD:
what are its features and how important is it? Thorax. 2009;64(8): 728–735.
5. Guerra S. Overlap of asthma and chronic obstructive pulmonary disease.
Curr Opin Pulm Med. 2005;11(1):7–13.
6. Kim DS, Kim YS, Jung KS, et al. Prevalence of chronic obstructive pulmonary disease in Korea: a population-based spirometry survey.
Am J Respir Crit Care Med. 2005;172(7):842–847.
7. Kim SY, Jung JY, Park MS, et al. Increased prevalence of self-reported asthma among Korean adults: an analysis of KNHANES I and IV data.
Lung. 2013;191(3):281–288.
8. Yoo KH, Kim YS, Sheen SS, et al. Prevalence of chronic obstruc-tive pulmonary disease in Korea: the fourth Korean National Health and Nutrition Examination Survey, 2008. Respirology. 2011;16(4): 659–665.
9. Freyer-Adam J, Gaertner B, Tobschall S, John U. Health risk factors and self-rated health among job-seekers. BMCPublic Health. 2011;11:659. 10. Executive Summary of The Third Report of The National Cholesterol
Education Program (NCEP) Expert Panel on Detection, Evaluation, and Treatment of High Blood Cholesterol in Adults (Adult Treatment Panel III). JAMA. 2001;285(19):2486–2497.
11. Pleasants RA, Ohar JA, Croft JB, et al. Chronic obstructive pulmonary disease and asthma-patient characteristics and health impairment.
COPD. Epub October 23, 2013.
12. Orie NG. The dutch hypothesis. Chest. 2000;117(5 Suppl 1):299S. 13. Postma DS, Boezen HM. Rationale for the Dutch hypothesis. Allergy
and airway hyperresponsiveness as genetic factors and their interaction with environment in the development of asthma and COPD. Chest. 2004;126(Suppl 2):96S–104S.
14. Silva GE, Sherrill DL, Guerra S, Barbee RA. Asthma as a risk factor for COPD in a longitudinal study. Chest. 2004;126(1):59–65. 15. Lee CH, Lee MC, Lin HH, et al. Pulmonary tuberculosis and delay
in anti-tuberculous treatment are important risk factors for chronic obstructive pulmonary disease. PLoS One. 2012;7(5):e37978. 16. Edmond K, Scott S, Korczak V, et al. Long term sequelae from
child-hood pneumonia; systematic review and meta-analysis. PLoS One. 2012;7(2):e31239.
17. Hooper R, Burney P, Vollmer WM, et al. Risk factors for COPD spiro-metrically defined from the lower limit of normal in the BOLD project.
Eur Respir J. 2012;39(6):1343–1353.
18. Lam KB, Jiang CQ, Jordan RE, et al. Prior TB, smoking, and airflow obstruction: a cross-sectional analysis of the Guangzhou Biobank Cohort Study. Chest. 2010;137(3):593–600.
19. Svanes C, Sunyer J, Plana E, et al. Early life origins of chronic obstruc-tive pulmonary disease. Thorax. 2010;65(1):14–20.
20. Zeki AA, Schivo M, Chan A, Albertson TE, Louie S. The asthma-COPD overlap syndrome: a common clinical problem in the elderly. J Allergy
(Cairo). 2011:861926.
21. Lindner K, Panaszek B, Machaj Z. [Asthma in the elderly]. Pol Arch
Med Wewn. 2007;117(8):350–354. Polish.
22. Marsh SE, Travers J, Weatherall M, et al. Proportional classifications of COPD phenotypes. Thorax. 2008;63(9):761–767.
23. Chalmers GW, MacLeod KJ, Thomson L, Little SA, McSharry C, Thomson NC. Smoking and airway inflammation in patients with mild asthma. Chest. 2001;120(6):1917–1922.
24. Nishimura K, Izumi T, Tsukino M, Oga T. Dyspnea is a better predic-tor of 5-year survival than airway obstruction in patients with COPD.
Chest. 2002;121(5):1434–1440.
25. Celli BR, Cote CG, Marin JM, et al. The body-mass index, airflow obstruction, dyspnea, and exercise capacity index in chronic obstructive pulmonary disease. N Engl J Med. 2004;350(10):1005–1012. 26. Lange P, Marott JL, Vestbo J, et al. Prediction of the clinical course
of chronic obstructive pulmonary disease, using the new GOLD clas-sification: a study of the general population. Am J Respir Crit Care
Med. 2012;186(10):975–981.
27. Kauppi P, Kupiainen H, Lindqvist A, et al. Overlap syndrome of asthma and COPD predicts low quality of life. J Asthma. 2011;48(3): 279–285.
28. Hesselink AE, van der Windt DA, Penninx BW, et al. What predicts change in pulmonary function and quality of life in asthma or COPD?
J Asthma. 2006;43(7):513–519.
29. Xuan W, Peat JK, Toelle BG, Marks GB, Berry G, Woolcock AJ. Lung function growth and its relation to airway hyperresponsiveness and recent wheeze. Results from a longitudinal population study. Am J
Respir Crit Care Med. 2000;161(6):1820–1824.
30. Arif AA, Delclos GL, Lee ES, Tortolero SR, Whitehead LW. Prevalence and risk factors of asthma and wheezing among US adults: an analysis of the NHANES III data. Eur Respir J. 2003;21(5):827–833. 31. Syk J, Alving K, Unden AL. Association between self-rated health and
International Journal of COPD
Publish your work in this journal
Submit your manuscript here: http://www.dovepress.com/international-journal-of-copd-journal
The International Journal of COPD is an international, peer-reviewed journal of therapeutics and pharmacology focusing on concise rapid reporting of clinical studies and reviews in COPD. Special focus is given to the pathophysiological processes underlying the disease, intervention programs, patient focused education, and self management protocols.
This journal is indexed on PubMed Central, MedLine and CAS. The manuscript management system is completely online and includes a very quick and fair peer-review system, which is all easy to use. Visit http://www.dovepress.com/testimonials.php to read real quotes from published authors.
Dove
press
Table S1 Comparison of characteristics between included and excluded subjects
Variables Included Excluded P-value N=9,104 N=9,302 Males 4,067 44.7% 3,857 41.5% ,0.0001 age, years 19–39 2,410 26.5% 3,845 41.3% ,0.0001 40–59 4,062 44.6% 2,603 28.0% $60 2,632 28.9% 2,854 30.7% BMI, kg/m2 Missing 0 0.0% 1,213 13.0% ,0.0001 ,8.5 202 2.2% 598 6.4% 18.5–25 5,518 60.6% 5,431 58.4% $25 3,384 37.2% 2,060 22.1%
education duration, years
Missing 0 0.0% 1,159 12.5% ,0.0001 #6 2,568 28.2% 2,466 26.5% 6–9 1,196 13.1% 730 7.8% 9–12 3,070 33.7% 2,844 30.6% .12 2,270 24.9% 2,103 22.6% socioeconomic status Missing 0 0.0% 546 5.9% ,0.0001 ,25th percentile 2,153 23.6% 2,337 25.1% 25–75th percentile 4,597 50.5% 4,295 46.2% .75th percentile 2,354 25.9% 2,124 22.8% smoking history Missing 0 0.0% 1,158 12.4% ,0.0001 never-smoker 5,327 58.5% 5,195 55.8% ex-smoker 1,696 18.6% 1,268 13.6% Current smoker 2,081 22.9% 1,681 18.1% self-rated health Missing 0 0.0% 1,152 12.4% ,0.0001 Better 6,957 76.4% 6,035 64.9% lower 2,147 23.6% 2,115 22.7%
Abbreviations: n, number of subjects; BMI, body mass index.