ABSTRACT
The purpose of the study is to evaluate the pollution level (gaseous and particle phase) in the public facil-ities for the PAHs, non-regulated materials, forecast the risk level by the health risk assessment (HRA) and propose the guideline level. PAH assessments through sampling of particulate matter of diameter ⁄
⁄2.5 μm (PM2.5). The user and worker exposure scenario for the PAHs consists of 24-hour exposure scenario (WIES) assuming the worst case and the normal exposure scenario (MIES) based on the sur-vey. This study investigated 20 PAH substances select-ed out of 32 substances known to be carcinogenic or potentially carcinogenic. The risk assessment applies major toxic equivalency factor (TEF) proposed from existing studies and estaimates individual Excess Cancer Risk (ECR). The study assesses the fine dusts (PM2.5) and the exposure levels of the gaseous and particle PAH materials for 6 spots in each 8 facility, e.g. underground subway stations, child-care facili-ties, elderly care facilifacili-ties, super market, indoor park-ing lot, terminal waitpark-ing room, internet café (PC-rooms), movie theater. For internet café (PC-rooms) in particular, that marks the highest PM2.5 concentra-tion and the average concentraconcentra-tion of 10 spots (2 spots for each cafe) is 73.3 μg/m3(range: 6.8-185.2 μg/m3). The high level of PM2.5seen in internet cafes was likely due to indoor smoking in most cases. For the gaseous PAHs, the detection frequency for 4-5 rings shows high and the elements with 6 rings shows low frequency. For the particle PAHs, the detection frequency for 2-3 rings shows low and the elements with 6 rings show high frequency. As a result, it is investigated that the most important PAHs are the naphthalene, acenaphthene and phenanthrene from the study of Kim et al. (2013) and this annual study. The health risk assessment demonstrates that each facility shows the level of 10-- 6-10-- 4. Considering
standards and local source of pollution levels, it is judged that the management standard of the benzo (a)pyrene, one of the PAHs, shall be managed with the range of 0.5-1.2 ng/m3. Smoking and ventilation were considered as the most important PAHs expo-sure associated with public facility PM2.5. This study only estimated for inhalation health risk of PAHs and focused on the associated cancer risk, while multiple measurements would be necessary for public health and policy.
Key words: Polycyclic aromatic hydrocarbons, Indoor, Public facilities, PM2.5, Health risk, Guideline
1. INTRODUCTION
The polycyclic aromatic hydrocarbons (PAHs) is the most representing hazardous material among the poly-cyclic organic matter (US EPA, 2007, 1993; NIEHS, 1998). The fine particles (PM2.5) account for 44-56% of the total suspended particles and more than 80% of the PAHs are highly related to the PM2.5(Ohura et al., 2004). PAHs in air are partitioned in a vapor and a particulate phase (Zhu et al., 2009). The materials are classified as the semi-volatile organic compounds and the incomplete combustion crystal of the organic mat-ter (Zhou and Zhao, 2012; Harrison and Smith, 1996).
Generally, it was reported that the sources of pollu-tion of the PAHs under the outdoor environment were vehicle combustion (Shah et al., 2005), civil and indus-trial coal combustion and petroleum asphalt (Zhu et al., 2012). Meanwhile, the information on the source of pollution for indoor air is insufficient and it is known that the indoor sources of the PAHs are smoking (Mitra and Ray, 1995) and heating. However, it is generally reported that the indoor PAH concentration with insuf-ficient information on the source of pollution is higher than the outdoor air with well-known source of pollu-doi: http://dx.doi.org/10.5572/ajae.2014.8.1.035
Indoor Exposure and Health Risk of Polycyclic Aromatic
Hydrocarbons (PAHs) via Public Facilities PM
2.5, Korea (II)
Ho-Hyun Kim, Geon-Woo Lee, Ji-Yeon Yang, Jun-Min Jeon1), Woo-Seok Lee2), Jung-Yun Lim2), Han-Seul Lee, Yoon-Kyung Gwak, Dong-Chun Shin3)and Young-Wook Lim*
The Institute for Environmental Research, Yonsei University College of Medicine, 250 Seongsan-no, Seoul 120-749, Korea
1)Department of Civil & Environmental Eng, Suncheon first College, Suncheon, Korea
2)Indoor Air and Noise Research Division, National Institute of Environmental Research (NIER), Korea
3)Department of Preventive Medicine, Yonsei University College of Medicine, 250 Seongsan-no, Seoul 120-749, Korea
tion (Zhang et al., 2009; Menichini et al., 2007; Li et al., 2005; Li and Ro, 2000).
A recent study indicated that PAHs in gas and parti-culate phase of indoor environments influenced by tobacco smoke, traffic and cooking at home (Wang et al., 2013; Lee et al., 2003). The relevant studies most-ly focused on the assessment of PAHs associated with particles (Slezakova et al., 2009a; Mannino and Ore-chio, 2008). There are some studies reporting the
details about the PM2.5concentrations in Guangzhou
12.8-371 μg/m3were higher than in Hongkong
11.1-31.4 μg/m3(Wang et al., 2013).
The benzo(a)pyrene (BaP), known as a representing hazardous material of the PAHs, is a carcinogenic in-dicator of the PAHs (EU, 2004), classified as a poten-tial carcinogen on the human body (IARC, 2010) and other PAHs include the possible human carcinogens (IARC, 1987, 2002). Recently, the WHO evaluates the benzo(a)pyrene, a representing carcinogen among the
PAHs, as 1/10,000 (1×10⁻⁴) of 1.2 ng/m3, 1/100,000
(1×10⁻⁵) of 0.1 ng/m3 and 1/1,000,000 (1×10⁻⁶) of 0.01 ng/m3. It is raised that the potential cancer potency of the dibenzo(a,l)pyrene or dibenzo(a)anthracene is much higher than the BaP (Okana-Mensah et al., 2005) and there are new attempts to evaluate the potential risks of the PAHs.
The US EPA (2002) variously proposes the estimates of human risks reflecting the compound features of the PAHs and there are two main methods. First, the surrogate approach method approaches based on the unknown PAHs compounds. Second, the relative pot-ency factor approach method is an approach to the components and estimates the initial carcinogenic level by adding degrees from each material from the PAHs compounds including the benzo(a)pyrene. The recent provisional guidance for assessing PHA risks of the EPA implements this approach, previously evaluated by Kim et al. (2013) and the study contains the result
as an annual study.
Therefore, the study compares and evaluates the in-door PAHs distribution (gas and particle) from repre-senting public under the regulation on the local public facilities and the purpose of the study is to propose the local PAHs standard level by performing the risk assessment on the exposure scenarios for the users and the workers in the public facilities.
2. EXPERIMENTS AND METHODS
2. 1 Select the Public Facilities forthe Survey
The study investigates fine dusts (PM2.5) and distri-bution features of gaseous and particle PAHs from 6 spots in each 8 facilities (underground subway stations, child-care facilities, elderly care facilities, super market, indoor parking lot, terminal waiting room, internet café, movie theater). The descriptions of public facilities are shown in Table 1. The site survey of the study covered a total of 32 facilities in 4-5 groups for 4 months from July to November, 2012. In addition, the outdoor air is measured from 18 places. The cities under the sur-vey include 3 large cities (Pusan, Incheon, Daegu) and 5 medium and small cities (Suncheon, Gwangyang, Yeosu, Jinju, Changwon).
2. 2 Sampling and Analysis
Indoor and outdoor sampling was performed in agree-ment with the usual recommended practices (US EPA, 1990). Sample were collected approximately in the centre of the public facilities, for collecting particulate phase simultaneously at a human breathing height (1.5-1.8 m), distant from corners and as fas as possible, from obstruction (Masih et al., 2010). The outdoor level samples were collected at 4-5 m above the road to protect samplers against vandalism (Menichini et
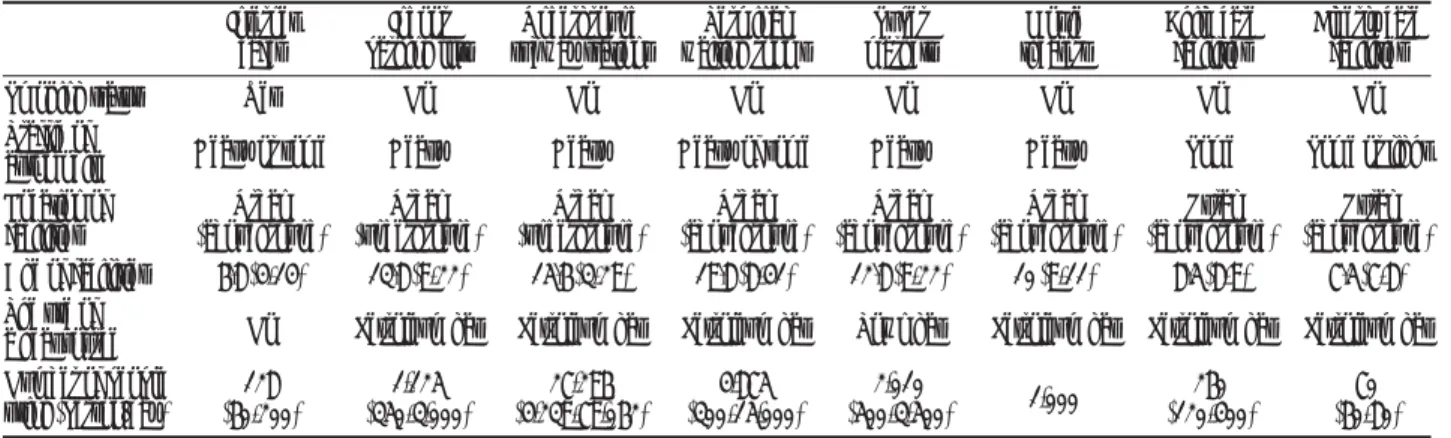
Table 1.General characteristics of study facilities.
Internet Indoor Underground Terminal Super Movie Child care Elderly care cafes parking lots subway stations waiting rooms markets theaters facilities facilities Smoking status Yes No No No No No No No Traffic of Heavy or some Heavy Heavy Heavy of some Heavy Heavy Some Some or light automobile
Location of Urban Urban Urban Urban Urban Urban Rural Rural facilities (aboveground) (underground) (underground) (aboveground) (aboveground) (aboveground) (aboveground) (aboveground) Age of facilities 6.8 (4-14) 13.8 (9-22) 15.6 (3-29) 19.8 (8-41) 12.8 (9-22) 10 (9-11) 8.5 (8-9) 7.5 (7-8) The use of
No Petroleum gas Petroleum gas Petroleum gas Town gas Petroleum gas Petroleum gas Petroleum gas a heat source
Number of people 128 1,125 27,296 4,875 2,010 1,000 260 70 using (person/day) (60-200) (350-3,000) (4,239-79,062) (300-15,000) (500-3,500) (120-400) (60-80)
al., 2007). 24-h samples were simultaneously collect-ed, respectively.
The method of sampling indoor and outdoor air, pre-treatment and analysis is based on the US EPA Com-pendium Method TO-13A (U.S. EPA, 1999) and the prior study (Kim et al., 2013; Wang et al., 2013) per-formed the PAHs evaluation through the sampling with
the diameter ⁄2.5 μm (PM2.5).
The preliminary study was performed to check the indoor PAH detection rate. The survey shows that the PAHs detection rate (higher than 80%) is proper within the flow range of 4-5 L/min and the sampling time is configured at least 24 hours to minimize the error in the weight concentration of the PM2.5considering the PAHs features in high loss rates during the pre-treat-ment process. In addition, the PAHs surveyed in the study are analyzed by the PAHs standard (Quebec Ministry of Env. PAHs 24 Mix) provided by AccuStan-dard (AccuStanAccuStan-dard Inc., U.S.A). The PAHs stanAccuStan-dard materials used in the preliminary survey uses the pro-duct of Supelco (EPA 610 mix, U.S.A).
The PM2.5and PAHs samples are taken by the Mini-vol portable sampler (PAS-201, Air Metrics, U.S.A) by connecting the PTFE filter (Teflon 47 mm, 1.0 μm, PALL Life sciences., U.S.A) and the PUF glass car-tridge (polyurethane foam installed) to the small-sized sampler for 24 hours with the amount of 5 L/min. The PTFE filter to take samples of the PM2.5and particle PAHs is used after depositing into the acetone : metha-nol (7 : 3, v/v) solution, cleaning with the microwave for 2 hours and drying with the high purity nitrogen (N2) to remove organic impurities before use. The pre-treated filter weighs after measuring the moisture for 24 hours in the desiccator to measure the mass concen-tration of the PM2.5. The filter is sealed into the petri dish (50Φ) made with the polystyrene for storage and carriage. The PTFE filter for sampling is stored in the thermo-hygrostat for 24 hours before and after the sampling, weighed by the analysis scale with more than 0.001 mg of sensitivity (AT261, Mettler toledo, Switzerland) for 3 times and the arithmetic average is taken. The weight is measured by the same method with the filter taken by the control filter before and after the sampling to minimize the error in the weight measurement due to temperature and humidity to cal-culate the weight concentration of the PM2.5 and the weight difference before and after the measurement is applied to each sampling filter. The absorbent to sam-ple the gaseous PAHs (polyurethane foam, PUF) is rinsed in the soxhlet extractor for 16 hours (6 cycles/ hour) with the order of methylene chloride-acetone, dried, wrapped in the aluminium foil and sealed in a glass jar before sampling. The PAHs analysis uses the Agilent GC/MS (HP-6890/HP-5973N) and applies
the analysis procedure for the EPA TO-13A Method and the local air pollution process test standard (ES 01552.1) as mentioned before. The GC column is the HP-5 with the dimensions of 30 m length, 0.32 mm external diameter and 0.25 μm internal diameter and the sample is analyzed by injecting 1-2 μL each.
2. 3 Assessment of PAHs
This study investigated 20 PAH substances selected out of 32 substances known to be carcinogenic or po-tentially carcinogenic by the International Agency for Research on Cancer (IARC) and the US EPA (Table 1). Table 1 shows the average RPFs based on tumor bio-assay data with their associated range and relative con-fidence ratings, and an overview of the tumor bioassay database for this compound. Risk assessments and potency assessments of various individual PAHs and complex mixtures of PAHs have been attempted. BaP is the only PAH for which a database is available, allowing a quantitative risk assessment.
2. 4 Quality Control
The study performs the degree management using PAHs standard, proxy standard and internal standard materials to raise the reliability for the analyzed mate-rials. The degree management performs the linearity and dwelling times reproduction assessment of the calibration curves, detection limit, recovery factor assessment of pre-treated samples, recovery factor assessment of pre-treatment devices using standard materials and blank test assessment. The linearity assessment of the calibration curve shows proper lin-earity with higher than 0.98 of the correlation efficient (R2) for most materials and the reproduction of the dwelling time (RSD %) is less than 0.1%. The repro-duction assessment of the instrument detection limit (IDL) shows that the reproduction based on the benzo (a)pyrene is proper with 2.06% of the RSD and the method detection limit (MDL) is 0.02 ng/μL based on the benzo(a)pyrene. In addition, the detection limit after conversion to the air concentration by applying the sampling flow (7,200 L) is 0.003 ng/m3 and the data below the figure are treated as N.D (Not Detected). The PAHs extraction recovery rate (%) is assessed by injecting 80-100 μL of the substitute standard (SS: 10 μg/mL) and 30-50 μL of the internal standard (IS: 10 μg/mL) to calibrate the losses during the pre-treat-ment process for the all samples (particles and gases). The study uses 5 SS (Naphthalene-d8, Acenaphthene-d10, Phenanthrene-Acenaphthene-d10, Chrysene-d12 and Perylene-d12) and 2 IS (Benzo(a)pyrene-D12, Pyrene-D10) materials to assess the recovery and the average recov-ery of the gaseous collection material (PUF) satisfy the recovery rate (60-120%) recommended by the US
EPA Method 8100 for 4 materials except the Acena-phthene-d10 including 65.4% for Naphthalene-d8, 127.2% for Acenaphthene-d10, 112.5% for Phenan-threne-d10, 78.1% for Chrysene-d12 and 60.7% for Perylene-d12.
In addition, the average recovery of the particle sam-pling media (filter) satisfies the recovery rates (60-120%) recommended by the US EPA Method 8100 for Naphthalene-d8 and Chrysene-d12 including 77.6% for Naphthalene-d8, 132.5% for Acenaphthene-d10, 127.6% for Phenanthrene-d10, 73.1% for Chrysene-d12 and 57.7% for Perylene-Chrysene-d12. The average recovery through the extraction and concentration without the filter or the PUF using the PAH standard material (24 mix, 10 μg/mL) to understand the PAHs extraction recovery (%) for the pre-treated equipment (soxhlet extractor) is 88.8%. The recoveries of each PAH from the PUF and filters ranged between 60.7% to 127.2% and 57.7% to 127.6% respectively and its relative standard deviation (RSD) ranged from 0% to 11.1%. 2. 5 Risk Assessment
The risk assessment in the study estimates the excess cancer risk (ECR) by applying various toxic equival-ency factor (TEF) like the prior study of Kim et al. (2013). Therefore, the study first performs the Surro-gate method of the PAHs, the assessment by applying the relative potency factors (RPF) method calculated by the concentration and the carcinogenic potency as
the benzo(a)pyrene indicator and second, the assess-ment by applying the EPA (1993) TEF for 7 of 24 car-cinogenic PAHs. Third, the Malcolm and Dobson (1994) method providing the TEF values for 24 types and last, the TEF values of the EPA (2010) are used to calculate the final PAHs risk degrees with 4 categories.
The study configures average users for each facility depending on the features of the public facilities, ages and gender features of the average users and determines the representing exposure factors (weight, breathing rate, dwelling time, visiting times, etc.) which form the WIES and the MIES. The survey covers the aver-age number of visitors, aver-ages, gender and dwelling time for the facilities. The number of subjects is 144 users (visitors) and workers and the exposure factors are finally figured based on the survey results. The body exposure may be calculated by considering the con-tamination concentration, inhalation rate, body weight, exposure frequency, exposure duration and lifetime. Here, the daily inhalation rate is applied by assuming the average exposure time and the exposure for 24 hours in the facilities based on the survey. The
inhala-tion rate is 13.3 m3/day, daily average inhalation rate
by referring to the recommended value of the US EPA. The body weight is 60 kg, average weight of Korean adults proposed by the Ministry of Health and Welfare, selected and applied as the representing value. The average life is 70 years, the life expectancy of Koreans surveyed by the National Statistics Office. The study
Table 2. Molecular weight and toxic equivalency factor about Compound of PAHs used in this study.
Compound Molecular weight TEF1a TEF2b TEF3c
(g mol-1) Naphthalene (Nap) 128 Acenaphthylene (AcPy) 152 0.001 Acenaphthene (AcP) 154 0.001 Flourene (Flu) 165 0.001 Phenanthrene (PA) 178 0.001 Anthracene (Ant) 178 0.01 Fluoranthene (FL) 202 0.001 0.08 Pyrene (Pyr) 202 0.001 Benzo(a)anthracene (BaA) 228 0.1 0.1 0.2 Chrysene (CHR) 228 0.001 0.01 0.1 Benzo(b)fluoranthene (BbF) 252 0.1 0.1 0.8 Benzo(j)fluoranthene (BjF) 0.1 0.3 Benzo(k)fluoranthene (BkF) 252 0.1 0.1 0.03 Benzo(e)pyrene (BeP) 252 0.01 Benzo(a)pyrene (BaP) 252 1 1 1 Indeno(1,2,3-c,d)pyrene (IND) 276 0.1 0.1 0.07 Dibenzo(a,h)anthrancene (DBA) 278 1 1 10 Benzo(g,h,i)perylene (BghiP) 276 0.01 0.009 Benzo(a,i)perylene (BaiP) 0.6 Benzo(a,l)perylene (BalP) 30
avalue adopted from US EPA (1993)
bvalue adopted from Malcom and Dobson (1994) cvalue adopted from US EPA (2010)
finds out the medical facilities for the senior people is the highest (24 hours/day), followed by Childcare facil-ities (9.0 hours/day), internet cafe (3.6 hours/day), movie theater (3.5 hours/day), super market (1.4 hours/ day), underground subway station and terminal wait-ing room (1.0 hour/day) and indoor parkwait-ing lot (0.5 hour/day). The medical facilities for the senior shows the highest visiting frequency (360 times/month), fol-lowed by daycare centers (252 times/month), under-ground subway station (125 times/month), Internet cafe (103 times/month), super market (29 times/month), indoor parking lot (27 times/month), movie theaters (18 times/month) and terminal waiting room (15 times/ month) (Table 3).
The study determines various toxic indicators of the PAHs carcinogens (carcinogenic potency, unit risk, exposure reference, POD) and applies safety coeffi-cients from collected toxic data to evaluate the non-carcinogenic PAHs and to calculate the RfC. The car-cinogenic potency evaluation or inhalation unit risk is calculated from the collected human carcinogenic data to evaluate the non-carcinogenic features of the PAHs.
As assessed by Kim et al. (2013), the study finally calculates the risk degree with (1) the method which expresses the relative cancer potency for individual PAH for the Benzo(a)pyrene (Yang et al., 2007) and (2) the method which applies the toxic equivalent quotient (TEQ) of the PAHs mixture using the TEFs of individual PAH (Chen and Liao, 2006).
3. RESULTS AND DISCUSSION
3. 1 PM2.5Concentration Distribution
The PM2.5concentrations measured from 32 facilities
in 8 groups show that the internet cafe marks the high-est value, followed by underground subway station, medical and child-care facilities, elderly care facilities, waiting room, indoor parking lot, super market and movie theater.
In particular, it is the internet café (PC-room) that
marks the highest PM2.5concentration and the average
concentration of 10 spots (2 spots for each cafe) is 73.3
μg/m3(range: 6.8-185.2 μg/m3) (p⁄0.01) (Table 4).
Castro et al. (2011) has investigated the indoor PM2.5
ranged, from 37 to 82 μg/m3(mean of 57.2 μg/m3) at
the home influenced by tobacco smoke. The
non-smok-ing home exhibited lower PM2.5 revels, 8.3 to 22.5
μg/m3(mean of 14.5 μg/m3). The prior study of Kim
et al. (2013) shows that the PM2.5concentration of the
internet cafe reaches 110.0 μg/m3 on average, much
higher than that of the study (range: 83.5-138.5 μg/m3).
Comparing such values to the PM2.5guideline of the
WHO (average 25 μg/m3 for 24 hours, 10 μg/m3 on
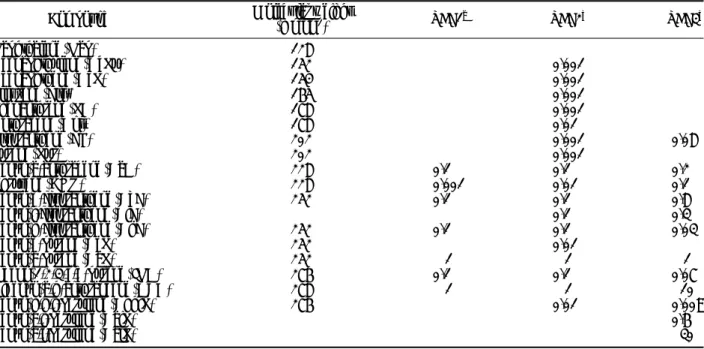
Table 3.
Relative human exposure variable in various public facilities.
Inhalation rate Exposure time Exposure frequency Exposure duration Body weight Average life (hr/day) b (day/yr) c (yr) d (m 3/day) a Mean ± S.D Min Max Mean ± S.D Min Max Mean ± S.D Min Max (kg) e span (yr) f Internet cafe (n ==26) 13.3 3.6 ± 1.3 1.5 6.0 103.0 ± 34.1 52.0 200.0 35.0 ± 7.0 20.0 45.0 60 70
Indoor parking lots
(n ==18) 13.3 1.0 ± 0.4 0.5 1.5 27.0 ± 30.0 6.0 118.0 50.0 ± 16.0 20.0 70.0 60 70
Underground subway stations
(n == 17) 13.3 1.0 ± 0.5 0.5 2.0 124.8 ± 45.1 46.0 185.0 50.0 ± 19.0 20.0 75.0 60 70
Terminal waiting rooms
(n == 23) 13.3 1.0 ± 0.4 0.5 1.5 15.0 ± 9.6 5.0 40.0 50.0 ± 13.7 20.0 70.0 60 70 Super markets (n == 12) 13.3 1.4 ± 0.6 0.5 2.0 29.0 ± 23.1 5.0 75.0 50.0 ± 13.7 30.0 70.0 60 70 Movie theaters (n == 24) 13.3 3.5 ± 1.0 1.5 5.0 18.0 ± 10.9 3.0 50.0 50.0 ± 8.2 30.0 60.0 60 70
Child care Facilities
(n == 13) 13.3 9.0 ± 1.9 6.0 12.0 252.0 ± 96.0 125.0 365.0 5.0 ± 0.6 4.0 6.0 60 70
Elderly care facilities
(n ==11) 13.3 24.0 ± 0.0 24.0 24.0 360.0 ± 11.8 325.0 365.0 10.0 ± 3.7 5.0 15.0 70 70
avalue adopted from US EPA
(1997)
b c d
value adopted from questionnaire Survey
evalue adopted from Korea Research Institute of Standards and Science
(2004)
the annual average), the Internet cafe and the under-ground subway station are far beyond the standards and the concentrations in the elderly care facilities, terminal waiting room and indoor parking lots are similar to the standard values.
The indoor/outdoor concentration ratio (I/O ratio) of
the PM2.5 for 8 facilities in the study shows that the
internet cafe is the highest (9.7), followed by the in-door parking lot (2.0), underground subway station (1.6), super market (1.5), child-care facilities (1,4), elderly care facilities (1.1), movie theater (1.0) and terminal waiting room (0.8), meaning that the indoor values are higher than those of the outdoor except the terminal waiting room. The internet cafe shows the
lowest outdoor concentration (7.5 μg/m3) but the
high-est indoor concentration of 73.3 μg/m3.
As surveyed by Kim et al. (2013), most internet cafes are placed underground and not equipped with indoor ventilation and the sampling process seems to be affect-ed by some smokers (Castro et al., 2011; Mitra and Ray, 1995). In addition, the indoor parking lot is a facility mostly with large malls and features insuffici-ent vinsuffici-entilation, as well as shows high concinsuffici-entration due to the emission by cars with frequently visit and scattering dusts on the floor. In contrast, the terminal
waiting room shows that the outdoor PM2.5is observed
higher than the indoor environment and it is because the outdoor air is highly polluted due to vehicles and other transportation, as well as the emitted gas due to idling in the terminal. It is judged that the cinema shows low concentration because it is located in a large-sized multiplex building with mechanical
ventila-tion compared to the internet cafe. The highest PM2.5
pollution was found at site internet cafes (PC-rooms) area which might be influenced by human activity, such as smoking and cooking. Dust particles could be resuspened via human activities, recontributing to the
indoor PM2.5(Wang et al., 2013). Exposure to PM
and associated PAHs are of particular concern for both children and adults (Ohura et al., 2005).
The PM2.5exposure is related to deteriorating lung
functions, increasing lung infection, respiratory tem symptoms, deteriorating the cardiovascular sys-tem and causing chronic obstructive pulmonary dis-eases. Even worse, it may be a cause of oxidation stress in the human DNA, the important phase of forming certain cancers (Novotna et al., 2007).
3. 2 Distribution of PAH Compounds in Gaseous and Particulate Phase
The materials with 2-4 rings show high detection frequency in the gaseous phase out of 24 PAHs from the facilities and 7 materials like naphthalene, acena-phthylene, fluorene, phenanthrene, anthracene, fluo-ranthene and pyrene show 100% detection rates and benzo(a)pyrene marks 68% detection rate. The study finds out that 13 of 24 materials show the detection rates higher than 80% and 5 materials are not detected, meaning that the materials with 5-6 rings show low detection rates. The PAHs are categorized into 3 groups including 2-3 rings, 4 rings and 5-6 rings (Schauer et al., 2003).
The acenaphthene shows the highest concentration
of 30.87 ng/m3, followed by the phenanthrene of 18.93
ng/m3, naphthalene of 19.08 ng/m3and these materials
show relatively high concentrations (Table 5). There-fore, it may be said that the PAHs with 2-3 rings show high concentrations as a whole.
The PAHs with 2-3 rings are detected in the gaseous phase much and known that they mark relatively high concentrations and their emission sources are placed indoor (Castro et al., 2011; Slezakova et al., 2010; Lizhong Zhu, 2009; Fanf et al., 2004). The study also shows that the acenaphthene, phenanthrene, naphtha-lene and fluorene, PAHs with 2-3 benzene rings, mark high concentrations. The prior study of Kim et al. (2013) indicates that the internet cafe and the under-ground subway station show the high concentrations and both facilities commonly show high
concentra-tions of the acenaphthene (38.37 and 28.17 ng/m3)
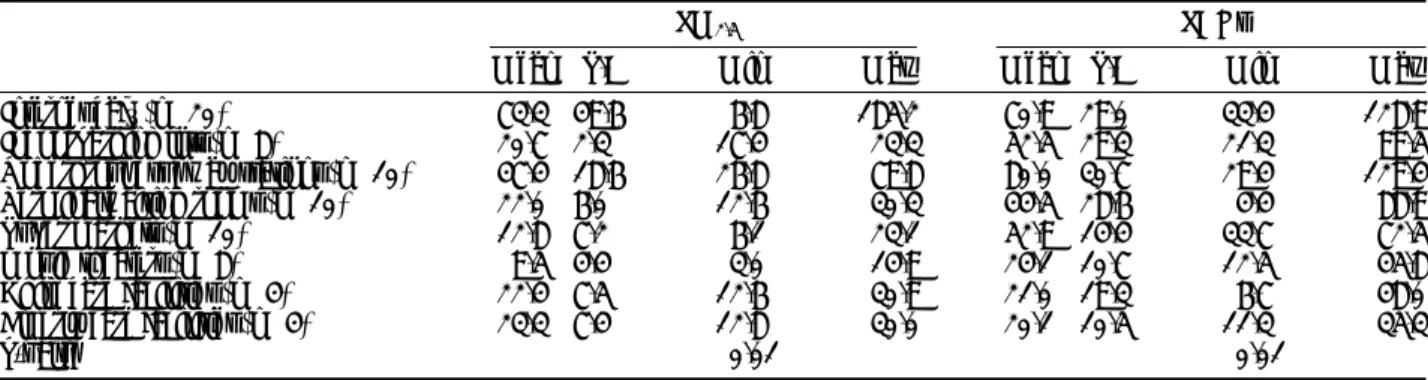
Table 4.Comparison of PM2.5and PAHs in various public facilities.
PM2.5 PAHs
Mean±S.D Min Max Mean±S.D Min Max
Internet café (n==20) 73.3±49.6 6.8 185.2 70.9±29.0 33.4 128.9 Indoorparking lots (n==8) 20.7±2.3 17.4 23.3 52.5±29.3 21.3 99.5 Undergroundsubway stations (n==10) 47.4±18.6 26.8 79.8 80.0±30.7 29.4 129.4 Terminalwaiting rooms (n==10) 22.0±6.0 12.6 30.3 44.5±28.6 4.4 88.9 Super markets (n==10) 12.8±7.2 6.1 23.1 52.9±14.4 33.7 72.5 Movie theaters (n==8) 9.5±4.4 3.0 14.9 24.1±10.7 12.5 45.8
Child care facilities (n==4) 22.4±7.5 12.6 30.9 21.0±19.3 6.7 48.0
Elderly care facilities (n==4) 23.3±7.4 12.8 30.0 20.1±10.5 11.3 35.3
Table 5.
Results of PAHs concentration measured in various public facilities.
PC rooms Indoor Underground Terminal Super markets Movie theaters Child care Elderly care PAHs parking lots subway stations waiting rooms facilities facilities Vapor Particle Vapor Particle Vapor Particle Vapor Particle Vapor Particle Vapor Particle Vapor Particle Vapor Particle (n=20) (n=20) (n=8) (n=8) (n=10) (n=10) (n=10) (n=10) (n=10) (n=10) (n=8) (n=8) (n=4) (n=4) (n=4) (n=4) Naphthalene 12.55 ± 10.69 0.44 ± 0.53 3.82 ± 2.01 0.38 ± 0.38 19.08 ± 10.59 0.97 ± 1.16 8.13 ± 5.13 0.49 ± 0.49 9.70 ± 5.19 0.93 ± 0.90 3.59 ± 2.57 0.11 ± 0.15 6.32 ± 9.20 0.07 ± 0.09 3.82 ± 3.80 0.54 ± 0.58 (96.6%) (3.4%) (91.0%) (9.0%) (95.2%) (4.8%) (94.3%) (5.7%) (91.3%) (8.7%) (97.0%) (3.0%) (98.9%) (1.1%) (87.6%) (12.4%) Acenaphthylene 4.74 ± 4.87 0.31 ± 0.52 0.80 ± 0.80 0.04 ± 0.02 1.32 ± 0.50 0.21 ± 0.13 1.32 ± 0.98 0.38 ± 0.46 0.53 ± 0.31 0.10 ± 0.12 0.46 ± 0.47 0.08 ± 0.09 1.30 ± 1.56 0.07 ± 0.07 1.42 ± 0.58 0.05 ± 0.05 (93.9%) (6.1%) (95.2%) (4.8%) (86.3%) (13.7%) (77.6%) (22.4%) (84.1%) (15.9%) (85.2%) (14.8%) (94.9%) (5.1%) (96.6%) (3.4%) Acenaphthene 0.36 ± 0.27 7.83 ± 18.96 30.87 ± 27.08 0.32 ± 0.51 25.31 ± 18.54 0.55 ± 0.76 16.29 ± 18.14 0.68 ± 1.33 16.76 ± 10.08 0.24 ± 0.50 0.01 ± 0.04 0.11 ± 0.21 0.05 ± 0.06 N.D 0.51 ± 0.37 0.13 ± 0.26 (4.4%) (95.6%) (99.0%) (1.0%) (97.9%) (2.1%) (96.0%) (4.0%) (98.6%) (1.4%) (8.3%) (91.7%) (100%) (79.7%) (20.3%) Fluorene 4.26 ± 1.33 0.24 ± 0.28 2.14 ± 0.70 0.03 ± 0.03 5.30 ± 3.39 0.33 ± 0.29 1.98 ± 1.51 0.27 ± 0.26 6.99 ± 4.09 0.13 ± 0.13 2.88 ± 1.71 0.09 ± 0.05 2.72 ± 2.61 0.07 ± 0.09 2.26 ± 2.03 0.59 ± 0.41 (94.7%) (5.3%) (98.6%) (1.4%) (94.1%) (5.9%) (88.0%) (12.0%) (98.2%) (1.8%) (97.0%) (3.0%) (97.5%) (2.5%) (79.3%) (20.7%) Phenanthrene 18.93 ± 7.42 0.74 ± 0.88 6.97 ± 3.17 0.27 ± 0.27 14.17 ± 7.29 1.89 ± 4.42 5.91 ± 3.18 0.52 ± 0.92 11.01 ± 7.09 0.10 ± 0.17 6.71 ± 5.99 0.07 ± 0.06 4.25 ± 4.54 0.18 ± 0.16 5.73 ± 4.50 0.79 ± 0.53 (96.2%) (3.8%) (96.3%) (3.7%) (88.2%) (11.8%) (91.9%) (8.1%) (99.1%) (0.9%) (99.0%) (1.0%) (95.9%) (4.1%) (87.9%) (12.1%) Anthracene 2.57 ± 1.41 0.20 ± 0.27 0.60 ± 0.34 0.03 ± 0.04 1.09 ± 0.59 0.34 ± 0.79 0.65 ± 0.36 0.14 ± 0.14 1.07 ± 0.71 0.12 ± 0.18 1.39 ± 1.41 0.05 ± 0.11 0.58 ± 0.57 0.10 ± 0.12 0.79 ± 0.43 0.11 ± 0.13 (92.8%) (7.2%) (95.2%) (4.8%) (76.2%) (23.8%) (82.3%) (17.7%) (89.9%) (10.1%) (96.5%) (3.5%) (85.3%) (14.7%) (87.8%) (12.2%) Fluoranthene 2.36 ± 0.87 0.54 ± 0.71 1.17 ± 0.65 0.54 ± 0.24 2.38 ± 1.05 0.88 ± 1.26 0.89 ± 0.43 0.56 ± 0.43 1.20 ± 0.67 0.30 ± 0.43 1.67 ± 1.62 0.18 ± 0.20 1.11 ± 1.03 0.08 ± 0.03 0.97 ± 0.38 0.10 ± 0.17 (81.4%) (18.6%) (68.4%) (31.6%) (73.0%) (27.0%) (61.4%) (38.6%) (80.0%) (20.0%) (90.3%) (9.7%) (93.3%) (6.7%) (90.7%) (9.3%) Pyrene 2.41 ± 1.18 0.77 ± 0.81 1.49 ± 0.93 0.54 ± 0.29 2.08 ± 0.69 0.91 ± 1.23 0.93 ± 0.45 0.47 ± 0.34 1.32 ± 0.78 0.30 ± 0.53 1.97 ± 1.46 0.19 ± 0.19 1.64 ± 1.75 0.07 ± 0.02 1.06 ± 0.40 0.08 ± 0.14 (75.8%) (24.2%) (73.4%) (26.6%) (69.6%) (30.4%) (66.4%) (33.6%) (81.5%) (18.5%) (91.2%) (8.8%) (95.9%) (4.1%) (93.0%) (7.0%) Benzo[c]phenanthrene 0.05 ± 0.08 0.20 ± 0.30 0.03 ± 0.04 0.03 ± 0.03 0.01 ± 0.03 0.02 ± 0.04 0.04 ± 0.05 0.05 ± 0.07 0.01 ± 0.03 0.03 ± 0.03 0.06 ± 0.09 0.05 ± 0.09 N.D 0.01 ± 0.02 N.D N.D (20.0%) (80.0%) (50.0%) (50.0%) (33.3%) (66.7%) (44.4%) (55.6%) (25.0%) (75.0%) (54.5%) (45.5%) (100%) Benz[a]anthracene 0.11 ± 0.18 0.66 ± 0.85 0.08 ± 0.12 0.07 ± 0.12 0.09 ± 0.06 0.10 ± 0.10 0.09 ± 0.07 0.14 ± 0.12 0.04 ± 0.04 0.05 ± 0.03 0.08 ± 0.14 0.21 ± 0.27 0.01 ± 0.01 0.12 ± 0.09 0.02 ± 0.02 0.06 ± 0.11 (14.3%) (85.7%) (53.3%) (46.7%) (47.4%) (52.6%) (39.1%) (60.9%) (44.4%) (55.6%) (27.6%) (72.4%) (7.7%) (92.3%) (25.0%) (75.0%) Chrysene 0.47 ± 0.62 1.11 ± 0.84 0.10 ± 0.10 0.35 ± 0.21 0.17 ± 0.09 0.40 ± 0.37 0.21 ± 0.28 0.50 ± 0.36 0.09 ± 0.17 0.10 ± 0.13 0.32 ± 0.46 0.44 ± 0.53 0.12 ± 0.19 0.13 ± 0.08 0.16 ± 0.21 0.14 ± 0.16 (29.7%) (70.3%) (22.2%) (77.8%) (29.8%) (70.2%) (29.6%) (70.4%) (47.4%) (52.6%) (42.1%) (57.9%) (48.0%) (52.0%) (53.3%) (46.7%) Benzo(b ++j)fluoranthene 0.17 ± 0.34 1.42 ± 0.81 0.07 ± 0.05 0.28 ± 0.16 0.21 ± 0.18 0.46 ± 0.47 0.24 ± 0.22 0.55 ± 0.36 0.10 ± 0.16 0.37 ± 0.22 0.09 ± 0.09 0.65 ± 0.68 0.22 ± 0.18 0.23 ± 0.25 0.04 ± 0.04 0.20 ± 0.25 (10.7%) (89.3%) (20.0%) (80.0%) (31.3%) (68.7%) (30.4%) (69.6%) (21.3%) (78.7%) (12.2%) (87.8%) (48.9%) (51.1%) (16.7%) (83.3%) Benzo(k)fluoranthene 0.07 ± 0.09 0.98 ± 0.79 0.05 ± 0.05 0.29 ± 0.21 0.15 ± 0.11 0.35 ± 0.31 0.18 ± 0.15 0.32 ± 0.25 0.05 ± 0.05 0.22 ± 0.12 0.08 ± 0.08 0.41 ± 0.30 0.17 ± 0.18 0.17 ± 0.13 0.07 ± 0.08 0.14 ± 0.21 (6.7%) (93.3%) (14.7%) (85.3%) (30.0%) (70.0%) (36.0%) (64.0%) (18.5%) (81.5%) (16.3%) (83.7%) (50.0%) (50.0%) (33.3%) (66.7%) DMBA N.D 0.29 ± 0.57 N.D N.D N.D N.D N.D N.D N.D N.D N.D 0.10 ± 0.30 N.D N.D N.D N.D (100%) (100%) Benzo(e)pyrene 0.16 ± 0.18 1.40 ± 1.48 0.08 ± 0.12 0.33 ± 0.45 0.17 ± 0.14 0.30 ± 0.25 0.24 ± 0.19 0.65 ± 0.56 0.15 ± 0.15 0.26 ± 0.26 0.15 ± 0.20 0.52 ± 0.69 0.08 ± 0.07 0.33 ± 0.31 0.15 ± 0.20 0.12 ± 0.17 (10.3%) (89.7%) (19.5%) (80.5%) (36.2%) (63.8%) (27.0%) (73.0%) (36.6%) (63.4%) (22.4%) (77.6%) (19.5%) (80.5%) (55.6%) (44.4%) Benzo(a)pyrene 0.25 ± 0.28 1.07 ± 0.92 0.07 ± 0.08 0.26 ± 0.39 0.15 ± 0.13 0.16 ± 0.23 0.13 ± 0.16 0.28 ± 0.31 0.17 ± 0.17 0.19 ± 0.19 0.05 ± 0.05 0.21 ± 0.29 0.17 ± 0.35 0.28 ± 0.55 N.D 0.01 ± 0.03 (18.9%) (81.1%) (21.2%) (78.8%) (48.4%) (51.6%) (31.7%) (68.3%) (47.2%) (52.8%) (19.2%) (80.8%) (37.8%) (62.2%) (100%) 3-Methylcholanthrene N.D N.D N.D N.D N.D N.D N.D 0.06 ± 0.13 N.D N.D N.D N.D N.D N.D N.D N.D (100%) I123P N.D 1.02 ± 0.84 N.D 0.10 ± 0.12 0.01 ± 0.04 0.23 ± 0.32 0.10 ± 0.14 0.21 ± 0.49 N.D 0.06 ± 0.11 N.D 0.37 ± 0.56 N.D 0.05 ± 0.04 N.D N.D (100%) (100%) (4.2%) (95.8%) (32.3%) (67.7%) (100%) (100%) (100%)
and naphthalene (15.72 and 5.17 ng/m3). The prior study of Wang (2013) shows that the PAHs with 2-4 rings (Phe¤Nap¤Flu and Pyr) show high concentra-tions and reports that it is mainly due to the coal and wood combustion. The research facilities covered by the study do not perform the direct coal and wood com-bustion and it is judged that the internal and external sources of pollution from gas utilities, cooking (frying and oil combustion), smoking and incense burning (Masih et al., 2010) jointly contribute to the pollution.
The survey result of the materials detected with the highest concentration from all the studied facilities based on the particle PAHs concentration shows that the acenaphthene marks the highest concentration of
7.83 ng/m3(Table 5). As the same with the study of
Kim et al. (2013), the study shows that the acenaph-thene marks the highest concentration among gaseous and particle PAHs. It is reported that the particle PAHs are detected from materials with 5-7 rings (Slezakova et al., 2010; Lizhong Zhu, 2009; Li et al., 2006) and the heavy-weight PAHs are mainly related to the parti-cle materials (Pan et al., 2012). The study shows that the concentration distribution of the particle materials with more than 5 rings increases compared to the gase-ous ones and the acenaphthene with 3 rings shows the highest concentration from all the facilities. The
acena-phthene shows the highest concentration of 7.83 ng/m3
in the internet cafe and other substances show the
con-centrations with less than 1 ng/m3.
In conclusion, the study of Kim et al. (2013) and the annual study show that the naphthalene, acenaph-thene and phenanthrene are the most crucial PAHs and in particular, Kim et al. (2013) shows that the acena-phthene records the high concentration among the par-ticle PAHs, meaning that the gaseous PAH concentra-tion distribuconcentra-tion ranges 34.5-55.9%, lower gaseous concentration distribution compared to the study. As shown in the previous study, the study demonstrates that the particle materials take higher proportion due to much affected by physical environment like the temperature and humidity (Lu et al., 2008; Tsapakis and Stephanou, 2005).
Kim et al. (2013) shows that remaining 7 facilities other than the underground subway station exceed the benzo(a)pyrene concentration recommended by the
WHO, 1.0 ng/m3but the study evaluates it as an
im-proved environment because the facility shows the level below the recommended value. It is expected to implement local situations and regulation on non-smoking movement in the indoor environment includ-ing the internet cafe or large restaurants. It is reported that the tobacco smoking is the most important source of pollution of the PAHs and recently shows that 549 individual PAHs are caused by the tobacco smoking
Dibenz(a,h)anthracene 0.03 ± 0.08 0.41 ± 0.28 N.D 0.02 ± 0.03 0.01 ± 0.02 0.04 ± 0.04 0.01 ± 0.02 0.14 ± 0.23 N.D 0.03 ± 0.02 N.D 0.12 ± 0.22 N.D N.D N.D N.D (6.8%) (93.2%) (100%) (20.0%) (80.0%) (6.7%) (93.3%) (100%) (100%) Benzo(g,h,i)perylene N.D 1.11 ± 0.62 N.D 0.14 ± 0.08 0.02 ± 0.06 0.12 ± 0.16 0.12 ± 0.24 0.18 ± 0.26 N.D 0.09 ± 0.10 0.05 ± 0.15 0.44 ± 0.60 N.D 0.07 ± 0.13 0.03 ± 0.07 N.D (100%) (100%) (14.3%) (85.7%) (40.0%) (60.0%) (100%) (10.2%) (89.8%) (100%) (100%) Dibenzo(a,h)pyrene N.D 0.50 ± 0.79 N.D 0.03 ± 0.03 N.D 0.01 ± 0.03 N.D 0.20 ± 0.25 N.D 0.05 ± 0.12 N.D 0.06 ± 0.10 N.D 0.07 ± 0.09 N.D N.D (100%) (100%) (100%) (100%) (100%) (100%) (100%) Dibenzo(a,i)pyrene N.D 0.13 ± 0.24 N.D 0.06 ± 0.11 N.D 0.03 ± 0.05 N.D 0.20 ± 0.24 N.D 0.08 ± 0.12 N.D 0.09 ± 0.20 N.D 0.14 ± 0.16 N.D N.D (100%) (100%) (100%) (100%) (100%) (100%) (100%) Dibenzo(a,l)pyrene N.D 0.09 ± 0.23 N.D 0.01 ± 0.02 N.D N.D N.D 0.08 ± 0.11 N.D 0.05 ± 0.14 N.D 0.03 ± 0.04 N.D N.D N.D N.D (100%) (100%) (100%) (100%) (100%) » PAHs 49.49 21.45 48.34 4.13 71.71 8.28 37.45 7.07 49.16 3.79 19.57 4.58 18.75 2.22 17.03 3.08
(ND: Not detected, less than 0.02
ng/m
3)
*DMBA: 7,12-Dimethylbenz(a)anthracene I123P: Indeno[1,2,3-cd]pyrene
Table 5. Continued. PC rooms Indoor Underground Terminal Super markets Movie theaters Child care Elderly care PAHs parking lots subway stations waiting rooms facilities facilities Vapor Particle Vapor Particle Vapor Particle Vapor Particle Vapor Particle Vapor Particle Vapor Particle Vapor Particle (n=20) (n=20) (n=8) (n=8) (n=10) (n=10) (n=10) (n=10) (n=10) (n=10) (n=8) (n=8) (n=4) (n=4) (n=4) (n=4)
(Thielen et al., 2008).
The comparison of the indoor and outdoor ratio (I/O ratio) of the average naphthalene for 7 facilities shows that the child-care facilities marks the highest level, followed by the underground subway station and the internet cafe and the phenanthrene shows high level in the cinema and the underground subway station (Fig. 1). The annual prior study of Kim et al. (2013) shows the tendency in exceeding 1 in the underground subway station, followed by the child-care facilities and the internet cafe, demonstrating the clear existence of the indoor source of pollution. As similar to the study, Kim et al. (2013) contains the measurement for once (24 hours) per facility not in winter, but from June to October and the result does not measure the outdoor air quality. Therefore, it is estimated that the indoor sources of pollution and indoor in the public facilities affect more than the seasonal effect (Zhang and Tao, 2008) (Menichini et al., 2007). The distribu-tion of PAHs between both phases predominantly de-pends on the physical characteristics of the compounds and physical conditions such as temperature and humi-dity (Lu et al., 2008). The seasonal variation of energy consumption in the residential sector that are mainly generated from combustion sources (Zhang and Tao, 2008).
The comparison of Kim et al. (2013) and the study on the distributions of gaseous and particles PAHs for the facilities shows that the gaseous PAHs accounts for 69.8% of the total PAHs concentration and the dis-tribution in other 5 facilities ranges from 84.1 to 92.8%. The reason why the gaseous concentration distribution in the internet cafe is low compared to other facility
groups is that the PM2.5concentration is high, as well
as the particle PAHs.
3. 3 Health Risk Assessment
The result of the risk assessment based on the expo-sure scenario in the public facilities due to the PAHs proposed by the 4 TEF-adjusted methods is in Table 6.
The risk estimate shows that the excessive
carcino-genic risk of the surrogate approach ranges 10-8-10-6
for each facility within the safe category and the
inter-net cafe shows higher than 10-6. Assuming the worst
exposure of 24 hours/lifetime estimates that the
surro-gate approach shows the range of 10-6-10-4for each
facility. The excessive carcinogenic risk of the 7
car-cinogens in the RPFs assessment ranges 10-8-10-6and
the internet cafe and the health and welfare centers
for the senior show higher than 10-6. Assuming the
exposure of 24 hours/lifetime estimates the range of
10-6-10-4for each facility.
The excessive carcinogenic risk of the Malcolm and Dobson (1994) RPFs assessment shows the range of
10-8-10-6for each facility and the internet cafe
(smok-ing/non-smoking) and elderly care facilities show
higher than 10-6. Assuming the exposure of 24 hours/
lifetime estimates the range of 10-5-10-4for each
faci-lity. The excessive carcinogenic risk of the EPA (2010)
RPFs assessment shows higher than 10-6for each
faci-lity except the terminal waiting room and the super market. Assuming the exposure of 24 hours/lifetime
estimates the level of 10-5-10-4for each facility. The
RPFs of 11 PAHs proposed by the US EPA (2010) shows 1 for the benzo(a)pyrene, 10 for the dibenzo(a,h) anthracene and 30 for the dibenzo(a,l)pyrene, meaning that the risk assessment is different depending on the concentration of each material. Kim et al. (2013) sub-stitutes the TEFs values of the US EPA and estimates 1.78E-04 assuming the exposure in the basic scenario and in the worst case scenario (24 hours), the internet 8 6 4 2 0 8 6 4 2 0 8 6 4 2 0 8 6 4 2 0 8 6 4 2 0 8 6 4 2 0 8 6 4 2 0 8 6 4 2 0 2-4 rings 5-6 rings PC rooms Super markets
Indoor parking lots
Movie theaters
Terminal waiting rooms
Elderly care facilities Underground subway stations
Child care facilities
4.24 6.82 2.26 2.26 3.80 1.58 5.50 7.21 23.51 7.30 3.03 2.10 2.47 2.42 2.00 0.75
cafe and the indoor parking lot show the risk level of
10-3and other facilities mark the level of 10-4.
The recent study of Castro et al. (2011) reports that the lifetime lung cancer risk exceeds the risk of 4.1×
10-3for a smoking family, 1.7×10⁻³for a
non-smok-ing family and 8.7×10⁻⁵(ng/m3)-1(Ohura et al., 2004),
the health-based guideline level and Wang et al. (2013)
states that the general household has the risk of 10-6
-10-5 due to the PAHs exposure of the PM
2.5.
There-fore, the risk level shows difference depending on the features in the studies including the characteristics of the source of pollution in the indoor environment, smoking and external air (Wang et al., 2013; Zhou and Zhao, 2012; Zhang et al., 2009; Menichini et al., 2007;
Ohura et al., 2004; Zhu et al., 2002). The limitation in the study is that the number of total samples is not enough and the risk assessment assumes the exposure for 24 hours in the facilities. The important uncertain-ties in our exposure scenario of potential exposures and health risks remain (Kim et al., 2012). In addition, we investigated 32 public facilities, the selected faci-lities and could not be to represent.
4. CONCLUSIONS
It is the internet cafe that marks the highest PM2.5
concentration and the average concentration of 10
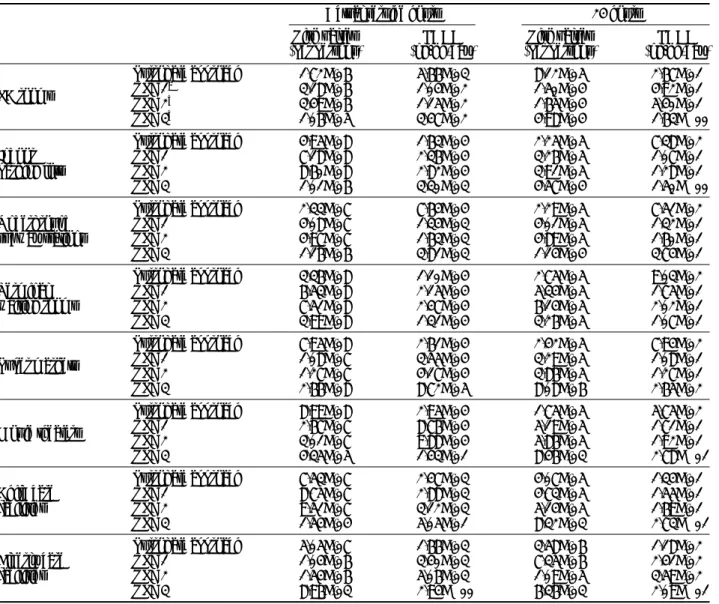
Table 6.Relative risk comparison in various public facilities by applying different relative potency factor (RPF).
Actual service hours 24 hours
Risk values LADD Risk values LADD
(per persons) (ng/kg-day) (per persons) (ng/kg-day)
Surrogate approach 1.72E-06 5.66E-03 8.12E-05 2.67E-01
PC rooms RPF 1a 3.18E-06 1.04E-02 1.50E-04 4.92E-01
RPF 2b 3.49E-06 1.15E-02 1.65E-04 5.40E-01
RPF 3c 1.06E-05 3.47E-02 4.98E-04 1.63E++00
Surrogate approach 4.95E-08 1.63E-04 2.25E-05 7.38E-02
Indoor RPF 1 7.18E-08 2.36E-04 3.26E-05 1.07E-01
parking lots RPF 2 8.60E-08 2.82E-04 3.91E-05 1.28E-01
RPF 3 1.01E-06 3.30E-03 4.57E-04 1.50E++00
Surrogate approach 2.33E-07 7.64E-04 2.29E-05 7.51E-02
Underground RPF 1 4.08E-07 1.34E-03 4.01E-05 1.32E-01
subway stations RPF 2 4.97E-07 1.63E-03 4.89E-05 1.60E-01
RPF 3 1.16E-06 3.81E-03 1.14E-04 3.74E-01
Surrogate approach 3.36E-08 1.10E-04 2.75E-05 9.03E-02
Terminal RPF 1 6.53E-08 2.15E-04 5.34E-05 1.75E-01
waiting rooms RPF 2 7.51E-08 2.47E-04 6.14E-05 2.02E-01
RPF 3 3.99E-08 1.31E-04 3.26E-05 1.07E-01
Surrogate approach 7.95E-08 2.61E-04 2.42E-05 7.94E-02
Super markets RPF 1 1.08E-07 3.55E-04 3.29E-05 1.08E-01
RPF 2 1.27E-07 4.17E-04 3.86E-05 1.27E-01
RPF 3 2.66E-08 8.72E-05 8.08E-06 2.65E-02
Surrogate approach 8.99E-08 2.95E-04 1.75E-05 5.75E-02
Movie theaters RPF 1RPF 2 2.67E-073.01E-07 8.76E-049.88E-04 5.19E-055.86E-05 1.71E-011.92E-01
RPF 3 4.35E-05 1.43E-01 8.46E-03 2.78E++01
Surrogate approach 7.53E-07 2.47E-03 4.07E-05 1.34E-01
Child care RPF 1 8.75E-07 2.88E-03 4.73E-05 1.55E-01
facilities RPF 2 9.51E-07 3.12E-03 5.14E-05 1.69E-01
RPF 3 1.54E-04 5.05E-01 8.32E-03 2.73E++01
Surrogate approach 5.05E-07 1.66E-03 3.58E-06 1.18E-02
Elderly care RPF 1 1.04E-06 3.40E-03 7.35E-06 2.41E-02
facilities RPF 2 1.54E-06 5.06E-03 1.09E-05 3.59E-02
RPF 3 8.96E-03 2.94E++00 6.36E-03 2.09E++01
avalue adopted from US EPA (1993)
bvalue adopted from Malcom and Dobson (1994) cvalue adopted from US EPA (2010)
spots (2 spots for each cafe) is 73.3 μg/m3(range:
6.8-185.2 μg/m3). Such level is lower than 100 μg/m3, the
PM10standard for indoor air in the sensitive facilities
defined in “The Act of Managing Indoor Air in the Public Facilities”, etc. However, the internet cafe and the underground subway station exceed the standard
levels compared to the PM2.5 guideline of the WHO
(25 μg/m3 average for 24 hours, 10 μg/m3 for annual
average) and the elderly care facilities, terminal wait-ing room and indoor parkwait-ing lots show similar levels. Kim et al. (2013) and the study show that the naphtha-lene, acenaphthene and phenanthrene are the most cru-cial PAHs and in particular, Kim et al. (2013) shows that the acenaphthene records the high concentration among the particle PAHs, meaning that the gaseous PAH concentration distribution ranges 34.5-55.9%, lower gaseous concentration distribution compared to the study. The result following the risk assessment method shows that the excessive carcinogenic risk by the RPF EPA (2010), excessive carcinogen benzo(a) pyrene indicator, 7 carcinogens and RPF (1994) mark
the level of 10-6-10-4 in the internet cafe (smoking/
non-smoking), indoor parking lot, underground subway station, terminal waiting room, super market, movie theater, child-care facilities and elderly care facilities. It is desirable to propose the risk level concentration
of 1×10⁻⁵when local standard is configured
consider-ing the possibility for observation based on the toxic level of the benzo(a)pyrene with PAHs guideline of the risk assessment by the WHO (2000). Therefore, considering foreign standards and local source of pol-lution levels, it is judged that the management standard of the benzo(a)pyrene shall be managed with the range
of 0.5-1.2 ng/m3.
ACKNOWLEDGEMENT
This study is a part of the results of and was funded by the “Establishment of Management for Non-regu-lated Indoor Pollutants (2012)” study from the National Institute of Environmental Research (Indoor Environ-ment Division). We would like to express our appre-ciation for their support.
REFERENCES
Castro, D., Slezakova, K., Delerue-Matos, C., da Concei-ção Alvim-Ferraz, M., Morais, S., do Carmo Pereia, M. (2011) Polycyclic aromatic hydrocarbons in gas and particulate phases of indoor environments influenced by tobacco smoke: Levels, phase distributions, and health risks. Atmospheric Environment 45, 1799-1808.
Chen, S.C., Liao, C.M. (2006) Health risk assessment on human exposed to environmental polycyclic aromatic hydrocarbons pollution sources. Science of the Total Environment 366(1), 112-123.
Eu (European Union) (2004) Directive 2004/107/EC of the European Parliament and the Council relating to arsenic, cadmium, mercury, nickel and polycyclic aro-matic hydrocarbons in ambient air. Official Journal of European Uion L23, 3-16.
Fang, G.C., Chang, K.F., Lu, C., Bai, H. (2004) Estimation of PAHs dry deposition and BaP toxic equivalency fac-tors (REFs) study at Urban, Industry Park and rural sam-pling sites in central Taiwan, Taichung. Chemosphere 55, 787-796.
Harrison, R.M., Smith, D.J.T. (1996) Source apportion-ment of atmospheric polycyclic aromatic. Environmen-tal Science & Technology 30, 825.
IARC Monograph of carcinogenic risk to humans, Supple-ment 7 (1987) Overall evaluation of carcinogenicity. An updating of IARC Monograph 142, 321-324. IARC Monographs on the Evaluation of Carcinogenic
Risks to Humans (2002) Some traditional herbal medi-cines, some mycotoxins, naphthalene and styrene. IARC Summary of Data Reported and Evaluation 82, 367. IARC Monographs on the Evaluation of Carcinogenic
Risks to Humans (2010) Some non-heterocyclic poly-cyclic aromatic hydrocarbons and some related expo-sures. IARC Monograph 92, 773.
Kim, H.H., Lim, Y.W., Jeon, J.M., Kim, T.H., Lee, G.W., Lee, W.S., Lim, J.Y., Shin, D.C., Yang, J.Y. (2013) Indoor Exposure and Health Risk of Polycyclic Aro-matic Hydrocarbons (PAHs) in Public Facilities, Korea. Asian Journal of Atmospheric Environment 7(2): 72-84.
Lee, P.K., Brook, J.R., Dabek-Zlotorzynska, E., Mabury, S. (2003) Identification of the major soirces contribut-ing to PM2.5observed in Toronto. Environmental
Sci-ence and Technology 37, 4831-4840.
Li, A., Schoonover, T.M., Zou, Q., Norlock, F., Conroy, L.M., Scheff, P.A., Wadden, R.A. (2005) Polycyclic aromatic hydrocarbons in residential air of ten Chicago area homes: concentrations and influencing factors. Atmospheric Environment 39, 3491-3501.
Li, C.S., Ro, Y.S. (2000) Indoor charcateristics of poly-cyclic aromatic hydrocarbons in the urban atmosphere of Taipei. Atmospheric Environment 34, 611-620. Li, J., Zhang, G., Li, X.D., Qi, S.H., Liu, G.Q., Peng, X.Z.
(2006) Source seasonality of polycyclic aromatic hy-dorcarbons (PAHs) in a subtropical city, Guangzhou, South China. Science of the Total Environment 355, 145-155.
Lu, H., Zhu, L., Chen, S. (2008) Pollution level, phase dis-tribution and health risk of polycyclic aromatic hydro-carbons in indoor air at public places of Hangzhou, China. Environmental Pollution 152, 569-575. Malcolm, H.M., Dobson, S. (1994) The calculation of an
environmental assessment level (EAL) for atmospheric PAHs using relative potencies. London, UK,
Depart-ment of the EnvironDepart-ment.
Mannino, M.R., Orechio, S. (2008) Polycyclic aromatic hydrocarbons (PAHs) in indoor dust matter of Palermo (Italy): Extraction, GC-MS analysis, distribution and sources. Atmospheric Environment 42, 1801-1817. Masih, J., Masih, A., Kulshrestha, A., Singhvi, R., Taneja,
A. (2010) Charcateristics of polycyclic aromatic hydro-carbons in indoor and outdoor atmosphere in the North central part of India. Journal of Hazardous Materials 177, 190-198.
Menichini, E., Iacovella, N., Monfredini, F., Turrio-Bal-dassarri, L. (2007) Relationships between indoor and outdoor air pollution by carcinogenic PAHs and PCBs. Atmospheric Environment 41, 9518-9529.
Mitra, S., Ray, B. (1995) Patterns and sources of polycyc-lic aromatic hydrocarbons and their derivatives in in-door air. Atmospheric Environment 29, 3345-3356. NIEHS (National Institute of Environmental Health
Sci-ences) (1998) 8th report on carcinogens 1998 summary. U.S. Department of Health and Human Services Public health Service.
Novotna, B., Topinka, J., Solansky, I., Chvatalova, I., Lnenickova, Z., Sram, R.J. (2007) Impact of air pollu-tion and genotype variability on DNA damage in Pra-gue policemen. Toxicology Letters 172, 37-47. Ohura, T., Amagai, T., Fusaya, M., Matsushita, H. (2004)
Polycyclic aromatic hydrocarbons in indoor and out-door environments and factors affecting their concen-trations. Environmental Science and Technology 38, 77-83.
Ohura, T., Noda, T., Amagai, T., Fusaya, M. (2005) Pre-diction of personal exposure to PM2.5and carcinogenic
polycyclic aromatic hydrocarbons by their concentra-tions in residential microenvironments. Environmental Science and Technology 39, 5592-5599.
Okona-Mensah, K.B., Battershill, J., Boobis, A., Fielder, R. (2005) An approach to in bestigating the importance of high potency polycyclic aromatic hydrocarbons(PAHs) in the induction of lung cancer by air pollution. Food and Chemical Toxicology 43, 1103-1116.
Pan, S.H., Li, J., Lin, T., Ahang, G., Li, X.D., Yin, H. (2012) Polycyclic aromatic hydrocarbons on indoor/ outdoor glass window surfaces in Guangzhou and Hong Kong, south China. Environmental Pollution 169, 190-195.
Schauer, C., Niessner, R., Poschl, U. (2003) Polycyclic aromatic hydrocarbons in urban air particulate matter: decadal and seasonal trends, chemical degradation, and sampling artifacts. Environmental Science and Technology 37, 2861-2868.
Shah, S.D., Ogunyoku, T.A., Miller, J.W., Cocker, D.R. (2005) On-road emission rates of PAH and n-alkane compounds from heavy-duty diesel vehicles. Environ-mental Science & Technology 39, 5276-5284.
Slezakova, K., Castro, D., Pereira, M.C., Morais, S., Del-erue-Matos, C., Alvim-Ferraz, M.C. (2009a) Influence of tobacco smoke on carcinogenic PAH composition in indoor PM10and PM2.5. Atmospheric Environment
43, 6376-6382.
Slezakova, K., Castro, D., Pereira, M.C., Morais, S., Del-erue-Matos, C., Alvim-Ferraz, M.C. (2010) Influence of traffic emissions on the carcinogenic polycyclic aro-matic hydrocarbons in outdoor breathable particles. Journal of the Air and Waste Management Association 60, 393-401.
Thielen, A., Klus, H., Müller, L. (2008) Tobacco smoke: unraveling a controversial subject. Experimental and Toxicologic Pathology 60, 141-156.
Tsapakis, M., Stephanou, E.G. (2005) Occurrence of gase-ous and particulate polycyclic aromatic hydrocarbons in the urban atmosphere: study of sources and ambient temperature effect on the gas/particle concentration and distribution. Environmental Pollution 133, 147-156. U.S. EPA (U.S. Environmental Protection Agency) (1993)
Provisional guidance for quantitative risk assessment of polycyclic aromatic hydrocarbons: EPA/600/R-93/089; Office of research and development, U.S. Environ-mental Protection Agency: Washington, DC.
U.S. EPA (U.S. Environmental Protection Agency) (1999) Determination of Polycyclic Aromatic Hydrocarbons (PAHs) in Ambient Air Using Gas Chromatography/ Mass Spectrometry (GC/MS): EPA/625/R-96/010b; U.S. Environmental Protection Agency: Cincinnati, OH 45268.
U.S. EPA (U.S. Environmental Protection Agency) (2002) Peer Consultation Workshop on Approaches to Poly-cyclic Aromatic Hydro carbon (PAH) Health Assess-ment EPA/635/R-02/005; National Center for Environ-mental Assessment Office of Research and Develop-ment U.S. EnvironDevelop-mental Protection Agency: Washing-ton, DC.
U.S. EPA (U.S. Environmental Protection Agency) (2007) Polycyclic organic matter (POM). Washington, DC. U.S. EPA (U.S. Environmental Protection Agency) (2010)
Development of a relative potency factor (RPF) approach for polycyclic aromatic hydrocarbon (PAH) mixtures: EPA/635/R-08/012A; U.S. Environmental Protection Agency: Washington, DC.
Wang, W., Huang, M.J., Chan, C.Y., Cheung, K.C. (2013) Risk assessment of non-dietary exposure to polycyclic aromatic hydrocarbons form human hair. Atmospheric Environment 73, 204-213.
WHO (World Health Organization) (1987) Polynuclear aromatic hydrocarbons (PAHs). In: Air quality guide-lines for Europe. World Health Organization Regional Office for Europe, Copenhagen, 105-117.
WHO (World Health Organization) (2000) Air Quality Guidelines, second ed. WHO Regional Publications, European Series 91, Copenhagen, 186-194.
WHO (World Health Organization). (2000) Guideline for Air Quality. WHO Geneva.
Yang, C.R., Lin, T.C., Chang, F.H. (2007) Particle size distribution and PAH concentrations of incense smoke in a combustion chamber. Environmental Pollution 145(2), 606-615.
(2009) Chemical and stable carbon isotopic characteri-zation for PAHs in aerosol emitted from two indoor sources. Chemosphere 75, 453-461.
Zhang, Y., Tao, S. (2008) Seasonal Variation of polycyclic aromatic hydrocarbons (PAHs) emissions in China. Environmental Pollution 156, 657-663.
Zhou, B., Zhao, B. (2012) Population inhalation exposure to polycyclic aromatic hydrocarbons and associated lung cancer risk in Beijing region: Contributions of in-door and outin-door sources and exposures. Atmospheric Environment 62, 472-480.
Zhu, L., Lu, H., Chen, S., Amagai, T. (2009) Pollution
level, phase distribution and source analysis of poly-cyclic aromatic hydrocarbons in residential air in Hang-zhou, China. Journal of Hazardous Materials 162, 1165-1170.
Zhu, X.L., Liu, W.L., Lu, Y.Y., Zhu, T. (2002) A compari-son of PAHs source profiles of domestic coal combus-tion, coke plant and petroleum asphalt industry. Acta Scientiae Circumstantiae (In Chinese) 22, 199-203.
(Received 23 October 2013, revised 5 March 2014, accepted 18 March 2014)