The Preparation of Non-aqueous Supercapacitors with Lithium Transition-Metal
Oxide/Activated Carbon Composite Positive Electrodes
Kyoungho Kim,* Min-Soo Kim,† and Taewhan Yeu‡
LG Innotek. 1271, Sa 1-dong, Sangrok-gu, Ansan-si, Gyeonggi-do 426-791, Korea. *E-mail: [email protected] †Department of Chemical and Biomolecular Engineering, Korea Advanced Institute of Science and Technology (KAIST),
335 Gwahangno (373-1 Guseong-dong), Yuseong-gu, Daejeon 305-701, Korea
‡School of Chemical Engineering and Materials Science, Chung-Ang University, Seoul 156-756, Korea Received May 14, 2010, Accepted September 6, 2010
In order to increase the specific capacitance and energy density of supercapacitors, non-aqueous supercapacitors were prepared using lithium transition-metal oxidesand activated carbons as active materials. The electrochemical properties were analyzed in terms of the content of lithium transition-metal oxides. The results of cyclic voltammetry and AC- impedance analyses showed that the pseudocapacitance may stem from the synergistic contributions of capacitive and faradic effects; the former is due to the electric double layer which is prepared in the interface of activated carbon and organic electrolyte, and the latter is due to the intercalation of lithium (Li+)ions. The specific capacitance and energy den-sity of a supercapacitor improved as the lithium transition-metal oxides content increased, showing 60% increase compared to those of supercapacitor using a pure activated carbon positive electrode.
Key Words: Lithium transition-metal oxide, Supercapacitor, Intercalation, Non-aqueous electrolyte, Energy
density
Introduction
Interest in supercapacitors as a main or a sub-power source for various applications requiring high power density such as
electric vehicles, UPS systems and windmills has increased.1-2
The use of supercapacitors in the applications described above is thus far insufficient because the energy density is only one tenth of that in a secondary battery.
Therefore, many researchers have investigated methods to improve the working voltage, specific capacitance, and energy density of supercapacitors. In an effort to improve the working voltage of supercapacitors, researchers have attempted to pre-vent or reduce electrochemical reactions between the electrodes and electrolyte interfaces; i.e., they have researched methods of removing functional groups of activated carbons.
A considerable amount of research has been devoted in this area to increasing the specific capacitance and energy density. Different studies have attempted to enlarge the effective surface area of activated carbon or have prepared composite electrodes
via an addition of transition metal oxides or conducting
poly-mers.2-4 Obtaining large surface areas through ordinary methods
increased the surface areas of micro-pores by only 20 Å or less. However, on such surfaces, it was difficult for the electrolyte to penetrate into the micro-pores. Thus, these micro-pores did not successfully improve the specific capacitance or energy density.5
Recently, to solve those problems, new approaches, collec-tively known as composite activation methods, have been at-tempted. These methods involve chemical activation and electrochemical activation. Chemical activation is carried out with potassium hydroxide or vapor in which electrochemically injected ions of a particular size are subsequently used to obtain
more meso-pores (20 ~ 500 Å) and fewer micro-pores.6
Another approach to increase the specific capacitance and energy density involves the use of the transition metal oxides
such as ruthenium oxide (RuO2), cobalt oxide (Co3O4), and
nickel oxide (NiO2), which are electrochemically prepared or
are created in a sol-gel process. These transition metal oxides are combined with activated carbons and are used as active materials. However, most of transition metal oxides are restrict-ed to aqueous electrolytes; as a result, their ratrestrict-ed voltage is only 1.2 V or less. Furthermore, these materials are expensive
and require highly complex manufacturing processes.7-9
Lithium transition-metal oxides, such as lithium cobalt oxide
(LiCoO2) and lithium manganese oxide (LiMn2O4), have a
high capacity in theory, and activated carbons have large surface areas. Hence, the purpose of the present paper is to examine the electrochemical properties of lithium transition-metal oxide/ac-tivated carbon composites as active electrodes. In addition, this paper aims to develop supercapacitors that use non-aqueous electrolyte to obtain a working voltage higher than 1.2 V. Lithi-um transition-metal oxide/activated carbon composites as positive electrodes were prepared with various ratios. Their phy-sical and electrical properties were analyzed using particle size analyzer (PSA), scanning electron microscope (SEM) and surface conductivity measurements.
Non-aqueous supercapacitors were made using activated
carbons as negative electrodes and (0.5 M LiBF4 + 0.5 M Et4
-NBF4/ACN) as a non-aqueous electrolyte. The effects of the
composition of a lithium transition-metal oxide/activated carbon composite on the electrochemical properties and the cycle properties of the supercapacitor were examined using AC- impedance, cyclic voltammetry and charge-discharge tests.
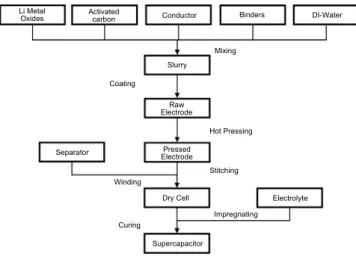
Li Metal
Oxides Activatedcarbon Conductor Binders DI-Water
Slurry Raw Electrode Pressed Electrode Dry Cell Supercapacitor Separator Electrolyte Mixing Coating Hot Pressing Stitching Impregnating Curing Winding
Figure 1. The preparation process of non-aqueous supercapacitors
with composite positive electrodes.
0.1 1 10 100 1000 Particle size (μM) Distribution (%) (a) 12 9 6 3 0 Conductors Activated Carbon LiMn2O4 LiCoO2 0.1 1 10 100 1000 Particle size (μM) Distribution (%) (b) 12 9 6 3 0
Figure 2. Particle size distribution of Lithium transition-metal oxide,
activated carbon and conductor (a) before and (b) after ball-milling.
terial. Styrenebutadiene rubber, polytetrafluoroethylene, car-boxymethylcellulose, and polyvinylpyrrolidone were used as water-soluble binding materials. The activated carbons were used as negative active materials. Lithium transition-metal
oxid-es (LiCoO2 and LiMn2O4) and the activated carbons were used
as composite positive active materials. Lithium transition-metal
oxide (LiCoO2 and LiMn2O4), was purchased from Aldrich.
The negative and positive active materials were mixed at various ratios using distilled water as a solvent in all cases. The slurries were prepared by agitating the mixtures using a ball-mill method at a speed of 200 rpm for 6 hours. The mixing was done at room temperature.
The well-mixed slurries were evenly coated on both sides of etched-aluminum foil of a thickness of 20 μM using a Dr Blade method. The supercapacitors were prepared as follows: The coated electrodes were cut to 2 × 5 cm in size and
com-pressed at a pressure of 0.7 ~ 0.8 ton/cm2 at 120 oC. The
cylind-er-shaped elements were prepared by stitching the terminals and winding them in the presence of separation films. The
manufactured cylinder-shaped elements were dried at 120 oC
for 48 hours under vacuum conditions of 30 mbar or less. They
were then sufficiently impregnated in the 0.5 M LiBF4 + 0.5 M
Et4NBF4/ACN composite electrolyte in a glove box filled with
nitrogen gas. Finally, the supercapacitors were sealed after ru-bber caps were inserted. Figure 1 shows the manufacturing pro-cesses of the supercapacitors.
The distribution of the particle sizes before and after the ball- milling process was determined using a PSA analysis. A SEM analysis, (500 in magnification), was conducted to observe the coating uniformity and measure the thickness of the coated active materials.
Surface conductivity measurements were carried out using four-probe method for the lithium transition-metal oxide/ac-tivated carbon composite positive electrode with and without
chemical impedance analyzer at a voltage of ±1 mV and a fre-quency range of 0.01 ~ 100,000 Hz.
To check reversibility of the supercapacitors, cyclic voltam-metry measurements were performed using a potentiostat/ galvanostat at a scan rate of 5 mV/s and an electric potential range of 1.0 ~ 2.3 V. The specific capacitance and energy density of the supercapacitors were also measured using a cycler after the supercapacitors were discharged at a constant current of 1.0 mA and the reliability of the supercapacitors was determined in a charge/discharge experiment with 1000 trials at a speed of 10 C.
Results and Discussion
Figure 2 shows the particle size distributions of the lithium
transition-metal oxides (LiCoO2 and LiMn2O4), activated
car-bon, the conductive materials and the mixtures prepared using the ball-mill method. The average particle sizes of lithium
Figure 3. Cross sectional SEM micrograph of composite positive electrodes and activated carbon negative electrodes (500 magnitude ratio).
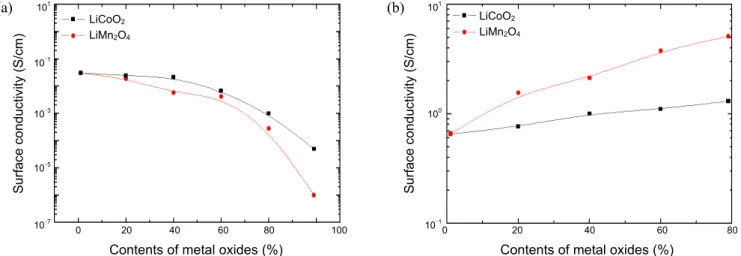
0 20 40 60 80 100 Contents of metal oxides (%)
Su rf ac e c on duc tiv ity ( S /c m ) (a) LiCoO2 LiMn2O4 101 10‒1 10‒3 10‒5 10‒7 0 20 40 60 80 Contents of metal oxides (%)
Su rf ac e c on duc tiv ity ( S /c m ) (b) 101 100 10‒1 LiCoO2 LiMn2O4
Figure 4. Surface conductivities of various composite positive electrodes (a) without and (b) with conductors
transition-metal oxide (LiCoO2 and LiMn2O4), activated
car-bons, and the conductive materials were 12, 30 and 5 μM, res-pectively. After prepared the particle size of lithium transition-
metal oxide by ball-mill method, LiCoO2 and LiMn2O4 had the
same particle size distribution. However, the average particle size of the mixture was approximately 10 μM after mixing the components using the ball-mill method.
Figure 3 shows SEM micrographs of the cross-sectional areas of lithium transition-metal oxide /activated carbon composite positive and activated carbon negative electrodes. As shown in the cross-sectional images, the active materials of the lithium transition-metal oxides/activated carbon composite positive and activated carbon negative electrodes were evenly coated at a thickness of 20 ± 2 μM and 50 ± 2 μM, respectively, on both sides of the 20 μM-etched aluminum foil.
Figure 4 shows the effect of the presence of conductive material on the surface conductivities of lithium transition-metal oxide/activated carbon composite positive electrodes measured using four-probe method. The surface conductivities of the electrodes, which were prepared using active materials and binding materials without conductive material, decreased as
the amount of lithium transition-metal oxidesincreased. In
contrast, the surface conductivities of the electrodes increased with an increase in the content of lithium transition-metal
oxideswhen a conductive material was added.
In principle, the surface conductivities decrease as the content of lithium transition-metal oxide in lithium transition-metal
oxide/activated carbon composite electrodes increases, as the
activated carbons have a surface conductivity of 100 ~ 10‒1
S/cm while the lithium transition-metal oxides have a surface
conductivity of 10‒4 ~ 10‒6 S/cm which is close to that of a non-
conducting substance.10-11 However, when a conductive
ma-terial is added to the lithium transition-metal oxide/activated carbon composite electrodes, the formation of a matrix structure between the particles of the conductive material and lithium
transition-metal oxideappears to be feasible given that the
par-ticle sizes of the conductive material and the lithium transition- metal oxide were much smaller than that of the activated carbon. Therefore, as the contents of lithium transition-metal oxide increase, the ratio of activated carbon decrease in the lithium transition-metal oxide/activated carbon composite electrodes and the conductive matrix will be denser. In other words, althou-gh the contents of non-conductive materials such as the lithium transition-metal oxides increase, the matrix may have a structure covering the lithium transition-metal oxides with the conductive materials.
As a result, electricity can pass through the matrix structure that formed within the electrodes. The formation of the matrix structure is likely responsible for the apparent increase in the surface conductivity as the content of lithium transition-metal oxide increases.
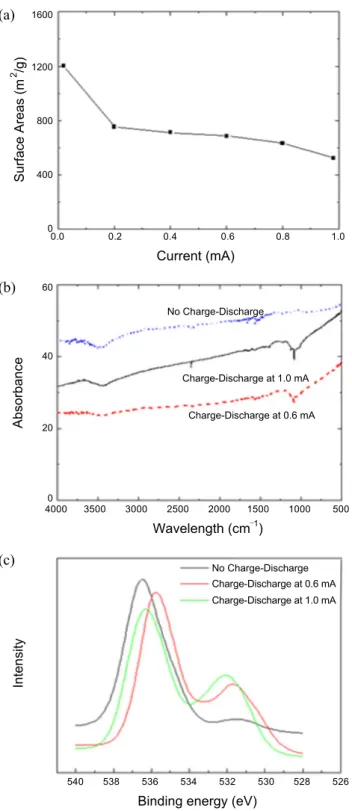
Figure 5 (a) shows the BET analysis results of the activated carbon negative electrodes, before and after the charge/dis-charge test. The activated carbon negative electrodes, before the
0.0 0.2 0.4 0.6 0.8 1.0 Current (mA) Surface Areas (m 800 400 0 4000 3500 3000 2500 2000 1500 1000 500 Wavelength (cm‒1) (b) 60 40 20 0 Absor bance No Charge-Discharge Charge-Discharge at 1.0 mA Charge-Discharge at 0.6 mA 540 538 536 534 532 530 528 526 Binding energy (eV)
(c)
Intensity
No Charge-Discharge Charge-Discharge at 0.6 mA Charge-Discharge at 1.0 mA
Figure 5. Analysis of activated carbon negative electrodes (a) BET,
(b) FT-IR and (c) XPS.
charge/discharge test, had large surface areas of approximately
1200 m2/g. However, after the charge/discharge test, the surface
areas of the negative electrodes decreased to a range of 600 ~ 800
m2/g. That results from the pores of the activated carbons that
were closed or destroyed and that was proposed to be a pos-sibility of SEI (Solid Electrolyte Interface) layer. When lithium ions, intercalated for initially charging lithium ion battery, are injected in graphite as negative electrode, they may be
combin-test. Before and after the charge/discharge test, the FT-IR peaks
were similar; both cases were in the 500 ~ 4000 cm‒1 wavelength
range. However, a different peak such as ROLi or ROCO2Li
appeared in 1100 ~ 1350 cm-1 wavelength range.18-19
Figure 5 (c) shows the XPS analysis results of the activated carbons negative electrodes before and after the charge/dis-charge test. Different peaks appeared in the 531 ~ 532 eV range before and after the charge/discharge test. In many articles, these
peaks are predicted by ROLi or ROCO2Li.12-14 They stem from
a reaction between functional groups (e.g. -COOH, -CO, -H, = O etc.) on the activated carbons and intercalated lithium ions
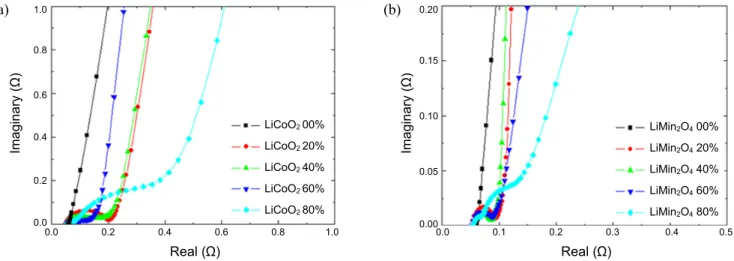
Figure 6 shows Nyquist plots of supercapacitors with various lithium transition-metal oxide/activated carbon composite posi-tive electrodes obtained from the analysis of the AC-impedance. For general electrochemical devices, in high frequency (1,000 ~ 100,000 Hz), a polarization effect is observed and semi-circles are shown by polarization. In low frequency (0.01 ~ 10 Hz), a mass transfer effect is observed and the lines, which are parallel to imaginary axis or lower than 90-degree angle to real axis in Nyquist plot, are shown by mass transfer. In middle frequency (10 ~ 1,000 Hz), polarization effect or mass transfer effect or superposition effect by both them are observed. In the case of the superposition, the behavior of Warburg impedance or in-complete semicircle is revealed.
The supercapacitor using 0 wt % lithium transition-metal oxide/C composite electrode did not show any semicircles by the polarization in high frequency but only the vertical lines by mass transfer in low frequency, which is typical for con-ventional capacitor. It is considered that because of the forma-tion of electrical double layer by non-faradic reacforma-tion, any pola-rization is not occurred. The supercapacitor using 20, 40, 60 and 80 wt % lithium transition-metal oxide/C composite electrode showed semicircles by polarization in high frequency and vertical lines by mass transfer in low frequency respectively.
However, in middle frequency (10 ~ 1,000 Hz), the behaviors of the supercapacitor were unlike the supercapacitor using 0 wt % lithium transition-metal oxide/C composite electrode as shown Figure 6. The supercapacitor using 20 wt % lithium transition-metal oxide/C composite electrode showed stronger behavior by polarization effect than that by mss transfer effect without any special behavior. The supercapacitor using 40 and 60 wt % lithium transition-metal oxide/C composite electrode showed smaller semicircles than that of the supercapacitor using 20 wt % lithium transition-metal oxide/C composite elec-trode and vertical lines which are more parallel to imaginary axis. It is considered that the behaviors result from superposition effect by both polarization and mass transfer. The supercapacitor using 80 wt % lithium transition-metal oxide/C composite elec-trodes showed the semicircles depressed to real-axis and it is considered that the behaviors result from the superposition as mentioned above. Especially, the behaviors are known due to
the intercalation of Li+ ion.
0.0 0.2 0.4 0.6 0.8 1.0 Real (Ω) Imaginary ( Ω ) (a) 1.0 0.8 0.6 0.4 0.2 0.0 LiCoO2 00% LiCoO2 20% LiCoO2 40% LiCoO2 60% LiCoO2 80% 0.0 0.1 0.2 0.3 0.4 0.5 Real (Ω) Imaginary ( Ω ) (b) 0.20 0.15 0.10 0.05 0.00 LiMin2O400% LiMin2O4 20% LiMin2O4 40% LiMin2O4 60% LiMin2O4 80%
Figure 6. Nyquist plots of supercapacitors with various composite positive electrodes (a) LiCoO2 and (b) LiMn2O4.
0 20 40 60 80 100 Contents of Lithium metal oxide (%)
Specfic Capacitance (F/cc) (a) 25 20 15 10 5 0 LiCoO2 LiMn2O4 0 20 40 60 80 100 Contents of Lithium metal oxide (%)
Energy Density (Wh/L) (a) 20 15 10 5 0 LiCoO2 LiMn2O4
Figure 7. Specific capacitances (a) and energy densities (b) of supercapacitor with various composite positive electrodes.
specific reactions have occurred between the electrode interface of the supercapacitor. The ohmic resistance values of the super-capacitors were approximately 50 mΩ, and the value decreased slightly as the lithium transition-metal oxide content increased. These results are consistent with those obtained from the sur-face conductivity measurements, as shown in Figure 4. The Nyquist plot for the pure activated carbon positive electrodes revealed a vertical curve, which is typical for conventional capa-citor. The polarization resistance increased as the content of the lithium transition-metal oxide increased; these results stemmed
from the intercalation and diffusion of Li+ ions. In particular,
the reactions of the negative and composite positive electrodes were delineated into two clear semicircles as the content of the
lithium transition-metal oxidesexceed 80%.
Figure 7 shows the specific capacitances and energy density values of supercapacitors with various lithium transition-metal
oxide/activated carbon composite positive electrodes as
mea-sured by a cycler. The resulting ratios of the increase in the specific capacitance and energy density appear to be due to the manifestation of pseudocapacitance as the content of the
lithium transition-metal oxideincreases. The highest values,
i.e., a specific capacitance of 23.83 F/cc and an energy density
of 17.51 Wh/L, were obtained when the ratio of LiMn2O4/C
was 0.86/0.14.
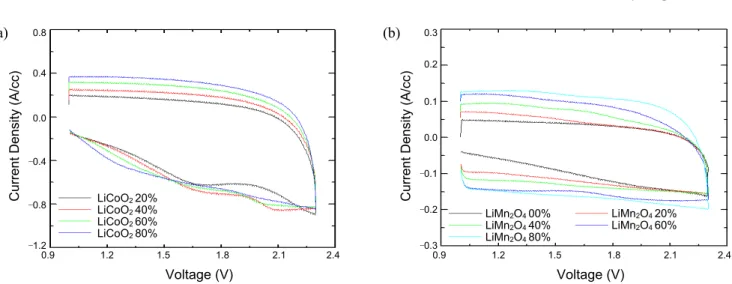
The effect of the content of lithium transition-metal oxides in lithium transition-metal oxide/activated carbon composite positive electrodes on the cyclic voltammetry of the superca-pacitors is shown in Figure 8. For all compositions of composite positives, the supercapacitors showed excellent reversibility and typical capacitor operations. The charge/discharge current densities of the supercapacitors increased as the lithium
transi-tion-metal oxideconcentration increased; these results most
likely stemmed from the occurrence of pseudocapacitance which resulted from the synergistic contributions of capacitive and faradic effects; the former effect was due to the electric double layer which was increasingly generated at the interface of the positives and electrolyte with the increasing lithium
transition-metal oxidecontent, and the latter effect stemmed
from the intercalation of Li+ ions. These results are in good
agreement with those of AC-impedance analysis shown in Figure 6.
0.9 1.2 1.5 1.8 2.1 2.4 Voltage (V)
Current Density (A/cc)
0.0 ‒0.4 ‒0.8 ‒1.2 LiCoO2 20% LiCoO2 40% LiCoO2 60% LiCoO2 80% 0.9 1.2 1.5 1.8 2.1 2.4 Voltage (V)
Current Density (A/cc)
0.0 ‒0.1 ‒0.2 ‒0.3 LiMn2O4 00% LiMn2O4 40% LiMn2O4 80% LiMn2O4 20% LiMn2O4 60%
Figure 8. Cyclic voltammograms of supercapacitors with various composite positive electrodes at 5 mV/sec (a) LiCoO2 and (b) LiMn2O4.
0 200 400 600 800 1000 Number of cycle (th) Specific Capacitance (F /cc) 25 20 15 10 5 0
LiMn2O4/C (0.86:0.14) Composite Electrode
Activated Carbon Electrode LiCoO2/C (0.84:0.16)
Composite Electrode
Figure 9. Specific capacitances of supercapacitors at 10 C rates charge/
discharge.
transition-metal oxide/activated carbon composite positive
electrodes, whose ratios were 0.86/0.14 (LiMn2O4/C) and
0.84/0.16 (LiCoO2/C), was determined by charging/discharging
measurements using cycler at a speed of 10 C. These results are shown in Figure 9. The greatest reduction in specific capacitance and in the energy density of the supercapacitors occurred at the initial stage of the charge-discharge test, and the use of the
LiMn2O4/C composite positive electrodes induced a somewhat
higher reduction of the specific capacitance and energy density compared to an electrode consisting of pure activated carbon;
however, the supercapacitor with the LiMn2O4/C composite
positive electrode showed a significant improvement, i.e., greater than 60%, in terms of its specific capacitance and energy density compared with the supercapacitor of pure activated carbon elec-trode even after 1000 charge-discharge tests. However,
super-capacitors with the LiCoO2/C composite positive electrode
showed a significant decrease, i.e. in excess of 90%, in terms of the specific capacitance and energy density compared to those created with a pure activated carbon electrode, even after 500 charge-discharge tests.
The difference of the specific capacitance for the cycle tests
with lithium transition-metal oxides results from the structural
difference of the lithium transition-metal oxide. LiCoO2 have
a layered structure but the layered structure is spoiled by
re-petition of intercalation and deintercalation, whereas LiMn2O4
have a spinal structure and the structure is scarcely damaged
for the cycle tests. Therefore the supercapacitor using LiMn2O4
can maintain the higher specific capacitance than that of LiCoO2
because of the structural stability.
Conclusions
The electrochemical properties of supercapacitors using a
lithium transition-metal oxide/activated carbon composite as
a positive electrode were investigated. Detailed AC impedance and cyclic voltammetry investigations revealed that the mani-festation of pseudocapacitance may stem from the intercalation
of Li+ ions. The optimum values of the specific capacitance and
energy density, which are 23.8 F/cc and 17.5 Wh/L,
respective-ly, were obtained when a LiMn2O4/C composite with a ratio of
0.86/0.14 was used as a positive electrode; these values are the initial values and are two times higher than those obtained from supercapacitors with a pure activated carbon electrode. In addition, even after 1000 trials of a charge-discharge test, the values of the specific capacitance and energy density of the supercapacitor with the composite electrode were 60% higher than those of the supercapacitor with the pure carbon electrode.
References
1. Conway, B. E. Electrochemical Supercapacitors, Scientific
Funda-mentals and Technological Application; Kluwer
Academic/Plen-um Publishers: New York, 1999.
2. Miller, J. M.; Dunn, B.; Tran, T. D.; Pekala, R. W. J. Electrochem.
Soc. 1997, 144, L309.
3. Sato, Y.; Yomogida, K.; Nanaumi, T.; Kobayakawa, K.; Ohsawa, Y.; Kawai, M. Electrochem. Solid State Lett. 2000, 3, 113. 4. Kim, K. M.; Hur, J. W.; Jung, S. I.; Kang, A. S. Electrochim. Acta
2004, 50, 863.
5. Michael, M. S.; Parbaharn, S. R. S. J. Power Sources 2004, 136, 250.
6. Amatucci, G. G.; Badway, F.; Pasquier, A. D.; Zheng, T. J.
7. Frackowiak, E.; Beguin, F. Carbon 2001, 39, 937. 8. Okamura, M.; Takeuchi, M. US20020012223 2002.
9. Ramani, M.; Haran, B. S.; White, R. E.; Popov, B. N. J.
Electro-chem. Soc. 2001, 148, A374.
10. Srinivasan, V.; Weidner, J. W. J. Electrochem. Soc. 1997, 144, L210.
11. Liu, K.; Anderson, M. A. J. Electrochem. Soc. 1996, 143, 124. 12. Du Pasquier, A.; Plitz, I.; Gural, J.; Badway, F.; Amatucci, G. G.
J. Power Sources 2004, 136, 160.
13. Tukamoto, H.; West, A. R. J. Electrochem. Soc. 1997, 144, 3164.
14. Holbery, J. D.; Seddon, K. R. Clean Products and Processes 1999,
1, 223.
15. Aurbach, D.; Markovsky, B.; Weissman, I.; Levi, E.; Ein-Eli, Y.
Electrochim. Acta 1999, 45, 67.
16. Araki, K.; Sato, N. J. Power Sources 2003, 124, 124.
17. Bar-Tow, D.; Peled, E.; Burstein, L. J. Electrochem. Soc. 1999,
146(3), 824.
18. Fischer, T.; Sethi, A.; Welton T.; Woolf, J. Tetrahedron Lett. 1999,
40, 793.