cambridge.org/eps
Original Article
*These two authors equally contributed to the study.
Cite this article:Yu J et al (2020). Seasonality of suicide: a multi-country multi-community observational study. Epidemiology and Psychiatric Sciences 29, e163, 1–10. https:// doi.org/10.1017/S2045796020000748
Received: 24 March 2020 Revised: 15 July 2020 Accepted: 21 July 2020
Key words:
Climate; heterogeneity; seasonality; socioeconomic; suicide
Author for correspondence:
Yeonseung Chung, E-mail:dolyura@kaist.edu
© The Author(s), 2020. Published by Cambridge University Press. This is an Open Access article, distributed under the terms of the Creative Commons Attribution licence (http://creativecommons.org/licenses/by/4.0/), which permits unrestricted re-use,
distribution, and reproduction in any medium, provided the original work is properly cited.
multi-community observational study
J. Yu1,*, D. Yang1,*, Y. Kim2, M. Hashizume3, A. Gasparrini4,5,6, B. Armstrong4,
Y. Honda7, A. Tobias8, F. Sera4, A. M. Vicedo-Cabrera9,10, H. Kim11, C. Íñiguez12,13,
E. Lavigne14,15, M. S. Ragettli16,17, N. Scovronick18, F. Acquaotta19, B. Chen20,
Y. L. Guo20,21, M. de Sousa Zanotti Stagliori Coelho22, P. Saldiva22, A. Zanobetti23,
J. Schwartz23, M. L. Bell24, M. Diaz25, C. De la Cruz Valencia25, I. Holobâcă26,
S. Fratianni19and Y. Chung1 1
Department of Mathematical Sciences, Korea Advanced Institute of Science and Technology, Daejeon, South Korea;2Department of Global Environmental Health, Graduate School of Medicine, University of Tokyo, Tokyo, Japan;3Department of Global Health Policy, Graduate School of Medicine, University of Tokyo, Tokyo, Japan; 4
Department of Public Health, Environments and Society, London School of Hygiene & Tropical Medicine, London, UK;5Centre for Statistical Methodology, London School of Hygiene & Tropical Medicine, London, UK;6Centre on Climate Change and Planetary Health, London School of Hygiene & Tropical Medicine, London, UK;7Faculty of Health and Sport Sciences, University of Tsukuba, Tsukuba, Japan;8Institute of Environmental Assessment and Water Research, Spanish Council for Scientific Research, Barcelona, Spain;9Institute of Social and Preventive Medicine, University of Bern, Bern, Switzerland;10Oeschger Center for Climate Change Research, University of Bern, Bern, Switzerland;11Graduate School of Public Health, Seoul National University, Seoul, Republic of Korea; 12
Department of Statistics and Computational Research, Universitat de València, València, Spain;13CIBER Epidemiolgia y Salud Publica (CIBERESP), Madrid, Spain;14School of Epidemiology & Public Health, University of Ottawa, Ottawa, Canada;15Air Health Science Division, Health Canada, Ottawa, Canada;16Department of Epidemiology and Public Health, Environmental Exposures and Health Unit, Swiss Tropical and Public Health Institute, Basel, Switzerland;17University of Basel, Basel, Switzerland;18Gangarosa Department of Environmental Health, Rollins School of Public Health, Emory University, Atlanta, USA;19Department of Earth Sciences, University of Torino, Turin, Italy;20National Institute of Environmental Health Sciences, National Health Research Institutes, Zhunan, Taiwan;21Department of Environmental and Occupational Medicine, National Taiwan University College of Medicine and National Taiwan University Hospital, Taipei, Taiwan;22Institute of Advanced Studies, University of São Paulo, São Paulo, Brazil;23Department of Environmental Health, Harvard T.H. Chan School of Public Health, Boston, Massachusetts, USA;24School of Forestry and Environmental Studies, Yale University, New Haven, Connecticut, USA;25Department of Environmental Health, National Institute of Public Health, Cuernavaca, Morelos, Mexico and26Faculty of Geography, Babes-Bolay University, Cluj-Napoca, Romania
Abstract
Aims.We aimed to investigate the heterogeneity of seasonal suicide patterns among multiple geographically, demographically and socioeconomically diverse populations.
Methods.Weekly time-series data of suicide counts for 354 communities in 12 countries dur-ing 1986–2016 were analysed. Two-stage analysis was performed. In the first stage, a general-ised linear model, including cyclic splines, was used to estimate seasonal patterns of suicide for each community. In the second stage, the community-specific seasonal patterns were com-bined for each country using meta-regression. In addition, the community-specific seasonal patterns were regressed onto community-level socioeconomic, demographic and environmen-tal indicators using meta-regression.
Results.We observed seasonal patterns in suicide, with the counts peaking in spring and declining to a trough in winter in most of the countries. However, the shape of seasonal pat-terns varied among countries from bimodal to unimodal seasonality. The amplitude of sea-sonal patterns (i.e. the peak/trough relative risk) also varied from 1.47 (95% confidence interval [CI]: 1.33–1.62) to 1.05 (95% CI: 1.01–1.1) among 12 countries. The subgroup differ-ence in the seasonal pattern also varied over countries. In some countries, larger amplitude was shown for females and for the elderly population (≥65 years of age) than for males and for younger people, respectively. The subperiod difference also varied; some countries showed increasing seasonality while others showed a decrease or little change. Finally, the amplitude was larger for communities with colder climates, higher proportions of elderly peo-ple and lower unemployment rates ( p-values < 0.05).
Conclusions.Despite the common features of a spring peak and a winter trough, seasonal suicide patterns were largely heterogeneous in shape, amplitude, subgroup differences and temporal changes among different populations, as influenced by climate, demographic and socioeconomic conditions. Our findings may help elucidate the underlying mechanisms of seasonal suicide patterns and aid in improving the design of population-specific suicide pre-vention programmes based on these patterns.
Introduction
Abundant research dating back to the 19th century demonstrates seasonal suicide patterns, with an increase in spring and a decrease in winter (Durkheim, 1897; Maes et al., 1993; Chew and McCleary, 1995; Ajdacic-Gross et al., 2010; Christodoulou et al., 2012; Woo et al., 2012; Roehner, 2015; Dixon and Kalkstein,2018; Yang et al.,2019). While the pattern of seasonal suicides has been confirmed in many countries, the mechanisms remain unclear. The most plausible underlying mechanisms for seasonal suicide patterns include seasonal fluctuations of social activities (Souêtre et al., 1990; Maes et al., 1993; Chew and McCleary,1995; Ajdacic-Gross et al., 2010; Christodoulou et al.,
2012; Roehner,2015) and bioclimatic factors, such as temperature or amount of sunshine (Souêtre et al., 1987, 1990; Linkowski et al., 1992; Maes et al., 1994; Deisenhammer et al., 2003; Lambert et al., 2003; Papadopoulos et al., 2005; Ruuhela et al.,
2009; Muller et al.,2011; Vyssoki et al.,2012; Moore et al.,2018). Comparison of seasonal suicide patterns across geographically, demographically and socioeconomically heterogeneous popula-tions should help elucidate the underlying factors influencing these patterns and better explain the mechanisms of the phenom-enon. However, almost all previous studies on seasonal suicides investigated a study population that was relatively homogeneous (e.g. a single city, a single country or a few communities within a country) (Woo et al.,2012). Moreover, these studies differed in terms of experimental design and statistical methodology, mak-ing it difficult to directly compare results or quantify heterogen-eity among different populations (Woo et al.,2012).
To evaluate heterogeneity and underlying determinants sys-tematically, a large-scale, multi-country, multi-community study is necessary as it allows for analysing the time-series data of the number of suicides from multiple populations in a unified mod-elling framework. One previous study (Chew and McCleary,
1995) evaluated between-country variability in spring suicide peaks and examined how this variability is associated with biocli-matic and socio-demographic factors, but was limited to the use of country-specific, monthly data collected between the 1960s and 1980s, and the analysis of simple, descriptive indices of sea-sonality. No other previous studies conducted a large-scale multi-population analysis.
Here, we investigated seasonal suicide patterns across 354 communities from 12 countries by analysing weekly time-series data of suicide numbers between 1986 and 2016 using a unified statistical modelling framework. We aimed to (1) compare the shape and amplitude of seasonal suicide patterns across countries and communities; (2) examine how seasonality differs by sex, age group and subperiod and (3) identify community-specific charac-teristics modifying seasonal suicide patterns. To our knowledge, this is the first large-scale, multi-country, multi-community study to comprehensively examine heterogeneity of seasonality in suicide and its underlying determinants among highly diverse populations.
Methods Data collection
Daily time-series data of suicide numbers were collected across 354 communities in 12 countries. Geographical locations of all communities are displayed inFig. 1. The collection period varied by country, ranging from 6 (the USA) to 30 years (Canada) (Table 1). Suicide was defined as intentional self-poisoning and
self-harm based on the International Statistical Classification of Diseases and Related Health Problems (ICD) (E950.0–E958.9 for the ICD-8 and -9 and X60–X84 for the ICD-10). Data collec-tion details are available in the Supplement. We derived the weekly sum of suicide numbers to increase statistical power, given that numerous zero values were observed in the daily data. A week was defined as an interval of seven days, starting from 1st January of each year. Thus, each year was comprised of 53 weeks, with the final week including only one or two days. For the final week, weekly suicide numbers were adjusted using the number of suicides from the previous week (i.e. 52nd week of the same year) and the following week (i.e. 1st week of the next year). Details for the adjustment are available in the Supplement. Summary statistics of the total number of suicides for each community are available in eTable 1 and histograms of the number of weekly suicides for each community are available in eFig. 1 in the Supplement.
Data for community-level indicators were collected from a recent multi-country study (Sera et al.,2019). Demographic and socioeconomic indicators were extracted from the Organization for Economic Co-operation and Development (OECD) Regional and Metropolitan Database and the World Cities Database. Demographic variables included total population, population density (population/km2), proportion of people aged≥65 years and life expectancy. Socioeconomic variables included gross domestic product (GDP), unemployment rate and educational level. Data for air pollution and climate indicators were obtained from a previous study (Sera et al.,2019); global estimates of the annual average concentrations of fine (diameter <2.5μm) particu-late matter (PM2.5) and ground-level measurements of nitrogen dioxide (NO2) concentrations were available, and the overall aver-age daily mean temperature over the study period was derived. More information for the indicators is available in eTable 2 in the Supplement.
Statistical analyses
Error/trend/season (ETS) decomposition
To evaluate the portion of the weekly variation in suicide numbers that was explained by the seasonal components, weekly time-series data were decomposed into trend, seasonal and remainder (i.e. error) components by the seasonal-trend decomposition using the Loess (STL) method (Cleveland et al.,1990). We used R statistical software (version 3.6.1; R Development Core Team) with the stl() function in the forecast package.
Estimation of the seasonality of suicide
A two-stage analysis was conducted to estimate community-specific and country-specific seasonality of suicide. Mathematical details are available in the Supplement. In the first stage, we estimated seasonality for each community using a generalised linear model with a quasi-Poisson distribution. We controlled for the effect of year by including indicators for each year. We modelled nonlinear and cyclic seasonal patterns of sui-cide through a cyclic B-spline basis function with four degrees of freedom (df) applied to the week variable (using values from 1 to 53). The choice of df = 4 was guided by model evaluation based on the likelihood ratio test, the quasi-Akaike information criterion (QAIC), and the interpretability of the results. Particularly, we considered the largest communities of each country for model evaluation, as the statistical uncertainty for the estimated seasonal patterns was the smallest. Details for model evaluation are
presented in the Supplement. From the chosen model, community-specific parameters for seasonality were estimated to generate curves of the relative risk (RR) of suicide over all 53 weeks v. the week with the lowest number of suicides. Additionally, the peak/trough RR was derived as a single number summarising the community-specific amplitude of seasonality. In the second stage, community-specific parameters for seasonality were combined using multivariate meta-regression with country indicators included as meta-predictors. From the fitted meta-regression, country-specific parameters for seasonality were extracted to generate country-specific RR curves and peak/ trough RR. We used R statistical software (version 3.6.1; R Development Core Team) with the mixmeta() function in the mixmeta package for the second-stage modelling.
Estimation of the seasonality of suicide by sex, age group and subperiod
We estimated the seasonality of suicide by sex, age group (<65 or ≥65 years) and subperiod (before or after the year 2000) through the two-stage analysis. For the subperiod analysis, Mexico, Romania, South Africa and the USA were excluded because their data were mostly available only after 2000. To estimate sub-group (or subperiod) differences, we estimated community-specific seasonality for each subgroup in the first-stage analysis, and combined the community-specific parameters from both sub-groups using multivariate meta-regression including country indi-cators, a binary indicator for subgroup, and their interactions as meta-predictors in the second-stage modelling. From the meta-regression, we extracted subgroup-specific seasonality
Fig. 1.Spatial map of the location of 354 communities in 12 countries with the peak/trough relative risk (RR) of suicide estimated from the first-stage modeling. The size of the points corresponds to the precision of the RR estimate (i.e., the inverse of the standard error of the community-specific RR).
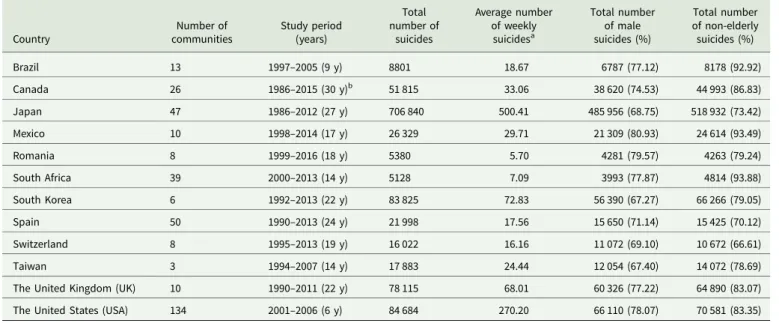
Table 1.Summary statistics of the number of suicides for each of the 12 countries
Country Number of communities Study period (years) Total number of suicides Average number of weekly suicidesa Total number of male suicides (%) Total number of non-elderly suicides (%) Brazil 13 1997–2005 (9 y) 8801 18.67 6787 (77.12) 8178 (92.92) Canada 26 1986–2015 (30 y)b 51 815 33.06 38 620 (74.53) 44 993 (86.83) Japan 47 1986–2012 (27 y) 706 840 500.41 485 956 (68.75) 518 932 (73.42) Mexico 10 1998–2014 (17 y) 26 329 29.71 21 309 (80.93) 24 614 (93.49) Romania 8 1999–2016 (18 y) 5380 5.70 4281 (79.57) 4263 (79.24) South Africa 39 2000–2013 (14 y) 5128 7.09 3993 (77.87) 4814 (93.88) South Korea 6 1992–2013 (22 y) 83 825 72.83 56 390 (67.27) 66 266 (79.05) Spain 50 1990–2013 (24 y) 21 998 17.56 15 650 (71.14) 15 425 (70.12) Switzerland 8 1995–2013 (19 y) 16 022 16.16 11 072 (69.10) 10 672 (66.61) Taiwan 3 1994–2007 (14 y) 17 883 24.44 12 054 (67.40) 14 072 (78.69)
The United Kingdom (UK) 10 1990–2011 (22 y) 78 115 68.01 60 326 (77.22) 64 890 (83.07) The United States (USA) 134 2001–2006 (6 y) 84 684 270.20 66 110 (78.07) 70 581 (83.35)
aAverage number of weekly suicides = (Total number of suicides)/(study years × 53 weeks). bThe study period for the city of Montreal is 1992–2015 (24 years).
parameters and generated the RR curves for each subgroup and each country. Using multivariate Wald test, we assessed whether the RR curves significantly differed between subgroups for each country.
Influence of community-level indicators on the seasonality of suicide
Each community-level indicator was standardised by subtracting country-specific means and scaling by country-specific standard deviations. The impact of all indicators on the seasonality of sui-cide was investigated by simultaneously controlling for each other indicator through the two-stage analysis. Community-specific seasonality parameters were extracted from the first-stage model and pooled by meta-regression with country indicators and all of the standardised community-level indicators included as meta-predictors. The modelling included 269 communities of six coun-tries (Canada, Japan, South Korea, Spain, the UK and the USA) because of the data availability. A stepwise variable selection was conducted to identify the optimal subset of indicators starting with a minimal model that only included country indicators. Adding an indicator was determined based on the largest reduc-tion in the AIC, and the importance of an added indicator was presented as the AIC, I2 statistic and p-value of the Wald test. We used the step() function in the mixmeta package for variable selection. The effect of the selected indicators on seasonal patterns was illustrated by the RR curve, estimated with each indicator fixed at the 10th and 90th percentiles for each country, control-ling for the other indicators set as each country’s mean.
Sensitivity analysis
We evaluated sensitivity of the results based on the choice of the degrees of freedom specified for the cyclic spline in the first-stage modelling. We conducted the two-stage modelling with df = 2, 3, 5, 6 and 7 to compare with the main results derived with the cho-sen df = 4.
Results
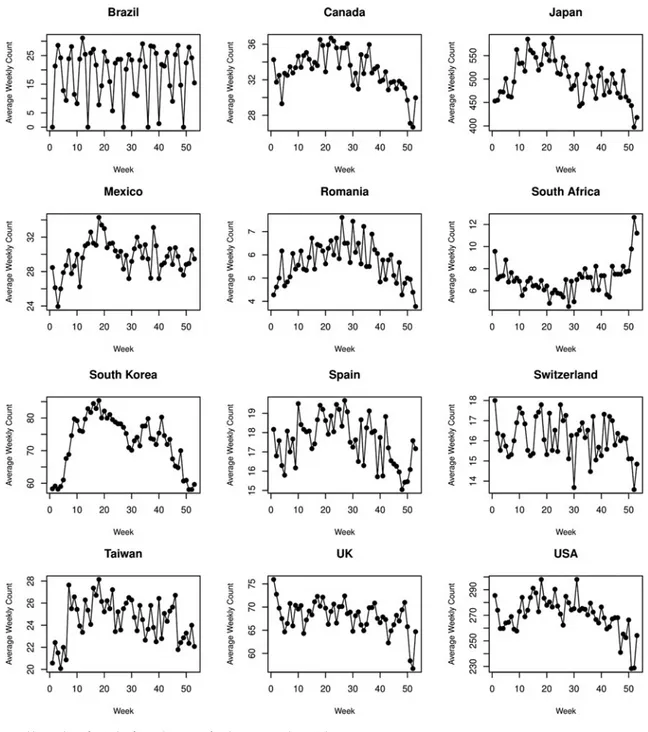
Table 1presents summary statistics of suicide numbers for each country. The total number of suicides considered was 1 106 820. The proportions of male and non-elderly suicides exceeded 67 and 66%, respectively, with variability among countries. The aver-age weekly suicide counts were presented for each country in
Fig. 2. They indicate that there exist strong seasonal patterns of suicide in most of the countries, while the patterns were heteroge-neous among the countries. The ETS decomposition revealed that the contribution of seasonal components to the weekly suicide counts varied across countries (eFig. 2 in the Supplement). In Brazil, Japan, South Africa, South Korea, Taiwan and the USA, seasonal and error components seemed to explain the weekly vari-ation with comparable portions, once the trend was removed. In Canada, Mexico, Romania, Switzerland, Spain and the UK, the portion of the weekly variation explained by seasonal compo-nents was relatively small.
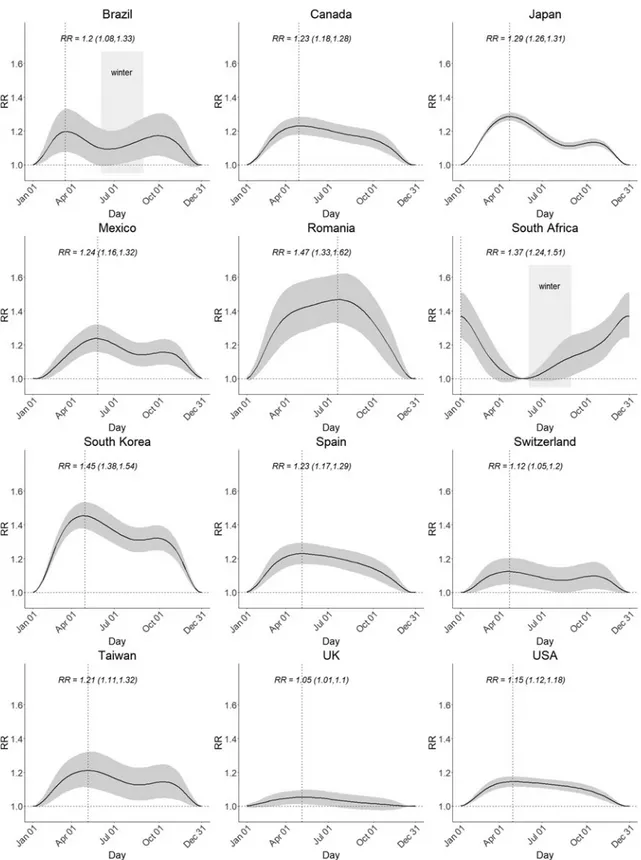
Figure 3shows country-specific seasonal patterns of suicide (see eFig. 3 in the Supplement for community-specific seasonal pat-terns). Northern Hemisphere countries exhibited spring peaks (April–May) and winter troughs (December–January), except for Romania peaking in summer (July). For Southern Hemisphere countries, Brazil exhibited two peaks in the spring and autumn (October and April) and a trough in the summer (January), while South Africa exhibited a peak in the summer (January)
and a trough in the late autumn (June). In countries such as Brazil, Japan, Mexico, South Korea, Switzerland and Taiwan, sea-sonality was bimodal, with the second peak observed in the autumn. In other countries including Canada, Romania, South Africa, Spain, UK and the USA, unimodal seasonality was exhib-ited. The peak/trough RR varied between countries; Romania showed the highest value of 1.47 (95% CI: 1.33–1.62) followed by South Korea with 1.45 (95% CI: 1.38–1.54) and South Africa with 1.37 (95% CI: 1.24–1.51), respectively. The RRs were between 1.2 and 1.3 for Brazil, Canada, Japan, Mexico, South Africa, Spain and Taiwan, while below 1.2 for Switzerland, the UK and the USA. The country-specific peak and trough weeks and the peak/trough RR are reported in eTable 3 in the Supplement.
Figure 4presents the sex-, age group- and subperiod-specific seasonality of suicide for each country. Seasonal patterns differed significantly by sex in Japan, the UK and the USA ( p < 0.05) (Fig. 4a). In Japan, the number of suicides peaked for males 3 weeks earlier than for females. In the UK and the USA, females displayed a seasonal pattern with a larger amplitude than males. Also, the seasonal pattern differed by age groups in several coun-tries (Fig. 4b); the amplitude was larger for older than for younger people in Canada, Japan, South Korea, Spain, Switzerland and the USA ( p < 0.05). Additionally, the seasonality differed between the two subperiods in some countries (Fig. 4c); the spring peak was lower after 2000 in Canada ( p < 0.05), the peak was pushed for-ward after 2000 in Japan ( p < 0.05), while the spring peak increased after 2000 in Spain, Taiwan and UK ( p < 0.05).
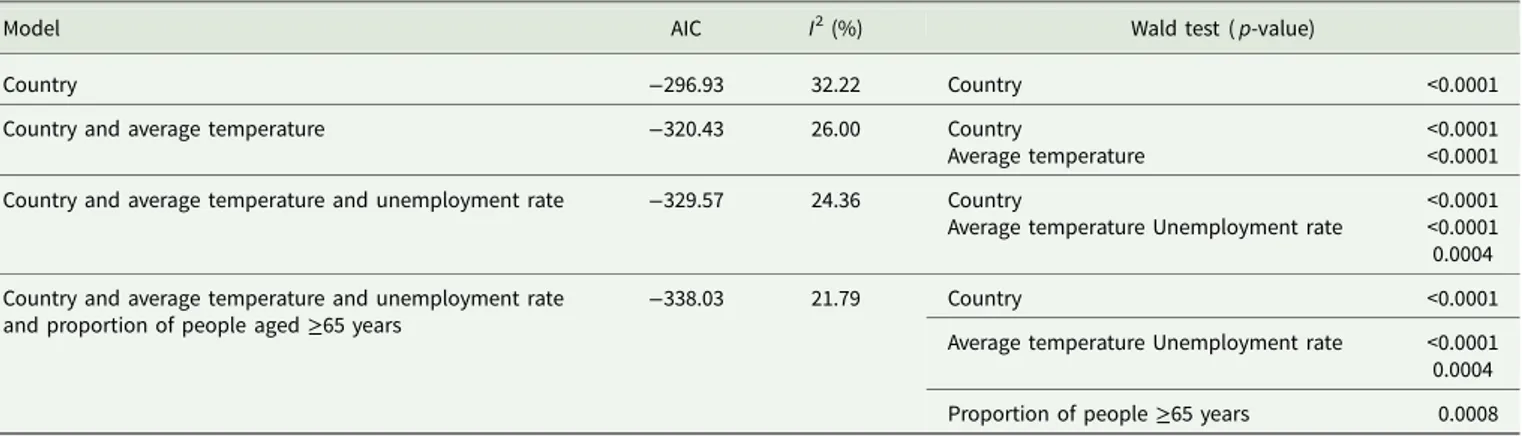
Table 2summarises the impact of the community-level indica-tors on the seasonality of suicide. Applying a stepwise variable selection in meta-regression, the final model included country indicator, average temperature, unemployment rate and propor-tion of people aged ≥65 years. The effects of each indicator on the seasonal pattern are illustrated in eFig. 4 in the Supplement. The seasonal suicide pattern was larger for communities with lower temperatures, lower unemployment rates and higher pro-portions of people aged≥65, adjusting for each other indicator.
We conducted sensitivity analysis using cyclic splines with df = 2, 3, 5, 6 and 7. The country-specific RR curves are presented in eFigs 5–9. The RR curves with df = 2 exhibited unimodal seasonal pat-terns in all countries, clearly underfitting the seasonality in many countries. RR curves with df = 3 were similar to RR curves with df = 4 inFig. 3; they captured the bimodal seasonal pattern in coun-tries including Brazil, Japan, South Korea and Taiwan, while pre-serving the unimodal pattern in the other countries. RR curves with df = 3 showed slightly sharper peaks and lower peak/trough RR than those with df = 4. RR curves with df = 5, 6 and 7 overfit the seasonality in several countries, with‘wiggly’ patterns complicat-ing interpretation, unnecessarily increascomplicat-ing model complexity.
Discussion
We investigated heterogeneity in the seasonality of suicide across 354 communities in 12 countries by analysing weekly time-series data of suicide numbers from 1986 to 2016. To our knowledge, this is the first large scale, multi-country, multi-community study to examine heterogeneity and its underlying determinants, particu-larly among populations that are highly diverse using a long period with up-to-date data. We confirmed that the spring peak in suicide numbers was consistently observed in almost all countries, but the shape and amplitude of seasonality, subgroup difference and tem-poral changes varied between countries. We observed that seasonal effects on suicide were greater for females and the elderly than for
males and younger people in some countries, and the amplitude tended to be larger in communities with colder climates, higher proportions of the elderly and lower unemployment rates. The temporal change of seasonality was inconclusive; the seasonal pat-tern increased, decreased or remained roughly constant over the subperiods depending on the country.
Our results showed that suicide numbers peaked in spring in most countries replicating those of previous studies. The most sub-stantiated explanation for the spring peak is the seasonal cycle of bioclimatic factors such as temperature and amount of sunshine (Souêtre et al., 1987, 1990; Linkowski et al., 1992; Maes et al.,
1993, 1994; Chew and McCleary, 1995; Deisenhammer et al.,
2003; Lambert et al., 2003; Papadopoulos et al., 2005; Ruuhela et al., 2009; Ajdacic-Gross et al., 2010; Muller et al., 2011; Christodoulou et al., 2012; Vyssoki et al., 2012; Moore et al.,
2018). Specifically, levels of serotonin, a neurotransmitter that
regulates emotion, are sensitive to weather variability and light exposure, so springtime changes in expression may be associated with increased suicidal behaviour (Brewerton, 1989; Praschak-Rieder et al.,2008). Another well-accepted interpretation for the spring peak is socio-psychiatric mechanisms; high intensity social or occupational activities in the spring may be the underlying driver of spring spikes in suicide numbers (Ajdacic-Gross et al.,
2010; Christodoulou et al., 2012). In many countries, spring is a season of renewal and is, therefore, likely to cause more social stress, which is a possible trigger for suicide. People may also experience disappointment with excessive expectations for a new start, which is a plausible psychiatric mechanism to explain the spring peak in suicides, known as the ‘broken promise effect’ (Gabennesch, 1988; Tsouvelas et al., 2019). Though the spring peak was a common feature, two countries were exceptions: Romania and South Africa showed summer peaks. There may
exist some country-specific factors that could explain such a dis-crepancy, though further evidence is needed for confirmation.
Despite the common feature of the spring peak, the seasonal suicide pattern was heterogeneous in overall shape. Many coun-tries exhibited bimodal seasonality, with the highest peak in
spring and the second highest peak in autumn in northeast Asian countries (Japan, South Korea and Taiwan) and Mexico (Fig. 2), which was replicated in South Korea, Japan, Finland and Sweden (Likhvar et al.,2011; Holopainen et al., 2013; Yang et al.,2019). Assuming that the previously explained bioclimatic
Fig. 3.Country-specific seasonality of suicide. The y-axis represents the relative risk (RR) of suicide for all other weeks versus the week in which the estimated number of suicides is lowest. The shaded area indicates the 95% confidence intervals. The dotted lines indicate the week in which the estimated number of suicides was highest. The peak/trough RR is presented with 95% confidence intervals. The winter seasons are marked for the countries in the Southern Hemisphere (Brazil and South Africa).
and socio-psychiatric mechanisms underlie the seasonal suicide patterns, the major peak in springtime may be influenced by both mechanisms simultaneously, while the local peak in autumn may be attributed mostly to the bioclimatic mechanisms. This
explanation, however, may not apply to several countries in Europe or the North America, for which the seasonal pattern was a unimodal shape, with a plateau from spring to autumn. The countries in the Southern Hemisphere (Brazil and South
Fig. 4.(A) Sex-specific, (B) age group-specific, and (C) subperiod-specific seasonality of suicide for each country. The y-axis represents the relative risk (RR) of sui-cide for all other weeks versus the week in which the estimated number of suisui-cides is lowest. The shaded areas indicate the 95% confidence intervals. The dotted lines indicate the week of the year in which the estimated number of suicides was highest. The p-value was calculated from the multivariate Wald test, comparing the RR curves between two subgroups or subperiods.
Africa) showed unique seasonal patterns. Brazil exhibited twin peaks in spring and autumn and a trough in summer, which was consistent with a previous study of Sao Paulo (Bando et al.,
2009), but differed from reports of spring or early summer peaks observed only in the south of Brazil (Benedito-Silva et al.,
2007). South Africa exhibited unimodality with summer peak, which was consistent with an Australian study (Rock et al.,2003). We observed sex-related differences in seasonal suicide pat-terns in Japan, the UK and the USA. Previous studies have reported a single spring peak for males and two peaks for females in the UK, Finland and Italy (Meares et al.,1981; Näyhä,1982; Micciolo et al.,1989; Preti and Miotto,1998), which were repli-cated in our study in the UK only. The peak appeared later for females in Japan, while the amplitude was larger for females in the USA. In other countries, sex-related differences were not sig-nificant. Our results were based on more up-to-date data than previous studies that relied on data collected before or about the 1980s. Recently, gender roles have been changing and social status of women has risen, possibly reducing sex differences in suicide seasonality. Also, the amplitude of seasonality was larger for the elderly population than for younger people in many countries. Although age group differences have been inconclusive in previ-ous studies (Woo et al.,2012), our observation could relate to the temperature–suicide association reported as larger in elderly populations in some countries (Kim et al., 2019; Sim et al.,
2020). The elderly may be more sensitive to seasonal temperature changes in terms of the risk of dying by suicide. Alternatively, in spring and summer, younger generations spend more time out-side rather than caring for elderly people, possibly contributing to increased suicides in the elderly in the spring or summer (Preti and Miotto,1998).
Previous studies reported that seasonal changes in suicide have diminished since the 19th century and, eventually, may even dis-appear (Yip et al., 2000; Ajdacic-Gross et al., 2005; Bramness et al.,2015). A plausible explanation for this trend was that the urbanisation proceeded and people in urban areas are less sensi-tive to seasonal changes that increase suicide risks (Ajdacic-Gross et al.,2005, 2010). However, our results indicate that temporal changes varied by country. In Canada, the spring peak decreased after the year 2000, consistent with previous results showing decreased seasonality in European countries (Oravecz et al.,
2006; Bramness et al., 2015). Meanwhile, peaks increased in Spain, Taiwan and the UK after 2000, consistent with previous studies showing increasing seasonality in countries such as the USA, Ireland and Australia (Rock et al., 2003; Casey et al.,
2012; Schwartz,2019). The other countries showed little change over the periods, consistent with previous evidence that seasonal-ity did not decrease for Austria and China (Nader et al.,2011; Sun et al.,2011). These suggest that the temporal change in seasonal suicide patterns is specific to each country, possibly related to country-specific macroeconomic indicators that fluctuate over a long period of time. No previous study investigated the temporal change in suicide seasonality relating to those indicators, for which further research is merited.
The amplitude of seasonality was larger for the communities with colder climates, higher proportions of the elderly and lower unemployment rates. This finding aligns with literature suggesting a latitudinal effect on seasonal suicide rhythms (Benedito-Silva et al.,2007; Schwartz,2019), though specific causes of this latitu-dinal effect remain unknown. From a climatic perspective, larger seasonality in colder regions may relate to acclimatisation, as peo-ple living in colder areas are less adapted to warmer seasons (i.e. spring in the Northern Hemisphere) and more sensitive to sea-sonal temperature changes that may increase suicide risks. Such acclimatisation has been observed in the studies that investigated the association between temperature and all-cause mortality (Chung et al.,2018; Sera et al.,2019) and the temperature–suicide
association also (Kim et al.,2019; Sim et al., 2020). In addition, larger seasonality in communities with higher proportions of eld-erly people is consistent with larger amplitudes observed for older age groups in most countries. Alternatively, it may reflect the urban/rural difference in seasonal suicide (Durkheim, 1897; Gabennesch, 1988; Chew and McCleary, 1995; Ajdacic-Gross et al.,2005; Sun et al.,2011) as a higher proportion of the elderly is one of the rural characteristics. In rural areas, people are typic-ally engaged in agricultural activities and the intensity of social stress tends to fluctuate seasonally, while urban people may be more resilient to seasonal changes. Finally, higher unemployment rates may increase the overall suicide rate, which may decrease the seasonal pattern because people who are depressed tend to die by suicide regardless of season.
The current study investigated a broad definition of the sea-sonality of suicide. However, as different mechanisms (e.g. biocli-matic, socio-psychiatric, physical or others) possibly contribute simultaneously to seasonal suicide patterns, it would be more informative to decompose overall seasonal fluctuations into dif-ferent mechanistic components. However, no previous study has examined how seasonal fluctuations are decomposed. One way would be to examine a residual seasonal pattern after controlling for bioclimate factors such as temperature or sunshine. Such
Table 2.Model selection for community-specific indicators using 269 communities of six countries
Model AIC I2(%) Wald test ( p-value)
Country −296.93 32.22 Country <0.0001
Country and average temperature −320.43 26.00 Country
Average temperature
<0.0001 <0.0001 Country and average temperature and unemployment rate −329.57 24.36 Country
Average temperature Unemployment rate
<0.0001 <0.0001 0.0004 Country and average temperature and unemployment rate
and proportion of people aged≥65 years
−338.03 21.79 Country <0.0001
Average temperature Unemployment rate <0.0001 0.0004 Proportion of people≥65 years 0.0008
residual seasonality, if observed, represents the portion driven by non-bioclimatic mechanisms, possibly socio-psychiatric or others. Identifying components that contribute to seasonal fluctuations the most and are potentially treatable would help reduce future suicide burdens (Woo et al.,2012).
Our results provide important public health implications for suicide prevention. In countries such as Brazil, South Africa, Japan, South Korea, Taiwan and the USA, a large portion of the weekly suicide counts was explained by seasonal effects (eFig. 2). Also, in these countries, the amplitude of the seasonality was relatively larger, except for the USA (Fig. 3), and higher sui-cide rates than the global average have been reported as 11.6–26.9 per 100 000 people in 2016 (WHO, 2016) except for Brazil. Therefore, suicide prevention strategies targeting the peak seasons and vulnerable subgroups (e.g. elderly people, females, regions with colder climates or lower unemployment rates), would help reduce the seasonal and overall suicide burden. As an example, Japan has enacted a ‘Suicide Prevention Week’ and ‘Suicide Countermeasures Strengthening Month’ as part of its suicide pre-vention policies, which have been helpful in promoting public awareness and in monitoring potential suicide victims (WHO,
2018). Other countries where season explains a large portion of the suicide burden may adopt similar strategies targeting specific seasons and subgroups. On the other hand, in countries such as Canada, Mexico, Romania, Switzerland, Spain and the UK, the contribution of the seasonal component to the weekly variation was relatively small, implying that targeting risk factors other than season is more important for reducing the suicide burden. Even so, Romania showed the largest amplitude (1.47) and Switzerland recorded a high suicide rate of 17.2 per 100 000 peo-ple (WHO, 2016), suggesting that seasonal prevention strategies would still help decrease seasonal suicide burdens.
We acknowledge several limitations. First, the data collection period did not precisely coincide with the collection period of community-level indicators because of the difficulty in obtaining data across different communities and countries over long peri-ods. Fortunately, the correlation between indicators in different years was high; thus, errors that may impact risk factors should be minor (Sera et al.,2019). Second, the seasonality of most coun-tries was estimated based on relatively urbanised communities, except for two countries (Japan and the UK) for which rural and urban regions across the entire country were included. The lack of rural data from certain locations may result in biased esti-mates for seasonality in those countries. Third, our analysis of temporal change was based on two dichotomised periods, limiting the ability to assess continuous changes over time.
Conclusions
Our results suggest that the seasonality of suicide is largely hetero-geneous across geographically, demographically and socio-economically diverse populations. The shape and amplitude of seasonality, sex and age group differences, temporal changes and the contribution of seasonal effects to the weekly variation largely varied across countries, implying that country-specific fac-tors modify seasonal patterns of suicide, as do community-level characteristics such as climate, demographic structure and socio-economic condition. This study contributes to the understanding of the potential mechanisms that underlie the seasonality of sui-cide. Furthermore, our findings suggest that future suicide pre-vention programmes can be better designed by considering seasonal suicide patterns in vulnerable populations.
Supplementary material. The supplementary material for this article can be found athttps://doi.org/10.1017/S2045796020000748.
Availability of data and materials. Data analysed in this study will not be available to the public. However, at any time, researchers may contact the 4th author (Masahiro Hashizume:hashizume@m.u-tokyo.ac.jp) or the principal investigator (Yeonseung Chung:dolyura@kaist.edu) for data sharing.
Acknowledgements. None.
Financial support. JY, DY and YC were supported by a Senior Research grant (2019R1A2C1086194) from the National Research Foundation of Korea (NRF), funded by the Ministry of Science, ICT (Information and Communication Technologies) and Government-wide R&D Fund project for Infectious Disease (HG18C0025). YK was supported by the Japan Society for the Promotion of Science (JSPS) KAKENHI Grant Number JP19K17104 in Japan. AG and FS were supported by the Medical Research Council UK (Grant ID: MR/R013349/1) and Natural Environment Research Council (Grant ID: NE/R009384/1). NS was supported by the NIEHS-funded HERCULES Center (P30ES019776).
Conflict of interest. None.
References
Ajdacic-Gross V, Bopp M, Sansossio R, Lauber C, Gostynski M, Eich D, Gutzwiller F and Rössler W(2005) Diversity and change in suicide season-ality over 125 years. Journal of Epidemiology and Community Health 59, 967– 972.
Ajdacic-Gross V, Bopp M, Ring M, Gutzwiller F and Rossler W(2010) Seasonality in suicide– a review and search of new concepts for explain-ing the heterogeneous phenomena. Social Science & Medicine 71, 657– 666.
Bando DH, Scrivani H, Morettin PA and Teng CT(2009) Seasonality of sui-cide in the city of Sao Paulo, Brazil, 1979–2003. Brazilian Journal of Psychiatry 31, 101–105.
Benedito-Silva AA, Nogueira Pires ML and Calil HM(2007) Seasonal vari-ation of suicide in Brazil. Chronobiology Internvari-ational 24, 727–737. Bramness JG, Walby FA, Morken G and Røislien J(2015) Analyzing
sea-sonal variations in suicide with Fourier Poisson time-series regression: a registry-based study from Norway, 1969–2007. Journal of Epidemiology and Community Health 182, 224–254.
Brewerton TD (1989) Seasonal variation of serotonin function in humans research and clinical implications. Annals of Clinical Psychiatry 1, 153–164.
Casey P, Gemmell I, Hiroeh U and Fulwood C(2012) Seasonal and socio-demographic predictors of suicide in Ireland: a 22-year study. Journal of Affective Disorders 136, 862–867.
Chew KS and McCleary R(1995) The spring peak in suicides: a cross-national analysis. Social Science & Medicine 40, 223–230.
Christodoulou C, Douzenis A, Papadopoulos FC, Papadopoulou A, Bouras G, Gournellis R and Lykouras L(2012) Suicide and seasonality. Acta Psychiatrica Scandinavica 125, 127–146.
Chung Y, Yang D, Gasparrini A, Vicedo-Cabrera AM, Ng CFS, Kim Y, Honda Y and Hashizume M (2018) Changing susceptibility to non-optimum temperatures in Japan, 1972–2012: the role of climate, demo-graphic and socio-economic factors. Environmental Health Perspectives 126, 057002.
Cleveland RB, Cleveland WS, McRae JE and Terpenning I(1990) STL: a seasonal-trend decomposition procedure based on Loess. Journal of Official Statistics 6, 3–73.
Deisenhammer EA, Kemmler G and Parson P (2003) Association of meteorological factors with suicide. Acta Psychiatrica Scandinavica 108, 455–459.
Dixon PG and Kalkstein AJ(2018) Where are weather-suicide associations valid? An examination of nine US counties with varying seasonality. International Journal of Biometeorology 62, 685–697.
Gabennesch H(1988) When promises fail: a theory of temporal fluctuations in suicide. Social Forces 67, 129–145.
Holopainen J, Helama S, Björkenstam C and Partonen T(2013) Variation and seasonal patterns of suicide mortality in Finland and Sweden since the 1750s. Environmental Health and Preventive Medicine 18, 494–501. Kim Y, Kim H, Gasparrini A, Armstrong B, Honda Y, Chung Y, Ng CFS,
Tobias A, Íñiguez C, Lavigne E, Sera F, Vicedo-Cabrera AM, Ragettli MA, Scovronick N, Acquaotta F, Chen BY, Guo YL, Seposo X, Dang TN, de Sousa Zanotti Stagliorio Coelho M, Saldiva PHN, Kosheleva A, Zanobetti A, Schwartz J, Bell ML and Hashizume M (2019) Suicide and ambient temperature: a multi-city multi-country study. Environmental Health Perspectives 127, 117007.
Lambert G, Reid C, Kaye D, Jennings G and Esler M(2003) Increased sui-cide rate in the middle-aged and its association with hours of sunlight. American Journal of Psychiatry 160, 793–795.
Likhvar V, Honda Y and Ono M(2011) Relation between temperature and suicide mortality in Japan in the presence of other confounding factors using time-series analysis with a semiparametric approach. Environmental Health and Preventive Medicine 16, 36–43.
Linkowski P, Martin F and De Maertelaer V(1992) Effect of some climatic factors on violent and non-violent suicides in Belgium. Journal of Affective Disorders 25, 161–166.
Maes M, Cosyns P, Meltzer HY, De Meyer F and Peeters D (1993) Seasonality in violent suicide but not in nonviolent suicide or homicide. American Journal of Psychiatry 150, 1380–1385.
Maes M, DeMeyer F, Thompson P, Peeters D and Cosyns P (1994) Synchronized annual rhythms in violent suicide rate, ambient temperature and the light-dark span. Acta Psychiatrica Scandinavica 90, 391–396. Meares R, Mendelsohn FA and Milgrom-Friedman J(1981) A sex difference
in the seasonal variation of suicide rate: a single cycle for men, two cycles for women. British Journal of Psychiatry 138, 321–325.
Micciolo R, Zimmermann-Tansella C, Williams P and Tansella M(1989) Seasonal variation in suicide: is there a sex difference? Psychological Medicine 19, 199–203.
Moore FR, Bell M, Macleod M, Smith E, Beaumont J, Graham L and Harley TA (2018) Season, weather, and suicide-further evidence for ecological complexity. Neurology, Psychiatry and Brain Research 30, 110–116. Muller H, Biermann T, Renk S, Reulbach U, Ströbel A, Kornhuber J and
Sperling W(2011) Higher environmental temperature and global radiation are correlated with increasing suicidality− a localized data analysis. Chronobiology International 28, 949–957.
Nader IW, Pietschnig J, Niederkrotenthaler T, Kapusta ND, Sonneck G and Voracek M(2011) Suicide seasonality: complex demodulation as a novel approach in epidemiologic analysis. PLoS ONE 6, e17413.
Näyhä S(1982) Autumn incidence of suicides re-examined: data from Finland by sex, age and occupation. British Journal of Psychiatry 141, 512–517. Oravecz R, Rocchi MB, Sisti D, Zorko M, Marusic A and Preti A(2006)
Changes in the seasonality of suicides over time in Slovenia, 1971 to 2002. Journal of Affective Disorders 95, 135–140.
Papadopoulos FC, Frangakis CE, Skalkidou A, Petridou E, Stevens RG and Trichopoulos D(2005) Exploring lag and duration effect of sunshine in triggering suicide. Journal of Affective Disorders 88, 287–297.
Praschak-Rieder N, Willeit M, Wilson AA, Houle S and Meyer JH(2008) Seasonal variation in human brain serotonin transporter binding. Archives of General Psychiatry 65, 1072–1078.
Preti A and Miotto P(1998) Seasonality in suicides: the influence of suicide method, gender and age on suicide distribution in Italy. Psychiatry Research 81, 219–231.
Rock D, Greenberg DM and Hallmayer JF(2003) Increasing seasonality of suicide in Australia, 1970–1999. Psychiatry Research 120, 43–51. Roehner BM(2015) How can one explain changes in the monthly pattern of
suicide? Physica A: Statistical Mechanics and its Applications 424, 350–362. Ruuhela R, Hiltunen L, Venäläinen A, Pirinen P and Partonen T(2009) Climate impact on suicide rates in Finland from 1971 to 2003. International Journal of Biometeorology 53, 167–175.
Schwartz P(2019) Chris Cornell, the Black Hole Sun, and the seasonality of suicide. Neuropsycobiology 78, 38–47.
Sera F, Armstrong B, Tobias A, Vicedo-Cabrera AM, Åström C, Bell ML, Chen BY, de Sousa Zanotti Stagliorio Coelho M, Matus Correa P, Cruz JC, Dang TN, Hurtado-Diaz M, Do Van D, Forsberg B, Guo YL, Guo Y, Hashizume M, Honda Y, Íñiguez C, Jaakkola JJK, Kan H, Kim H, Lavigne E, Michelozzi P, Ortega NV, Osorio S, Pascal M, Ragettli MS, Ryti NRI, Saldiva PHN, Schwartz J, Scortichini M, Seposo X, Tong S, Zanobetti A and Gasparrini A(2019) How urban characteristics affect vulnerability to heat and cold: a multi-country analysis. International Journal of Epidemiology 48, 1101–1112.
Sim K, Kim Y, Hashizume M, Gasparrini A, Armstrong B, Sera F, Ng CFS, Honda Y and Chung Y(2020) Nonlinear temperature-suicide association in Japan from 1972 to 2015: its heterogeneity and the role of climate, demo-graphic, and socioeconomic factors. Environmental International 142, 105829. Souêtre E, Salvati E, Belugou JL, Douillet P, Braccini T and Darcourt G (1987) Seasonality of suicides: environmental, sociological and biological covariations. Journal of Affective Disorders 13, 215–225.
Souêtre E, Wehr TA, Douillet P and Darcourt G (1990) Influence of environmental factors on suicidal behavior. Psychiatry Research 32, 253–263.
Sun J, Guo X, Ma J, Zhang J, Jia C and Xu A(2011) Seasonality of suicide in Shandong China, 1991–2009: associations with gender, age, area and meth-ods of suicide. Journal of Affective Disorders 135, 258–266.
Tsouvelas G, Giotakos O, Massou E and Konstantakopoulos G (2019) Seasonality and related aspects of suicides in Greece: an applied time-series analysis. Dialogues in Clinical Neuroscience & Mental Health 2, 1–11. Vyssoki B, Praschak-Rieder N, Sonneck G, Blüml V, Willeit M, Kasper S and Kapusta ND (2012) Effects of sunshine on suicide rates. Comprehensive Psychiatry 53, 535–539.
Woo JM, Okusaga O and Postolache TT(2012) Seasonality of suicidal behav-ior. International Journal of Environmental Research and Public Health 9, 531–547.
World Health Organization(2016) Global Health Observatory data repository. Available from: https://apps.who.int/gho/data/node.main.MHSUICIDE. Accessed 18 June 2020.
World Health Organization (2018) National suicide prevention strategies; progress, examples, and indicators. Available from: https://www.who.int/ mental_health/suicide-prevention/national_strategies_2019/en. Accessed 18 June 2020.
Yang CT, Yip PS, Cha ES and Zhang Y(2019) Seasonal changes in suicide in South Korea, 1991 to 2015. PLoS ONE 14, e0219048.
Yip PS, Chao A and Chiu CW(2000) Seasonal variation in suicides: dimin-ished or vandimin-ished. Experience from England and Wales, 1982–1996. British Journal of Psychiatry 177, 366–369.