저작자표시-비영리-변경금지 2.0 대한민국 이용자는 아래의 조건을 따르는 경우에 한하여 자유롭게 l 이 저작물을 복제, 배포, 전송, 전시, 공연 및 방송할 수 있습니다. 다음과 같은 조건을 따라야 합니다: l 귀하는, 이 저작물의 재이용이나 배포의 경우, 이 저작물에 적용된 이용허락조건 을 명확하게 나타내어야 합니다. l 저작권자로부터 별도의 허가를 받으면 이러한 조건들은 적용되지 않습니다. 저작권법에 따른 이용자의 권리는 위의 내용에 의하여 영향을 받지 않습니다. 이것은 이용허락규약(Legal Code)을 이해하기 쉽게 요약한 것입니다. Disclaimer 저작자표시. 귀하는 원저작자를 표시하여야 합니다. 비영리. 귀하는 이 저작물을 영리 목적으로 이용할 수 없습니다. 변경금지. 귀하는 이 저작물을 개작, 변형 또는 가공할 수 없습니다.
BTG2-enhanced cancer cell death is mediated by
downregulating mRNA stability of Bcl-XL via
interaction with hnRNP C and CNOT7
by
Yong Won Choi
Major in Cancer Biology
Department of Biomedical Sciences
The Graduate School, Ajou University
BTG2-enhanced cancer cell death is mediated by
downregulating mRNA stability of Bcl-XL via
interaction with hnRNP C and CNOT7
by
Yong Won Choi
A dissertation submitted to The Graduate School of Ajou
University in Partial Fulfillment of the Requirements for
the Degree of Ph.D. in Biomedical Sciences
Supervised by
In Kyoung Lim, M.D., Ph.D.
Major in Cancer Biology
Department of Biomedical Sciences
The Graduate School, Ajou University
Acknowledgements
This work was supported by grants from the Korea Health Technology R&D Project through the Korea Health Industry Development Institute (KHIDI), funded by the Ministry of Health & Welfare (HI14C1967) to Yong Won Choi. The funder did not have any role in the design and conduct of the study, the analysis and interpretation of the data, decision to publish, and preparation of the manuscript.
i
-ABSTRACT-BTG2-enhanced cancer cell death is mediated by downregulating mRNA
stability of Bcl-XL via interaction with hnRNP C and CNOT7
BTG2, as a founding member of anti-proliferative gene family, has been reported to render cancer cells more sensitive to chemotherapy and radiotherapy. Recent study suggested that BTG2 can activate general mRNA deadenylation and degradation as a binding partner of mRNA deadenylase, CNOT7. However, molecular mechanism of cell death regulation has not yet been fully elucidated in terms of mRNA stability regulation of BTG2. Therefore, the mechanism of enhanced cell death by BTG2 and its clinical significance were investigated. Among anti-apoptotic genes including Bcl-2, Bcl-XL, and Mcl-1, mRNA stability of Bcl-XL was reduced by BTG2. By protein chip array, HnRNP C, mRNA binding protein, was discovered as new interacting protein of BTG2. In vivo binding of BTG2 and HnRNP C was validated by immunoprecipitation. The binding of HnRNP C to 3' UTR of Bcl-XL mRNA was also confirmed by RNA immunoprecipitation and pull down assay of biotin labeled RNA. The decreased mRNA stability of Bcl-XL and enhanced cell death after cisplatin treatment by BTG2 were not observed in BTG2 mutant defective in CNOT7 binding. There results suggested that BTG2-CNOT7 complex can bind to 3' UTR of Bcl-XL mRNA by hnRNP C and decrease Bcl-XL mRNA stability with enhancing cell death. Similar to the results of cell culture experiments, response of platinum-based chemotherapy and progression-free and overall survival were better in advanced lung squamous cell carcinoma patients with high BTG2 expression. In conclusion, these results indicated that BTG2 can augment chemotherapy-induced cancer cell death by regulation of Bcl-XL mRNA stability via mediating interaction of hnRNP C-3' UTR of Bcl-XL and mRNA deadenlyase, CNOT7.
ii
TABLE OF CONTENTS
ABSTRACT ... i
TABLE OF CONTENTS ... ii
LIST OF FIGURES ... iv
LIST OF TABLES ... v
ABBREVIATION ... vi
I. INTRODUCTION ... 1
1.1.
Discovery and tissues expression of BTG2... 1
1.2 Regulation of BTG2 ... 1
1.3. Biological functions of BTG2 response ... 2
1.4. Molecular functions of BTG2 ... 4
1.5. Aim of the study ... 5
II. MATERIALS AND METHOD ... 6
2.1. Cells and reagents. ... 6
2.2. Preparation and transduction of adenoviruses ... 6
2.3. Reverse transcriptional and real-time PCR analysis ... 6
2.4. Western blot and immunoprecipitation (IP) analyses ... 6
2.5. Knockdown of BTG2 using siRNA ... 6
2.6. Construction of BTG2 and CNOT7 overexpressing plasmids and site-directed
mutagenesis ... 7
2.7. Immunoprecipitation of RNP complexes and RT-PCR. ... 7
2.8. Synthesis of Biotinylated Transcripts and Biotin pull-down assays ... 7
2.9. Measurement of cell viability ... 8
2.10. Immunohistochemical staining for BTG2 ... 8
iii
2.12. Public database analysis ... 9
2.13. Statistical analysis ... 9
2.14. BTG2 interaction proteins screening with protein chip array ... 10
III. RESULTS ... 11
3.1. BTG2 regulates mRNA and protein level of anti-apoptotic protein, Bcl-XL ... 11
3.2. BTG2 regulates mRNA stability of Bcl-XL... 16
3.3. BTG2 interacts with CNOT7 and hnRNP C ... 20
3.4. HnRNP C interacts with 3’-UTR of Bcl-XL mRNA ... 25
3.5. mRNA downregulation of Bcl-XL is dependent on interaction between BTG2 and
CNOT7 ... 28
3.6. BTG2 enhances cell death through the regulation of Bcl-XL ... 31
3.7. High BTG2 expression was associated with favorable platinum-based chemotherapy
response and prognosis in advanced squamous carcinoma of lung ... 37
IV. DISCUSSION ... 48
REFERENCE ... 52
iv
LIST OF FIGURES
Figure 1.BTG2 decreases mRNA and protein level of anti-apoptotic protein, Bcl-XL. ... 12
Figure S1. Gene expression data of microarray from liver tissue of TIS21 wild type and
knock out mouse. ... 15
Figure S2. Comparison of mRNA stability between LacZ and BTG2 overexpressed HeLa
cells. ... 15
Figure 2. BTG2 downregulates mRNA stability of Bcl-XL. ... 17
Figure S3. Regulation of Bcl-xL mRNA stability by BTG2 is not dependent on PRMT1. .... 21
Figure 3. BTG2 interacts with CNOT7 and hnRNP C. ... 13
Figure 4. HnRNPC interacts with Bcl-XL mRNA 3’-UTR ... 26
Figure 5. mRNA downregulation of Bcl-XL is dependent on interaction between BTG2 and
CNOT7 ... 29
Figure 6. BTG2 enhances cisplatin-induced cancer cell death. ... 35
Figure S4. BTG2 mRNA level according to chemotherapy sensitivity from gene expression
data of 30 cancer cell lines. ... 35
Figure S5. BTG2 and Bcl-XL expression after oxaliplatin treatment in several gastric cancer
cell lines. ... 35
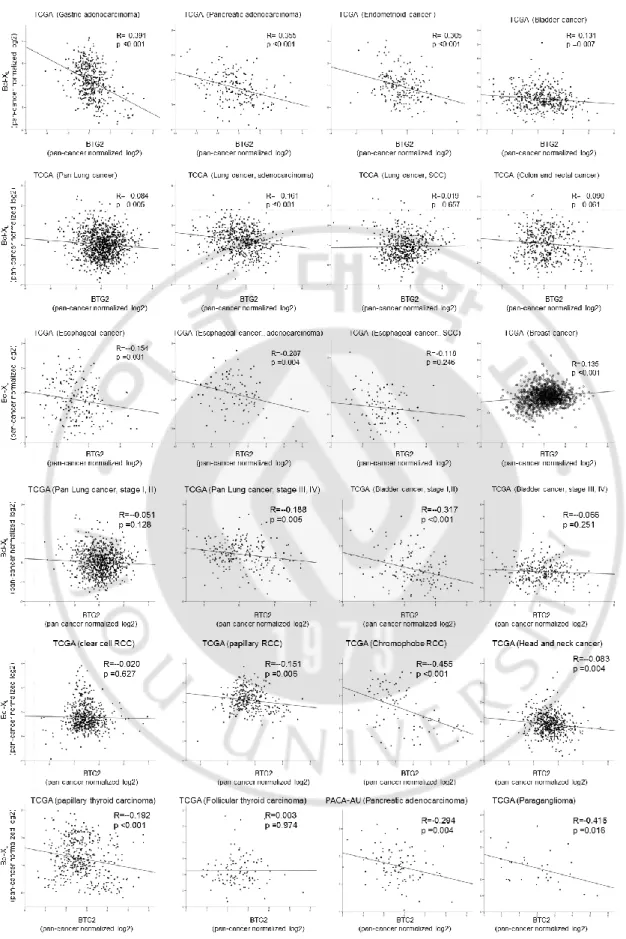
Figure S6. Expression pattern of BTG2 and Bcl-XL mRNA in TCGA database. ... 36
Figure S7. BTG2 expression in various normal and cancer tissue by immunohistochemistry.
... 37
Figure 7. BTG2 expression measured by immunohistochemistry in advanced squamous lung
cancer treated with platinum-based doublet chemotherapy and H-score according to therapy
response... 39
Figure 8. Progression-free and overall survival according to the BTG2 expression. ... 42
Figure 9. Proposal function of BTG2 in cancer cell death via regulating Bcl-XL mRNA
stability through mRNA binding protein hnRNP C. ... 43
Figure S8. BTG2 and BTG1 mRNA expression pattern in cancer and paired normal tissue
from TCGA database. ... 44
v
LIST OF TABLES
Table 1. Patients characteristics according to the BTG2 expression ... 44
Table 2. Univariate analysis of progression-free and overall survival for all patients from the
start of first-line chemotherapy ... 45
Table 3. Multivariate analysis of progression-free and overall survival for all patients from
the start of first-line chemotherapy ... 46
vi
ABBREVIATION
BTG: B-cell Translocation Gene TPA: tetradecanoyl phorbol acetate- Tob: Transducer of ErbB-2
PRMT1: protein arginine methyltransferase 1 SCF: Skp1-Cdc53/Cullin 1-F-box protein RIP: RNA immunoprecipitation
TCGA: the Cancer Genome Atlas UTR: untranslated region
1
1. INTRODUCTION
1.1. Discovery and tissues expression of BTG2
B-cell Translocation Gene (BTG) 2 is the firstly identified and founding member of the anti-proliferative gene (APRO) family includes six different genes TOB1, TOB2, BTG1, BTG2/TIS21/PC3, BTG3 and BTG4 in vertebrates. BTG2/TIS21/PC3 is orthologs of human, mouse, and rat, respectively [1]. The PC3 gene was isolated as an immediate early gene induced by nerve growth factor during neuronal differentiation rat PC12 cell line [2] and TIS21 was discovered as tetradecanoyl phorbol acetate (TPA), a tumor-promoting agent, induced gene in mouse NIH3T3 cell line [3]. In 1996, the human BTG2 gene was cloned and localized chromosomal segment 1q32 containing two exons, one intron, along with its function of cell cycle regulation upon DNA damage in p53-dependent manner [4]. Box A has been studied as a major role for cell proliferation, while box B interacts with many target proteins. Box C was also reported as important domain for interacting with protein arginine methyltransferase 1 (PRMT1) [5].
In mouse organs, TIS21 mRNA expression is the most abundant in thymus, lung, spleen and stomach. Heart, brain, kidney and testes are the lesser expressing organs, and liver and skeletal muscle are the least expressing organs. When the level of BTG2/TIS21 expression was more carefully analyzed in human tissues and cells, the level of BTG2 expression was highest in proximal tubular epithelium of kidney, alveolar bronchial epithelium in lung, and the basal cell layer of prostate acini [6]. The level of BTG2 expression was modest in the mucosal epithelium of the intestine, and in the acinar cells of breast and pancreas and was low in neurons, hepatocytes, zona granulosa of ovary, round spermatids and thyroid follicles [6].
1.2. Regulation of BTG2
As mentioned earlier, BTG2 was isolated as an immediate early gene induced by nerve growth factor [2] and TPA [3]. TPA-induced BTG2 mRNA is rapid and transient, and superinduced by cycloheximide treatment [3]. In addition to TPA, forskolin, epidermal growth factor, and serum, despite the absence of a consensus serum response element induced the expression of luciferase reporter construct containing a 460-nucleotide fragment of the BTG2 promoter. Following DNA damage, BTG2 expression is stimulated by p53 and is also upregulated by oxidative stress via ΝFκΒ pathway, which is independent of p53 status. In post transcriptional regulation, BTG2 has been demonstrated as one of targets of famous onco-miR21 in prostate cancer cells [7], laryngeal cancer cells [8], melanoma cells [9], and lung cancer cells [10]. A recent study showed that 21, miR-23A and miR-27A cooperatively regulate the expression of tumor suppressor genes, including PDCD4, BTG2 and NEDD4L in pancreatic cancer [11] and the overexpression of androgen-mediated miR-32 results in the reduction of BTG2 in castration-resistant prostate cancer [12]. In addition,
2
overexpression of miR-18 negatively regulates the BTG2 expression n hepatocellular cancer cells [13] and BTG2 is direct targets of miR-132 in the mouse suprachiasmatic nucleus [14]. BTG2 protein stability is regulated via the ubiquitin-proteasome pathway and, likewise another cell cycle regulatory proteins and Skp1-Cdc53/Cullin 1-F-box protein (SCF) complex with E3 ubiquitin ligases, βTrCP [15] and Skp2 [16] were found as the major ubiquitin ligases of BTG2.
1.3. Biological functions of BTG2 1.3.1. Anti-proliferation
As a member of APRO gene family, several evidences suggest that major role of BTG2 is negative control of the cell cycle. In various models, BTG2 showed strong expression in the phases G0/G1 of quiescence of the cell cycle. Overextension of BTG2 induces the cell cycle arrest in the G0-G1 phase in normal fibroblasts, NIH3T3 cells [17], mouse embryo fibroblasts and embryonic stem cells [4, 18], granulosa cells of the ovary [19], or breast [20] and prostate cancer cells, and this G0-G1 phase arrest is due to inhibition of cyclin D1 expression and of the activity of Cdk4/cyclin D1 complexes on pRb [17]. In human embryonic kidney 293 cells, pRb-independent inhibition of the G1/S phase has been discovered via involving the reduction of cyclin E synthesis and cdk4 activity [21]. Moreover, the inhibition of the G2/M phase of the cell cycle was observed in DNA-damaged mouse embryonic stem cells [4], in monocyte cells [22]. G2/M arrest induced by BTG2 overexpression correlates with inhibiting cyclin B1-Cdc2 binding [23] in U937 monocytic tumor cells and disrupting cyclin B1-cdk1 activity in transformed hepatocytes [24]. Several mechanisms were suggested the molecular mechanism of BTG2 mediated cell cycle inhibition. Since BTG2 has no catalytic activity itself, molecular function of BTG2 can be explained by the function of interacting proteins. Among these interacting proteins, Caf1a (CNOT7) and Caf1b (CNOT8) deadenylase subunits are suggested as major role for mediating anti-proliferative activity of BTG2 and TOB protein [25]. However, further study is required to answer whether another known binding proteins such as PRMT1. Hoxb9, Pin1, and so on, have also major role as Caf1 for anti-proliferative function of BTG2.
1.3.2. Regulation of cell death
When apoptosis was induced by NGF deprivation neuronal PC12 cells, BTG2, together with c-jun, is the most rapidly and persistently induced primary response gene and overexpression of BTG2 prevents apoptosis [26]. BTG2 -/- embryonic stem cell showed decreased cell cycle arrest and increased apoptosis after adriamycin treatment [4]. In hippocampal neurons, BTG2 was identified to contribute to synaptic NMDAR-dependent neuroprotection after NMDA receptor activation [27] and stereotaxic delivery of activity-regulated Inhibitor of death (AID) genes including BTG2 to the
3
hippocampus by recombinant adeno-associated viruses showed protection in vivo against seizure-induced brain damage [28]. While overexpression of BTG2 does not cause apoptosis in NIH3T3 cells [29], BTG1, which shows increased expression in apoptotic cells in macrophage-rich areas of advanced atherosclerotic lesions of the hyperlipidemia animal model, induce apoptosis in NIH3T3 cells following overexpression [30]. However, BTG2 has been suggested to contribute cell death under unrepairable damage status. BTG2 augmented EGF-induced U937 cell death [31], adriamycin-induced HeLa cell death [32], H2O2-adriamycin-induced cardiomyoblast cell death [33]. Moreover, during the formation of free digits in the developing limbs, BTG2 induces oxidative stress, arrest of cell cycle progression, senescence and caspase-mediated apoptosis in the regressing interdigits [34]. Overexpressed BTG2 showed shifting p53-mediated EJ cell senescence to cell death [35]. In addition, C-reactive protein (CRP)-induced apoptosis of monocytes was not observed in monocyte from BTG2-knockout male C57BL/6 mice even though p53 activation was occurred after CRP treatment [22]. Nonetheless, the mechanism of enhanced cell death by BTG2 has not been fully elucidated.
1.3.3. Tumor suppressor
In agreement with anti-proliferative activity, loss of expression of BTG2 is frequently observed in clinical samples of various cancers, including lung, thyroid and breast tumours, laryngeal cancer [8], pancreatic cancer, clear cell renal cell carcinomas [36]. In breast cancer, low expression of BTG2 is related to increased tumor size, grade, metastasis, recurrence and poor survival in several datasets [37]. BTG2 overexpressed breast cancer cell line MCF-7 showed increased sensitivity to ionizing radiation, increased apoptosis alongside decreased expression of cyclins D1 and B1, Ku70, FEN-1, and XRCC1 as well as increased BAX expression [38]. In highly invasive breast cancer cell line MDA-MB 213, BTG2 inhibits invadopodia formation by downregulating reactive oxygen species and [39] and inhibits invasion [40]. In patient-derived xenograft (PDX) models of triple-negative breast cancer, BTG2 loss by p53 mutation enhances metastatic potential by promoting tumor growth in primary and metastatic sites [41]. In TCGA cohort including 998 patients data, adverse prognosis of low BTG2 expression in breast cancer was revalidated with decreased overall survival and metastasis-free survival [41]. BTG2 inhibited the proliferation and invasion of gastric cancer cells [42] and promote apoptosis in pancreatic cancer cells and inhibits invasion of lung cancer cells by decreasing expression of cyclin D1, MMP-1, and MMP-2 [43]. BTG2 -/- mouse is more sensitive to chemical induced hepatocellular carcinogenesis. In addition, whole-exome sequencing revealed that frequent mutations in the BTG1 and BTG2 genes in diffuse large B-cell lymphoma [55]. However, one study showed that BTG2 promotes bladder cancer cell migration [44]. In that study, high expression of BTG2 in bladder cancer tissue is associated poor survival. Therefore, further delicate studies should be performed to understand tumor suppressive function of BTG2 in the context of understanding
4
molecular mechanisms.
1.4. Molecular functions of BTG2
BTG2, along with another ARPO gene family, has no discovered intrinsic enzymatic activity. The presence of conserved protein interaction domains suggests that BTG2 has a role as an adaptor or a cofactor molecule. Therefore, searching the interacting partners and studying the molecular function of them is crucial for understanding molecular mechanism of BTG2 function. By yeast two-hybrid screen, protein arginine methyl transferase 1 (PRMT1), a ubiquitous enzyme able to methylate arginine residues of a variety of substrates was discovered as binding partner of BTG1 and BTG2 and its methyl transferase activity was increased by BTG1 and BTG2 [45]. PRMT1, first identified as an interaction partner of BTG2, accounts for about 85% of the type I PRMT activity in mammalian cells and modulates the activity of its substrates , such as heterogeneous ribonucleoproteins involved in RNA processing, PP2A, interferon and cytokine receptors, and histones [46, 47]. PRMT1 was suggested important mediator in BTG2 induced neuronal cell differentiation [5]. However, in terms of ant-proliferative and tumor suppressive function of BTG2, further research is needed to determine whether PRMT1 is an important mediator of BTG2 function. In recent study, BTG2 and PRMT1 are critical components of the pre-B cell differentiation program in BTG2 -/- and B-cell- specific PRMT1 -/- mouse. PRMT1 methylated cyclin-dependent kinase 4 (CDK4), preventing the formation of a CDK4-Cyclin-D3 complex cell cycle progression for pre-B cell differentiation and cell cycle arrest for pre-B cell differentiation was not observed in BTG2∆BoxC, which has defective with interacting PRMT1. Although, these observations were performed only in B cell, it will be interesting for validating whether these results can be expanded to explain the ant-proliferative and tumor suppressive function of BTG2 in epithelial cells.
Another important interacting protein is the CAF1, deadenylase subunits of the Ccr4-Not complex. In vertebrates, two CAF1 paralogues, CNOT7 (Caf1 a) and CNOT8 (Caf1 b) [48]. Deadenylation is precisely controlled, and is a prevailing mechanism to destabilize mRNA and thus to modulate gene expression [49]. Except for BTG4, all APRO famliy proteins can interact with CNOT7 and/or CNOT8 [50]. BTG2 and Tob1 promote mRNA deadenylation during mRNA turnover. In the case of Tob1 and Tob2, a PAM2 motif in their C-terminal regions was discovered as interacting domain with the poly(A)-binding protein PAPBC1 [50]. Furthermore, in recent study, BTG2 interacts with cytoplasmic poly(A) binding protein (PABPC)1 and stimulates CAF1 deadenylase activity in vitro in the absence of other CCR4–NOT complex subunits [51]. Interestingly, in this study, box C domain, known interacting domain with PRMT1, is also important site for interacting with PABPC1. BoxC-mutated BTG2 does not interact with PABPC1 RRMs but still interacts with CAF1 and PRMT1 did not stimulate mRNA deadenylation and did not show the anti-proliferative activity of BTG2 [51].
5
Nonetheless, to delineate how the regulation of general mRNA deadenylation processing by BTG2 leads anti-proliferative phenotype and whether BTG2-CAF1 complex can explain all aspects of tumor suppressive function of BTG2, further studies have to be followed.
1.5. Aim of the study
In previous study, we reported that BTG2 can enhance H2O2-induced cardiomyoblast necrotic cell death [33]. Although it has been reported that BTG2 expressed cancer cells are more sensitive to chemotherapy and radiotherapy, its molecular mechanism has not yet been fully elucidated. Therefore, in this study, we tried to investigate enhanced cell death mechanism by BTG2 and analyze its clinical significance in tumor sample and clinical data of lung cancer patients treated with chemotherapy.
6
2. MATERIALS AND METHODS
2.1. Cells and reagents.
HeLa, MCF7, A549, and 293T cells were grown in DMEM and MDA-MB-231 in RPMI-1640 supplemented with 10% fetal bovine serum and 100 U/mL gentamycin at 37oC and 5% CO2. Actinomycin D and cisplatin were obtained from Sigma Chemical Co. (St Louis, MO).
2.2. Preparation and transduction of adenoviruses
Adenoviruses expressing BTG2 gene (Ad-BTG2-HA) and bacterial β-galactosidase (Ad-LacZ) were prepared in our laboratory [24], and indicated moi of Ad-BTG2 or Ad-LacZ were transduced to A549, MCF7, MDA-MB 213, and HeLa for 48 h.
2.3. Reverse transcriptional and real-time PCR analysis
Total cellular RNAs were extracted from cells with RNAiso Plus (Takara Inc., Kyoto, Japan) and dissolved in the diethylpyrocarbonate-treated water to quantify by UV scanning. First-strand cDNA was synthesized by reverse transcription reaction using oligo-dT primers from 1 μg of total cellular RNA using a PCR kit (Takara Inc). Glyceraldehyde 3-phosphate dehydrogenase was used as a control. Real-time PCR was carried out with Power SYBR Green PCR Master Mix (Bio-Rad, Hercules, CA, USA) using the following conditions: initial activation at 95 °C for 5 min, followed by 40 cycles of 95 °C for 15 s and 60 °C for 1 min. The primers used for real-time PCR were given in Supplementary Table.
2.4. Western blot and immunoprecipitation (IP) analyses
Western blot analyses were performed by standard method. Cell lysates (40 ug) prepared in RIPA buffer with phosphatase inhibitors were separated on SDS-PAGE before transfer to PVDF membrane (Millipore Corp). Blots were hybridized with primary antibodies and visualized by ECL system (Amersham Biosciences, Buckinghamshire, UK). The antibodies were purchased, anti-V5, Bcl-XL, Bcl2, and anti MCL from Cell signaling, PARP from Abcam, HA, anti-hnRNPC and anti--actin from Santa Cruz Biotechnology. For immunoprecipitation analysis, cells were broken by sonication in E1A buffer (50 mM HEPES pH 7.5, 150 mM NaCl, 0.1% NP-40, 5 mM EDTA, protease inhibitors), and the whole cell lysates (1 mg) were incubated with primary antibody overnight at 4 °C and the immunocomplexes were collected with protein G agarose slurry for 2 h at 4 °C before subjected to Western blot analysis.
7
To knockdown RNA expressions, cells (2 × 10⁵ per 60-mm dish) were incubated for 24h, and then transfected with siRNAs (50 nM) using RNAiMAX reagent (Invitrogen, Carlsbad, CA) according to the manufacturer's instructions. After 24-48 hours, the messenger RNA levels of each gene were analyzed by immunoblotting or reverse transcriptional and real-time PCR analyses. siRNA mixture of BTG2 comprised siBTG2 #1 (5′-gaaccgacaugcucccggauu-3), siBTG2 #2 (5′-gcauucgcaucaaccacaauu-3′), siBTG2 #3 (5′-ggucauagagcuaccguauuu-(5′-gcauucgcaucaaccacaauu-3′), siBTG2 #4 (5′-agacaaagguuacuaauuguu-(5′-gcauucgcaucaaccacaauu-3′), and siBTG2 #5 (5′-gagcuauuuauauauauuauu-3′).
2.6. Construction of BTG2 and CNOT7 overexpressing plasmids and site-directed mutagenesis
cDNAs encoding full length human BTG2, CNOT7 were generated by RT-PCR from RNAs extracted from 293T cells. Plasmids expressing wild type and mutant BTG2, CNOT7 were made by cloning the cDNAs into a pcDNA3-based HA-epitope or V5-epitope tagging vector, respectively. Mutations were introduced by sitedirected mutagenesis using the QuickChange Kit (Stratagene).
2.7. Immunoprecipitation of RNP complexes and RT-PCR.
Immunoprecipitation of endogenous RNA protein complexes was previously described [52]. Briefly, two million HeLa cells were crosslinked with 1% formaldehyde for 10 minutes at room temperature, whereupon glycine was added to stop the crosslinking reaction. The cells were then washed with PBS, resuspended in 1 ml RIPA buffer, and sonicated. The supernatant obtained after centrifugation was used for IP using either IgG1 or hnRNP C antibody for 1 h at room temperature. The beads were washed three times with 1 ml high-stringency RIPA buffer, resuspended in 100 μl elution buffer and kept at 70°C for 45 min to reverse the crosslinks. SDS-PAGE sample buffer was added to the supernatant obtained after reversal of crosslinks and proteins were subjected to SDS-PAGE and Western blotting using an anti-hnRNP C antibody.
2.8. Synthesis of Biotinylated Transcripts and Biotin pull-down assays
Biotin pull-down assays were performed as described [53] Briefly, for in vitro synthesis of biotinylated transcripts, reverse-transcribed total RNA was used as the template for PCR amplification using 5' oligonucleotides that contained the T7 RNA polymerase promoter sequence (T7, CCAAGCTTCTAATACGACTCACTATAGGGAGA). Oligonucleotide pairs (sense and antisense) used to synthesize DNA templates for the production of biotinylated transcripts were as follows for the 3’UTR of Bcl-XL, A: (T7)CCAGACACTGACCATCCACTCTAC and TCAATTCTGAGGCCACAAACAT , B: (T7)GTTTGTGGCCTCAGAATTGA and ATAGCTCCCTTTCACCTCAG , C: (T7)AGGTGAAAGGGAGC-TATCAGGA and CTAGTCTCAAATATGTACAGCAGAG , D: (T7)GCTGTACATATTTGAGACTAG and
8
CACTGAGTAAACACAGTTTATT; for the 3’UTR of GAPDH, (T7)CCTCAA CGACCACTTTGTCA and GGTTGAGCACAGGGTA CTTTATT. PCR-amplified products were used as templates for the synthesis of the corresponding biotinylated RNAs using T7 RNA polymerase and biotin-CTP. Biotin pulldown assays were carried out by incubating whole-cell lysates with purified biotinylated transcripts (25 μg lysate, 1 μg RNA) for 1 h at 25 °C. Complexes were isolated with paramagnetic streptavidin-conjugated Dynabeads (Dynal, Oslo, Norway), and bound proteins in the pulldown material were analyzed by Western blotting using monoclonal antibodies for hnRNP C.
2.9. Measurement of cell viability.
Cell viability after various treatments for indicated times was assessed by trypan blue dye exclusion (Sigma-Aldrich). For the assay, 4 x 10⁴ cells were plated in 12-well plates and treated with chemicals the next day. Cells were trypsinized and mixed with 0.4% trypan blue (1:1). Percentage of viable cells represents the number of unstained cells/number of total cells x 100.
2.10. Immunohistochemical staining for BTG2
Paraffin-embedded cancer tissues obtained at the time of initial diagnosis were used for all patients. Sections were deparaffinized in xylene and rehydrated in graded alcohols and water. For antigen retrieval, specimens were exposed to 10 mM citrate buffer (pH 6.0) and heated for 15 min in a water bath (120 °C). Endogenous peroxidase activity was blocked by treatment with 3% hydrogen peroxide for 10 min. Sections were treated with protein-blocking solution and then with primary antibodies overnight at 4 °C. Primary antibodies were rabbit anti-human polyclonal antibodies against BTG2 (dilution, 1:50, GeneTex, Irvine, CA, USA). After several rinses in phosphate-buffered saline, the sections were incubated in the biotinylated secondary antibody. Bound antibodies were detected by the streptavidin–biotin method with a Cap-Plus detection kit (Zymed Laboratories Inc., San Francisco, CA, USA). Slides were rinsed in phosphate-buffered saline, exposed to diaminobenzidine, and counterstained with Mayer’s hematoxylin.
Negative controls for these proteins were made by the omission of the primary antibody during the process of immunohistochemical staining. For a positive control for BTG2, human brain tissue was used. The slides were examined independently by two observers (J.H. Kim, J.H. Han) blinded to both clinical and pathologic data. In case of disagreement, final grading was determined by consensus. Expression of the proteins was quantified using a visual grading system based on the extent of staining (percentage of positive tumor cells; graded on a scale of 0 to 3: 0, none; 1, 1-29%; 2, 30-60%; 3, >60%) and the intensity of staining (graded on a scale of 0 to 3: 0, no staining; 1, weak staining; 2, moderate staining; 3, strong staining). A semi-quantitative H-score was obtained by multiplying the
9
grades of extent and intensity of staining. The median value of all the H-scores was chosen a priori as the cut off value for dividing the expression of the proteins into high and low.
2.11. Patients and clinical review
All patients with advanced non-small cell lung cancer (NSCLC) who initiated first-line platinum-based doublet palliative chemotherapy between January 2002 and December 2016 at our institution were retrospectively identified. The criteria for eligibility were histologically or cytologically documented squamous cell carcinoma of lung, either stage IV according to the 7th edition of the American Joint Committee on Cancer (AJCC) [54] or stage IIIB/recurrent disease unsuitable for definitive local therapy. Patients with locally advanced or recurrent NSCLC who underwent palliative chemotherapy due to progression after initial definitive chemoradiotherapy or radiotherapy were excluded.
A retrospective review of the clinical information of eligible patients was performed. Data on the patients including patient characteristics (age, gender, smoking history, performance status (PS) based on the Eastern Cooperative Oncology Group (ECOG) performance scale, histology, clinical stage at diagnosis), chemotherapy regimen, objective response according to the Response Evaluation Criteria in Solid Tumors criteria [55], and survival information were collected. This research protocol was approved by the Institutional Review Board of Ajou University Hospital (AJIRB-MED-KSP-17-385).
2.12. Public database analysis
Oncomine (http://www.oncomine.org), an online microarray database, was used to analyze the mRNA expression differences of BTG2 between tumor of resistant or sensitive to cisplatin, 5-FU, and etoposide. TCGA data of BTG2 and Bcl-XL expression were downloaded from the TCGA database
2.13. Statistical analysis
Numerical data were presented as mean±SD of the independent determinations. Independent t-test or ANOVA was applied, and multiple comparisons were evaluated by Tukey HSD. P values less than 0.05 were considered as significant. A comparison of the characteristics of patients was evaluated using Fisher’s exact test. Progression-free survival (PFS) and Overall survival (OS) was calculated using the Kaplan–Meier method. PFS was defined as the time from the date of starting chemotherapy to tumor progression or death from any cause. OS was defined as the time from the date of starting chemotherapy to death; data on the survivors were censored at the last follow-up. The differences among the survival curves were tested using the log-rank test. The Cox proportional hazards regression model was used to determine the joint effects of several variables on survival. All factors in the univariate analysis were included in the Cox proportional hazards regression model. All statistical
10
analyses were performed two-sided using SPSS for Windows 21.0.
2.14. BTG2 interaction proteins screening with protein chip array
The HuProt Human Proteome Microarray was purchased from CDI laboratories (http://www.cdi-lab.com). The Chip includes 16,368 unique full-length humanrecombinant proteins in duplicate along with several control proteins such as IgG, GST, BSA-biotin, and histones as previously described [56]. Human cDNA of BTG2 was subclonned into various GST-V5-HIS fusion vectors and purified, Purified hBTG2 proteins were applied to human protein microarray and hBTG2 interacting proteins were detected by using Alexa-Fluor 488 conjugated V5 antibody(Invitrogen, Carlsbad, CA). V5 antibody alone was used as control. Briefly, the protein chip was first incubated with blocking buffer (5% BSA in PBS with 0.05% (v/v) Tween 20) for 30 minutes at room temperature and V5-His-hBTG2 or V5 antibody were further incubated under the lifterslip (Thermo scientific, USA) for 1 hour at room temperature. After washing three times with 1x PBS containing 0.05% Tween 20 by gentle shaking for 10 min each, the microarray was incubated with Alexa-Fluor conjugated antibody. Subsequently, the microarray was washed three times and then the values of probe signal were obtained using a GenePix Pro 6.0 software (Molecular Devices, Sunnyvale, CA).
11
3. RESULTS
3.1. BTG2 regulates mRNA and protein level of anti-apoptotic protein, Bcl-XL
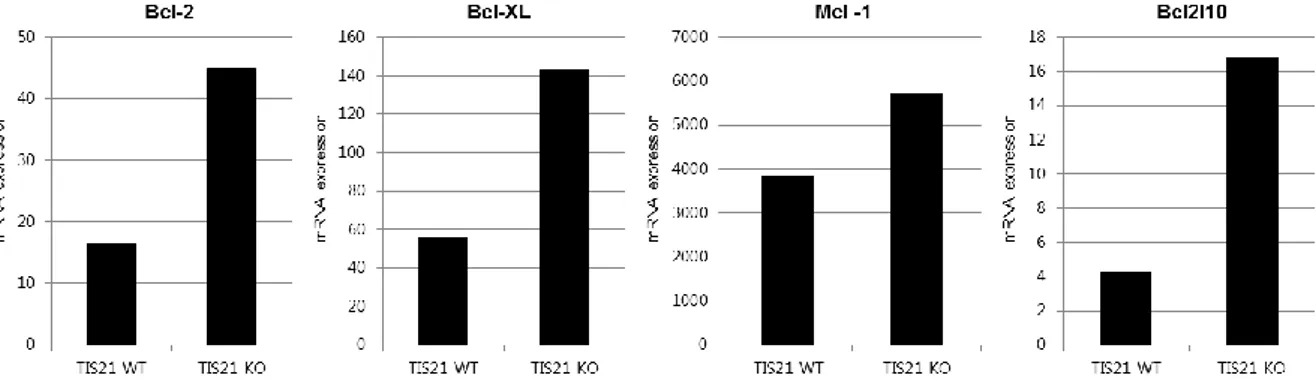
To investigate the possibility that BTG2, as a binding partner of mRNA deadenylase, CAF1, can influence cell viability by regulating mRNA stability of anti-apoptotic proteins, the basal level of mRNA of Bcl-2, Bcl-XL and MCL1 was observed after overexpression of BTG2 in several cancer cell lines. In A549, lung carcinoma cell line, decreased basal levels of Bcl-2, Bcl-XL and MCL1 was observed after BTG2 overexpression. However, in BTG2-overexpressed other cell lines, depression of Bcl-2 and MCL1 mRNA was not consistently observed. After all, only the decrease of Bcl-XL mRNA was consistently observed in all investigated cell lines after BTG2 expression (Figure 1A). To exclude the possibility of decreased transcription of Bcl-XL as a mechanism of decreased Bcl-XL mRNA level in overexpressed cells, the level of pre-mRNA was compared between control and BTG2-overexpressed cells. As expected, the significant difference was not observed in the level of BCL-XL pre-mRNA (Figure 1B). After transcription, alternative splicing of pre-mRNA of Bcl-XL produces short or long form mRNA, so called Bcl-XS and Bcl-XL, respectively and it was already reported that the alternative splicing toward producing more Bcl-XS along with decreased Bcl-XL can induce the loss of cell viability [57]. However, by observing the decrease of both long and short form of Bcl-X (Figure 1C), we can verify that BTG2 has no significant influence on alternative splicing process in this experiment setting. Although, along with decrease of Bcl-2 or MCL1 mRNA levels, in some cell lines, the decreased protein level of Bcl-2 or MCL1 was observed, decreased protein level of Bcl-XL was consistently confirmed by western blot analysis in all those cell lines after 48 hours of BTG2 overexpression (Figure 1D). In addition, the increased level of BCL-XL mRNA was observed in liver tissue from BTG2/TIS21-knock out mouse, along with increased other anti-apoptotic genes, Bcl2, MCL1 and BCL2L10 Figure S1. Taken together, these results indicated that BTG2 can regulate mRNA level of Bcl-XL not by transcriptional but by post transcriptional level.
14
Figure 1.BTG2 decreases mRNA and protein level of anti-apoptotic protein, Bcl-XL.
(A) mRNA level of Bcl2, Bcl-XL, MCL1 in BTG2 overexpressed cancer cells. RNA from cells infected with Ad-BTG2 or Ad-LacZ for 48 hours was subjected to quantitative real-time PCR with their specific primers of Bcl2, Bcl-XL, MCL1 and GAPDH. mRNA expressions were normalized to that of GAPDH. Note statistically significant decrease of Bcl-Xl mRNA in BTG2 overexpressed cancer cells. (B) Comparison of Bcl-X enogenous pre-mRNA in LacZ and BTG2 overexpressed cancer cells. Note no significant difference of Bcl-X pre-mRNA level in three different cancer cell lines after BTG2 overexpression in contrast to the level of mature Bcl-XL mRNA. (C) mRNA level of Bcl-XL and Bcl-XS in BTG2 overexpressed cancer cells. Similar degree of decrease of Bcl-XL and Bcl-XS was observed in BTG2 overexpressed A549 cells. (D) Immunoblot analysis of Bcl2, Bcl-XL, MCL1 protein level in BTG2 overexpressed cancer cells. Note significant decrease of Bcl-XL protein in agreement with the decrease in Bcl-XL mRNA in BTG2 overexpressed cancer cells.
15
Figure S1. Gene expression data of microarray from liver tissue of TIS21 wild type and knock out mouse.
16
3.2. BTG2 regulates mRNA stability of Bcl-XL
To prove the mechanism that BTG2 can reduce mRNA of Bcl-XL, not by regulation of transcription or splicing process, but by regulation of mRNA stability, remaining mRNA of Bcl-XL was compared between control and BTG2-overexpressed cell lines after blocking further transcription by actinomycin D treatment. In three different BTG2-overexpressed cancer cell lines, statistically significant decrease of mRNA was observed after actinomycin D treatment only in Bcl-XL, not in Bcl2 or MCL1 (Figure 2A). It was reported that prolonged treatment of actinomycin D as a chemotherapeutic agent can decrease cell viability [58]. As expected, increased loss of cell viability was observed in BTG2 overexpressed cancer cells after 12hr treatment of acinomycin D (Figure 2B). Increased apoptotic cell death is anticipated when Bcl-XL, as anti-apoptotic protein, is decreased. Morphological feature of dead cells and increased cleaved PARP along with decreased Bcl-XL expression suggested increased apoptotic cell death in BTG2 overexpressed cell treated with acinomycin D. Although it was reported that basal BTG2 expression is relatively low in cancer tissues and cell lines compared normal tissues or cell lines, cancer cell lines still express variable level of BTG2. Therefore, endogenous BTG2 was knocked down with BTG2 siRNA in Hele cells, expressing relatively high level of BTG2 among investigated cancer cell lines (Figure 2C). When BTG2 was knocked down, basal level of Bcl-XL mRNA (Figure 2C) and mRNA stability of Bcl-XL measured by real-time PCR after acinomycin D treatment were increased (Figure 2D). Together, these data suggest that BTG2 can reduce the expression of Bcl-XL and promote cell death, when proper stimulation was applied, by down-regulating mRNA stability of Bcl-XL.
19
Figure 2. BTG2 downregulates mRNA stability of Bcl-XL.
(A) mRNA stability of Bcl2, Bcl-XL, MCL1 in BTG2 overexpressed cancer cells. After actinomycin D (5ug/m) treatment, RNA from cells infected with Ad-BTG2 or Ad-LacZ was subjected to
quantitative real-time PCR with their specific primers of Bcl2, Bcl-XL, MCL1 and GAPDH. mRNA expressions were normalized to that of GAPDH. Note decreased mRNA stability was observed only in Bcl-XL. (B) Cell death after actinomycin D treatment. Significant apoptotic cell death was observed along with a decrease in Bcl-XL protein in BTG2 overexpressed cells. (C) Increased Bcl-XL mRNA after BTG2 knock down. Note significant upregulation of Bcl-XL mRNA by knockdown of BTG2 in HeLa cells by transfection with siRNA-BTG2. (D) Comparison of Bcl-XL mRNA stability between siRNA-control and siRNA-BTG2 transfected HeLa cells after actinomycin D treatment. Note statistically significant increase of Bcl-XL mRNA stability in siRNA-BTG2 transfected HeLa cells.
20
3.3. BTG2 interacts with CNOT7 and hnRNP C
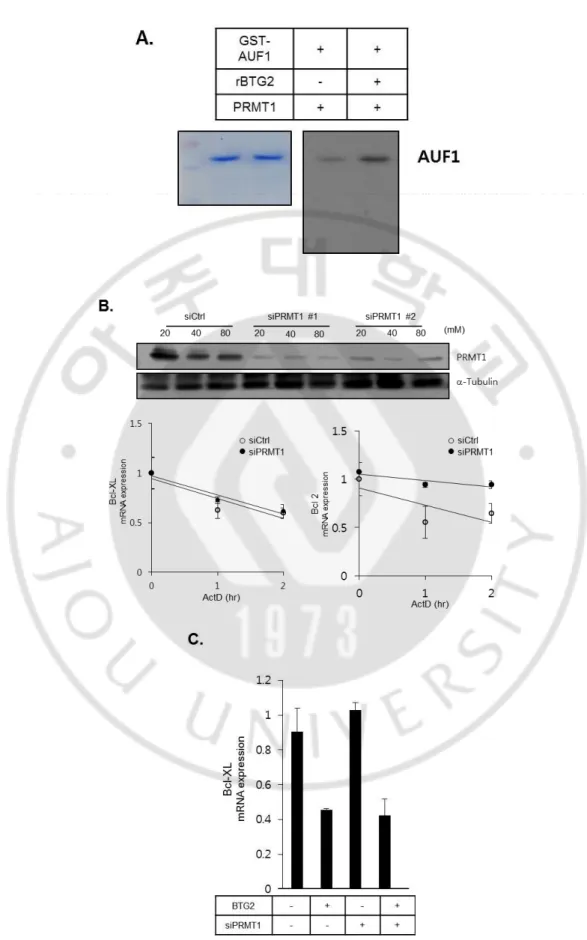
BTG2 has no known enzymatic activity itself. Thus, it was hypothesized that BTG2 might reduce mRNA stability of Bcl-XL by interacting with other proteins. PRMT1 as representative binding partner with BTG2, mediates methylation of arginine residue on several proteins including RNA binding proteins such as AUF1 (hnRNP D) and nucleolin, It is also reported that enzyme activity of PRMT1 can be regulated by BTG2 [59]. In fact, AUF1 is well known RNA binding protein as negative regulation of mRNA stability [60]. In vitro, increased methylation of GST-AUF by PRMT1 was observed when 1ug of recombinant BTG2 was co-incubated (Figure S3A.). However, when PRMT1 was efficiently knocked down by different kinds of siPRMT1s, no significant difference of Bcl-XL mRNA stability was observed (Figure S3B.) and decreased Bcl-XL mRNA after BTG2 overexpression was not recovered by siPRMT1 (Figure S3C.) In addition, the phenomenon of BTG2-mediating enhanced cell death was not reversed when PRMT1 was knocked down (data not shown). Together, these data suggested that regulation of Bcl-XL mRNA stability was not mediated by PRMT1.
21
22
CNOT7 (CAF1a),mRNAdeadenylase, is another well-known interacting partner of BTG/TOB family, and it was suggested that TOB can mediate recruitment of CNOT7 (CAF1a) to target mRNA directly interacting with PABP by PAM2 motifs located on C-terminal [61]. However, since BTG2 has no PAM2 motifs, it was hypothesized that unknown BTG2 interacting protein which has mRNA binding ability might mediate the interaction between BTG2 and target mRNA. According to a recent study, BTG2 can interacts with cytoplasmic poly(A) binding protein (PABPC)1 and stimulates CAF1 deadenylase activity [51]. To find out unknown BTG2 interacting proteins, in vitro binding assay using protein chip with recombinant BTG2 protein was performed and 210 BTG2 binding protein was discovered. As predicted, binding intensity score of CNOT7, known interacting protein was relatively high among other candidate proteins as expected (Figure 3A).
HnRNP C is a nuclear RNA-binding protein with roles in pre-mRNA splicing [62], mRNA stability [63], and translational modulation [64] with nascent mRNA transcripts. On literature searching, hnRNP C was identified as one of the proteins interacting to 3'UTR of Bcl-XL mRNA along with nucleolin, YB-1, and NF-AT, and only the role of nucleolin as stabilizing Bcl-XL mRNA in response to UAV irradiation was studied [65]. Thus, hnRNP C was selected for further investigation. To confirm the in vitro interaction between BTG2 and hnRNP C or CNOT7 observed in protein array result, immunoprecipitation assay was performed in 293T cell. Since the level of endogenous hnRNP C protein was relatively abundant compared to that of BTG2 or CNOT7, BTG2 and CNOT7 but not hnRNP C was overexpressed in 293T cell by BTG2-HA and CNOT7-V5 plasmid. After immunoprecipitating with HA antibody, strong interaction between BTG2 and known interacting protein, CNOT7 was observed (Figure 3B). In this experimental condition, following immunoprecipitation was performed. After immunoprecipitating with HA antibody, interaction between BTG2 and endogenous hnRNP C was detected by western blotting (Figure 3C, D). In another cancer cell lines, interaction between BTG2-HA and hnRNP C was confirmed by immunoprecipitation assay (Figure 3E, F).
24
Figure 3. BTG2 interacts with CNOT7 and hnRNP C
(A) Binding intensity of recombinant BTG2 and candidate proteins by protein chip array. Note high binding intensity between CNOT7, known interacting protein, and BTG2. HnRNP C, previously discovered as one of the proteins interacting to 3'-UTR of Bcl-XL mRNA [65], was chosen for further study. (B) Immunoprecipitation with BTG2-HA by HA antibody in CNOT7-V5 and BTG3-HA plasmid transected 293T cells. Note strong interaction between BTG2 and known interacting protein, CNOT7. In this experimental condition, following immunoprecipitation was performed for exploring interaction between BTG2 and hnRNP C. (C) Immunoprecipitation with BTG2-HA by HA antibody in BTG2-HA plasmid transected 293T cells. 293T cells transfected with BTG2-HA plasmid was equally divided and was immunoprecipitated with isotype control IgG antibody and HA antibody. Strong interaction between BTG2 and hnRNP C was found only in sample incubating HA antibody. (D) Reciprocal immunoprecipitation. Similar results were obtained by immunoprecipitating hnRNP C. (E) Immunoprecipitation with BTG2-HA by HA antibody in BTG2-HA plasmid transected MCF7 cells. (F) Immunoprecipitation with hnRNP C in BTG2-HA plasmid transected A549 cells.
25
3.4. HnRNP C interacts with 3’-UTR of Bcl-XL mRNA
RNA immunoprecipitation to pull down hnRNP C together with its potential mRNA targets was conducted to investigate the interaction between hnRNP C and 3’-UTR of Bcl-xL mRNA. This method has been successfully used to examine in vivo RNA-protein interactions [52]. By immunoprecipitation of hnRNP C protein, followed by detection of 3’-UTR of Bcl-xL mRNA specific primers by reverse transcription and PCR amplification., the 3’-UTR of Bcl-xL mRNA was significantly enriched in the hnRNP C immunoprecipitations (Figure 4A). This result indicated that Bcl-XL mRNA was bound by endogenous hnRNP C in intact cells. Next, to indentify the regions of 3’-UTR of Bcl-xL mRNA to which hnRNP C binds, biotinylated transcripts representing four segments of 3’-UTR of Bcl-xL mRNA was used for biotin pulldown analysis. After each of four biotinylated RNA fragments was incubated with cell lysates, pulldown with streptavidin bead was performed, and the level of hnRNP C was determined by western blot analysis. The strongest interaction was observed with fragment D, which contained AUUUUA regions, known RNA-binding sequence of hnRNP C (Figure 4B). Taken together, these results suggested that BTG2 can bind 3’-UTR of Bcl-xL mRNA indirectly through the hnRNP C and might mediate degradation of target mRNA by recruiting CNOT7.
27 Figure 4. HnRNPC interacts with Bcl-XL mRNA 3’-UTR
(A) RNA immunoprecipitation (RIP) is performed with whole cell extracts to enrich RNAs interacting with hnRNP C or control IgG. The presence of Bcl-XL mRNA 3’-UTR was determined by 3’-UTR specific RT-PCR in control IgG and anti-hnRNP C immunocomplexes. (B) Top, schematic depicting the Bcl-XL mRNA 3'-UTR tested by biotin pulldown assays. Bottom, after incubation with the indicated biotinylated RNAs fragment, the presence of hnRNP C was detected by immunoblot analysis. Biotinylated 3′ UTR of GAPDH served as negative control.
28
3.5. mRNA downregulation of Bcl-XL is dependent on interaction between BTG2 and CNOT7
To determine whether the change of Bcl-XL mRNA stability in BTG2 overexpressed and knock down cells was due to the interaction between BTG2 and deadenylase, CNOT7, previously reported BTG2 mutants (BTG2 G64A, W103A, and BTG2 Y65A) defective in binding CNOT7, was produced. After transfection of BTG2 wild-type or mutants and C-terminal V5 tagged CNOT7 in 293T cells, immunoprecipitation with HA antibody was performed. As previous reports, the binding affinity of BTG2 G64A, W103A or BTG2 Y65A to CNOT7 was significantly decreased compared to that of wild type BTG2 to CNOT7, although complete abolishment of interaction between mutant BTG2 and CNOT7, which was observed in previous report, was not shown in this experiment (Figure 5A). However, the binding between BTG2 and hnRNP C was maintained even in BTG2 Y65A (Figure 5B). When BTG2 Y65A was overexpressed, increased mRNA degradation of Bcl-XL after actinomycin D treatment, which was observed in wild type BTG2 overexpressed cells, was not shown (Figure 5C). However, when baseline level of hnRNP C was decreased by sihnRNP C, the change of Bcl-XL was not revealed statistically significant difference. Taken together, these data suggested that mRNA stability of Bcl-XL was dependent on the interaction between BTG2 and deadenylase, CNOT7.
30
Figure 5. mRNA downregulation of Bcl-XL is dependent on interaction between BTG2 and CNOT7
(A) Immunoprecipitation with HA antibody in 293T cell lysates transfecting either BTG2 WT, BTG2 G64A, W103A, or BTG2 Y65A and CNOT7-V5 and immunoblotting with V5 antibody for detecting CNOT7-V5. Note significant reduction of interaction between BTG2 G64A, W103A, or BTG2 Y65A and CNOT7. (B) Immunoprecipitation with HA antibody in 293T cell lysates transfecting either BTG2 WT or BTG2 Y64A and immunoblotting with hnRNP C antibody for detecting hnRNP C. Note maintenance of interaction between BTG2 Y64A and hnRNP C. (C) mRNA level of Bcl-XL after actinomycin D (5ug/m) treatment. Increased reduction of Bcl-XL mRNA level in BTG2 WT overexpressed 293T cells was not observed in BTG2 Y64A overexpressed 293T cells. (D) mRNA level of Bcl-XL after sihnRNP C transfection. Left, the efficiency of knock down by sihnRNP C was measured. Right, Bcl-XL mRNA level was compared in cells transfected with siControl and sihnRNP C. There was no significant difference in Bcl-XL mRNA level after hnRNP C knock down.
31
3.6. BTG2 enhances cell death through the regulation of Bcl-XL
Previous studies suggested that BTG2, as tumor suppressor gene, can augment cancer cell death. In normal and cancer cells, basal level of endogenous BTG2 is tightly regulated with short protein half-life about 15 min and BTG2 expression, as well-known one of the p53 downstream genes, is significantly increased in various stressful situation such as DNA damage. Therefore, when DNA damage was induced, increased BTG2 might augment cancer cell death by downregulation of Bcl-XL. To investigate this hypothesis, at first, by using ad-BTG2 virus, BTG2 was overexpressed in A549 cancer cell lines. Overexpression of BTG2 without any additional stimulation could induce cancer cell death in dose-dependent manner (Figure 6A). Morphologic feature and increased cleaved PARP along with reduction of Bcl-XL suggested the main type of induced cell death was apoptosis (Figure 6A). However, the level of BTG2 overexpressed by ad-BTG2 virus transduction-inducing direct cell death is far from physiologic. Since previous study showed that the cell lines demonstrating relative resistance to 70,000 cytotoxic agents in the 60 cell lines of the National Cancer Institute's in vitro anticancer drug screen were characterized by high BCL-XL expression, BCL-X was suggested to have unique role in general resistance to cytotoxic agents [66]. In addition, BTG2 was demonstrated as mediator of cisplatin induced anti-proliferation effect on prostate cancer cell [57]. Thus, chemotherapeutic agent, cisplatin, most commonly used in chemotherapy regimens for solid tumor treatment was applied for inducing cell death to mimic more relevant physiologic and clinical situation. During cell death induced by cisplatin, Bcl-XL was decreased in cisplatin dose and time dependent manner (Figure 6B). At early time points, before definitive cell death was observed, BTG2 mRNA was increased along with decrease of Bcl-XL mRNA within 8hr after cisplatin treatment (Figure 6C). When BTG2 was overexpressed up to the level without spontaneous cell death, cisplatin-induced cell deaths was augmented in BTG2 overexpressed cells (Figure 5D) and these increased cell death was not observed when BTG2 mutant (Y65A) which has defect in binding to CNOT7, was overexpressed (Figure 6E).
To validate and broaden these observations in more objective and clinically meaningful situation, gene expression data [67] of 30 cancer cell lines with information of resistance towards 11 anticancer drugs at clinically achieved concentrations was analyzed. In this database, BTG2 expression was also significantly higher among cisplatin sensitive cell lines compared that of insensitive cell lines (Figure S4). This reciprocal gene level of BTG2 and Bcl-XL after platinum chemotherapy was consistently observed in various kinds of oncogene and tumor suppressor gene mutated gastric cancer cell lines (Figure S5). In addition, this negative correlation of BTG2 and Bcl-XL gene was found with variable degrees of correlation in several cancer types of TCGA database (Figure S6). Taken together, these data revealed that BTG2 could enhance chemotherapy induced cancer cell death through the regulation of Bcl-XL mRNA stability mediated by interacting hnRNP C and CNOT7.
33
34
Figure 6. BTG2 enhances cisplatin-induced cancer cell death.
(A) Cell death of LacZ or BTG2 overexpressed A549 cells. Indicated moi of conrol LacZ or ad-BTG2 virus was transduced in A549 cells. Top, phase contrast microscopic findings of A549 cells transduced with indicated moi of adenovirus for 48 hours. Significant the cell death was observed from A549 cells transduced 400 moi of ad-BTG2 virus. In contrast, there was no significant cell death until 1000 moi of ad-LacZ virus transduction. Bottom, immunoblot analysis for level of Bcl-XL and cleaved PRAP after BTG2 overexpression. In agreement with observed cell death, significant reduction of Bcl-XL and cleavage of PRAP was observed from A549 cells ransduced 400 moi of ad-BTG2 virus. Note no significant reduction of Bcl-XL and cleavage of PRAP in ad-LacZ transduced A549 cells. (B) Immunoblot analysis for level of Bcl-XL after cisplatin treatment. After indicated amount of cisplatin treatment in A549 cell, Bcl-XL protein was decreased in dose and time dependent manner. (C) Changes of BTG2 and Bcl-XL mRNA after cisplatin treatment. Note reciprocal relationship between BTG2 and Bcl-XL mRNA level after cisplatin treatment. (D) Comparison of Ad-LacZ or Ad-TIS21 transduced Hela Cell death after cisplatin treatment. Left, phase contrast microscopic findings of HeLa cells treated with cisplatin after 24 hours of ad-LacZ or ad-BTG2 virus transduction. Right, cell viability measured by tryptophan blue exclusion assay. More cell death was observed in ad-BTG2 transduced HeLa cells treated with indicated concentration of cisplatin. (E)
Comparison of BTG2 WT or BTG2 Y65A transfected Hela Cell death after cisplatin treatment. Left, phase contrast microscopic findings of HeLa cells treated with cisplatin after 24 hours of BTG2 WT or BTG2 Y65A plasmid transfection. Right, cell viability measured by tryptophan blue exclusion assay. Increased cell death observed in BTG2 WT transfected HeLa cells was not shown in BTG2 Y65A plasmid transfection.
35
Figure S4. BTG2 mRNA level according to chemotherapy sensitivity from gene expression data of 30 cancer cell lines [58].
Figure S5. BTG2 and Bcl-XL expression after oxaliplatin treatment in several gastric cancer cell lines.
36
37
3.7. High BTG2 expression was associated with favorable platinum-based chemotherapy response and prognosis in advanced squamous carcinoma of lung
To investigate whether these in vitro observations have clinical relevance, the response to platinum-based chemotherapy and prognosis of patients were analyzed according to primary tumor expression level of BTG2. At first, BTG2 expression status was screened in various normal and paired tumor tissues with immunohistochemistry (IHC) to validate BTG2 antibody and select proper type of cancer for further study. As previous reports using same kind of BTG2 antibody for IHC, strong and specific expression of BTG2 in purkinje cells of cerebellum (Figure S7A) and same staining protocol was applied for further IHC. In head and neck region, basal BTG2 expression was observed in stratified squamous epithelium (Figure S7B), while no or weak BTG2 expression was observed in squamous cell carcinoma of head and neck (Figure S7C, D). In thyroid gland, normal follicular epithelium (Figure 7SE) and papillary thyroid cancer cells (Figure S7F, G) showed no BTG2 expression. In lung tissue, normal alveolar epithelium showed no BTG2 expression (Figure S7I.), while airway epithelium showed moderate BTG2 expression (Figure S7H). In squamous or adenocarcinoma of lung, more decreased BTG2 expression was observed compared to that of normal upper airway epithelium despite heterogeneous expression (Figure S7J). BTG2 expression of breast gland (Figure 7SK) and liver (Figure 7SN) is relatively higher as previous reports, while that of breast carcinoma (Figure 5SL, M) and hepatocellular carcinoma (Figure S7O, P) was significantly reduced as previous reports. In gastric epithelium, strong BTG2 expression was observed (Figure S7Q), while in colonic epithelium, significant BTG2 expression was not observed (Figure S7T.). BTG2 expression of gastric cancer (Figure S7R, S) was more variable compared to that of colon cancer (Figure S7U, K.). In kidney tissue, tubular epithelium showed strong BTG2 expression as previous report (Figure S7W), while renal clear cell carcinoma showed no BTG2 expression (Figure S7X, Y).
38
39
For further study, lung cancer was selected since Bcl-XL is studied as important mediator for survival of lung cancer [68] and platinum based-chemotherapy is standard chemotherapy regimen in advanced NSCLC. Based on our IHC observation, BTG2 expression of normal airway epithelium was decreased in their counterpart, squamous cell carcinoma (SCC). In addition, while prognosis of adenocarcinoma was significantly improved after discovery of different genetic background and therapeutic advances with target therapy such as EGFR, ALK tyrosine kinase inhibitors, that of advanced SCC of lung is median OS of less than 1 year. After all, improving efficacy of platinum based chemotherapy was still important in this histologic type of lung cancer. Therefore, among all advanced NSCLC patients treated with chemotherapy in our institution, a total of 70 patients only with squamous cell histology who received platinum-based doublet chemotherapy as first-line palliative treatment were analyzed. BTG2 expression was investigated with IHC and tumors with H-scores equal or higher than median value (6) were classified as high expression (Figure8). Interestingly, BTG2 expression was significantly lower in recurrent disease, whereas the base line characteristics had no correlation with BTG2 expression (Table 1). BTG2 expression level of tumors with progressive disease (PD) after platinum-doublet chemotherapy was significantly lower in that of controlled tumors after chemotherapy (Figure 7I). The median progression-free survival (PFS) and overall survival (OS) of all patients were 6.1 and 8.0 months, respectively. The median PFS and OS of patients with high expression of BTG2 were significantly longer than that of patients with low expression (6.7 vs. 3.2 months, p=0.002, Figure 8A and 10.7 vs. 6.0 months, p=0.039, Figure 8B). In addition to univariate analysis (Table 2), high BTG2 expression was independently associated with favorable PFS (hazard ratio=0.28, p<0.0001) and OS (hazard ratio=0.42, p=0.006) in multivariate analysis, (Table 3). Taken together, these data suggested that expression status of BTG2 in NSCLC could be potential prognostic biomarker for platinum-based chemotherapy.
41
Figure 7. BTG2 expression measured by immunohistochemistry in advanced squamous lung cancer treated with platinum-based doublet chemotherapy and H-score according to therapy response. (A) BTG2 expression in normal bronchial airway epithelium. (B) No expression of BTG2
in normal alveolar epithelium. No (C), weak (D), moderate (E), and strong (F) expression of BTG in squamous lung cancer samples. (G) Note heterogeneous expression pattern of BTG2 in different area of same lung cancer tissue. (H) BTG2 expression is observed in keratinized area. (I) Significant lower BTG2 expression was observed in tumor sample from patients experiment disease progression after platinum-based doublet chemotherapy.
42
Figure 8. Progression-free and overall survival according to the BTG2 expression. Kaplan–Meier
progression-free (A) and overall survival curve (B) according to the BTG2 expression. Longer PFS and OS was observed in high BTG2 expression group.
43
Figure 9. Proposal function of BTG2 in cancer cell death via regulating Bcl-XL mRNA stability through mRNA binding protein hnRNP C.
44
Table 1. Patients characteristics according to the BTG2 expression
Characteristics Total N (%) Low BTG2
expression High BTG2 expression P-value Gender Female Male 8 (11.4) 62 (88.6) 3 (10.3) 26 (89.7) 5 (12.2) 36 (87.8) 0.811 Age (years) < 70 ≥70 55 (78.6) 15 (21.4) 23 (79.3) 6 (20.7) 32 (78.0) 9 (22.0) 0.899 Smoking No Yes 9 (12.9) 61 (87.1) 3 (10.3) 26 (89.7) 6 (14.6) 35 (85.4) 0.597 PS (ECOG) 0 1 2 13 (18.8) 53 (75.7) 4 (5.7) 5 (17.2) 22 (75.9) 2 (6.9) 8 (19.5) 31 (75.6) 2 (4.9) 0.712 Tumor differentiationa Well Moderate Poor 1 (2.3) 19 (43.2) 24 (54.5) 0 (0.0) 6 (35.3) 11 (64.7) 1 (3.7) 13 (48.1) 13 (48.1) 0.387 Stage IIIB IV Recurrent disease 15 (21.4) 43 (61.4) 12 (17.1) 5 (17.2) 15 (51.7) 9 (31.0) 10 (24.4) 28 (68.3) 3 (7.3) 0.034 Disease status Primary metastatic Recurrent disease 58 (82.9) 12 (17.1) 20 (69.0) 9 (31.0) 38 (92.7) 3 (7.3) 0.009 a
Including not evaluated cases.
45
Table 2. Univariate analysis of progression-free and overall survival for all patients from the start of first-line chemotherapy
Prognostic factors Median
PFS (months) P-value Median OS (months) P-value Gender Female Male 3.8 4.7 0.652 4.4 9.2 0.865 Age (years) < 70 ≥70 4.6 5.8 0.154 9.2 7.2 0.623 Smoking No Yes 3.8 4.7 0.851 21.0 8.6 0.234 PS (ECOG) 0/1 2 4.7 4.6 0.851 8.6 6.0 0.499 Stage IIIB IV or recurrent disease 6.5 4.4 0.147 11.6 7.2 0.331 Disease status Primary metastatic Recurrent disease 4.8 3.7 0.173 8.6 7.2 0.278 BTG2 expression Low High 3.2 6.7 0.005 6.0 10.7 0.039
PFS, progression-free survival; OS, overall survival; PS, performance status; ECOG, Eastern Cooperative Oncology Group.
46
Table 3. Multivariate analysis of progression-free and overall survival for all patients from the start of first-line chemotherapy
PFS OS
Prognostic factors HR 95% CI P-value HR 95% CI P-value
Gender Female Male 1 1.50 0.36-6.17 0.579 1 0.52 0.19-1.38 0.189 Age (years) < 70 ≥70 1 0.56 0.26-1.25 0.157 1 1.27 0.53-3.05 0.589 Smoking No Yes 1 0.57 0.16-1.98 0.372 1 3.97 0.93-17.02 0.122 PS (ECOG) 0/1 2 1 0.94 0.33-2.68 0.912 1 1.46 0.51-4.18 0.485 Stage IIIB IV/recurrent disease 1 2.58 1.26-5.22 0.010 1 1.76 0.80-3.83 0.157 Disease status Primary metastatic Recurrent disease 1 0.28 0.10-0.76 0.013 1 0.44 0.19-0.99 0.048 BTG2 expression Low High 1 0.28 0.15-0.52 <0.0001 1 0.42 0.23-0.79 0.006 PFS, progression-free survival; OS, overall survival; HR, hazard ratio; CI, confidence interval; PS, performance status; ECOG, Eastern Cooperative Oncology Group.
47
Figure S8. BTG2 and BTG1 mRNA expression pattern in cancer and paired normal tissue from TCGA database.
48
4. DISCUSSION
It has been demonstrated that BTG2, as a founding member of anti-proliferative (APRO) gene family including six different genes in vertebrates (TOB1,TOB2, BTG1 BTG2/TIS21/PC3, BTG3 and BTG4), can arrest cells at G1/S, G2/M transition, increase apoptosis upon DNA damage, inhibit expansion of thymocytes and involve in the development and differentiation of nerve cells and hematopoietic cells. Transcriptional regulation and post-translational regulations of BTG2 have been well understood from several studies. While, the functional mechanism of BTG2 is not fully understood and further investigation is required. Since BTG2 protein, itself, has no catalytic activity, it is important that finding interacting proteins and understanding the function of interacting partners in the context of cellular phenotype mediated by BTG2. Several binding proteins have been discovered by various methods. PRMT1 as the one of the BTG2 interacting proteins was most actively validated and investigated in several studies. In recent study, the importance of BTG2 and PRMT1 complex in normal B cell differentiation was discovered in BTG2 knock mouse model. However, in our study, Bcl-XL mRNA regulation by BTG2 did not seem to be dependent on PRMT1.
Another important interacting protein to BTG2 is CNOT7 (caf1a) which has human mRNA deadenylase activity. 3D crystal structure between BTG2 and CNOT7 was discovered along with important amino acid residue of BTG2 for binding CNOT7 [69]. Nonetheless, further studies are required to elucidate whether BTG2 can regulate CNOT7 activity due to the opposite results. TOB, sharing same N terminal A, B box lesion which is important for binding CNOT7, can localize target mRNA directly through the PABP interacting PAM2 motifs located on its C-terminal and can mediate target mRNA deadenylation and degradation. While since BTG2 has no PAM2 motifs and no known mRNA binding activity, another binding partner which has RNA binding ability is needed to explain how BTG2 can mediate CNOT7 activity. According to recent study, BTG2 can interacts with cytoplasmic poly(A) binding protein (PABPC)1 and stimulates CAF1 deadenylase activity [51]. Therefore, BTG2 was suggested general activator of mRNA deadenylation and degradation. However, as our result (Figure S2), BTG2 could decrease the stability of not in general but in more specific target mRNAs. Recently, the molecular mechanism that TOB can enhance cMyc mRNA degradation specifically not by its PAM2 motifs but by interaction with another RNA binding protein, CPEB, was reported. Therefore, we suggested hnRNP C, known RNA binding protein, as one of the potential mediators interacting BTG2 and specific mRNA in this study. HnRNP C, a member of the hnRNP family, binds to nascent RNA transcripts and affects pre-mRNA splicing, export, and translation [16– 20]. Although hnRNP C was reported to affect mRNA stability, the molecular mechanism is not to be fully understood. According to previous studies, baseline hnRNP C may have a role of maintaining mRNA stability. However, as our results, when cells are stressed upon DNA damage and BTG2 is upregulated, hnRNP C could lose its protective role of maintaining mRNA stability by binding to


![Figure S4. BTG2 mRNA level according to chemotherapy sensitivity from gene expression data of 30 cancer cell lines [58]](https://thumb-ap.123doks.com/thumbv2/123dokinfo/4685721.3302/46.892.113.765.161.402/figure-level-according-chemotherapy-sensitivity-expression-cancer-lines.webp)