INTRODUCTION
Ovarian cancer is the leading cause of mortality from the gynecologic malignancies (Jermal et al, 2004). Every year, 2,000 ovarian cancer cases are being newly diagnosed and approximately 1,000 deaths, secondary to the malignancy, occur annually in Korea (Ministry health and welfare,
2001). Epithelial ovarian cancer (EOC), the most common form of human ovarian cancer, is usually diagnosed at stage III or IV, a stage at which the 5-year survival rate is below 30% compared with a 95% survival rate for stage I (Jermal et al, 2004). To improve patient survival, the identification and characterization of the key bio-markers that participate in ovarian carcinogenesis would be the essential steps.
Presently, lots of molecular knowledge has been piling up in the oncologic field. Based on the knowledge of differentially expressed genes in 접수일 2005. 4. 30.: 주관책임자:김대훈 E-mail: dhkim2k@catholic.ac.kr * 이 논문을 의학박사 학위논문으로 제출함.
종양특이
cDNA microarray
를 이용한 상피성 난소암에서의
유전자 발현 변화
가톨릭대학교 의과대학 산부인과학교실 조형권 김재훈 유영옥 박동춘 한구택 이준모 김대훈․ ․ ․ ․ ․ ․Gene expression profile changes in epithelial ovarian carcinomas
using tumor-specific cDNA microarray
Hyung Gueon Cho, M.D., Ph.D., Jae Hoon Kim, M.D., Ph.D., Yung Ok Yoo, M.D., Ph.D., Dong Choon Park, M.D., Ph.D., Gu Taek Han, M.D., Ph.D., Jun Mo Lee, M.D., Ph.D.,
Dae Hoon Kim, M.D., Ph.D.
Depart of Obstetrics and Gynecology College of Medicine, The Catholic University of Korea, Seoul, Korea To identify new bio-markers as well as potential targets for new drugs for epithelial ovarian cancer (EOC), we compared the gene expression
profiles of cancer tissues from 25 EOCs with human ovarian surface epithelium (HOSE) using in-house cDNA microarray specified to EOC. Based on a comprehensive method and information from the National Cancer Institute (NCI) Cancer Genome Anatomy Project (CGAP), the cDNA library was constructed. After excluding the overlapping clones, 768 spots were included in the array. We identified the genes and expressed sequence tags (ESTs) (30 up-regulated and 34 down-regulated) that are differentially expressed in EOC tissues. To confirm the expression data, we performed real time RT-PCR experiments. Using microdissected EOC tissues and cell lines, we investigated the expression status of the NET-1 gene, clusterin gene, and actin-binding LIM protein 1. The information provided here will be useful for identifying genes whose products might serve as molecular signatures for the biomakers of EOCs.
ovarian cancers, we are beginning to understand the biological behavior of the ovarian cancer cells. Several genes have been considered as candidates for the bio-markers of EOC, such as p53 (Aunoble et al, 2000), K-ras (Alvarez et al, 2001), ErbB2 (Leng et al, 1997), and Myc (Itkes et al, 1990). Moreover, many genes have recently been included as a candidate gene, such as DOC-2 (Mok et al, 1998), and kallikrein 4,5,8,9 (Kim et al, 2001; Yousef et al, 2001; Kishi et al, 2003; Yousef et
al, 2003). However, the inconsistency for
expression of the genes shows poor or incomplete
understanding about EOC tumorigenesis.
Moreover, researchers haven‘t found good
parameters for distinguishing the subtypes of EOC and their biological behaviors.
To arrive a better understanding of efficiently the genetic events that contribute to EOC, it has been suggested to identify those genes that are differentially expressed, and that may be directly related to tumorigenesis. cDNA microarray is known to be a powerful tool to identify numerous
differentially expressed genes during the
neoplastic progression of EOC (Ono et al, 2000; Wong et al, 2001; Jazaeri et al, 2003; Yang et al, 2003). It allows a number of potential candidate genes to be selected for subsequent analysis and applications, such as prostasin (Mok et al, 2001), EP-CAM (Kim et al, 2003), and osteopontin (Kim et al, 2002). However, because this gene expression analysis have been performed on arrays containing a limited set of genes, more studies are needed to characterize EOC.
Recently, by using a small and specialized chip that includes only the genes relevant to the biological process of interest, we can get the advantage of statistical power and eliminating
noise (Sawiris et al, 2002).
In this study, we report on how we employed a home-made cDNA microarray specified to EOC to investigate genes differentially expressed in EOC.
MATEARIAL AND METHODS
1. Preparation of the ovarian Tumor-specificcDNA microarray (OVCA Chip V1.0)
To make the ovarian tissue-specific cDNA array, we used a comprehensive human ovarian tumor cDNA library and clones sequenced by the National Cancer Institute (NCI)s Cancer Genome Anatomy Project (CGAP). A comprehensive human ovarian tumor cDNA library in the Lambda ZAP-CMV vector was custom-made using the mRNA samples obtained from 64 ovarian tumor tissues of different histological subtypes, grades, and stages (Stratagene, La Jolla, CA). To prepare the DNA of the lambda cDNA clones, the library was plated onto agar plates consisting of 0.7% top agarose. Agar plugs containing well-isolated single bacteriophage plaques were picked and placed into 1 mL suspension medium (0.1 M NaCl, 8 mM MgSO4, 50 mM Tris.Cl, pH 7.5, 0.1% gelatin) with
one drop of chloroform. More than 500 single plaques were harvested. After an overnight elution at 4 , the phages from each single plague were℃ incubated with E. coli XL1-Blue MRF cells and plated again. Plate lysates of the individual cDNA clones were harvested and the lambda DNA samples were extracted from these clones using the Qiagen Lambda System and the cDNA inserts were PCR-amplified with T7 and T3 primers. After checking their sizes and integrity on 1% agarose gels, the cDNA clones were sequenced by using ABI
PRISM BigDye Termination Cycle Sequencing on an ABI PRISM 310 Genetic Analyzer. Three hundred and fifty unique sequences were so obtained.
The National Cancer Institute (NCI) Cancer Genome Anatomy Project (CGAP) has determined the gene expression profiles of normal, pre-cancerous, and cancer cells by generating more than 400 CGAP libraries and sequencing thousands of clones from each library. The CGAP web site allows researchers to search and analyze all CGAP libraries and other cDNA libraries. Using the cDNA xProfiler software at the CGAP website, we were able to identify 9 ovarian tumor libraries that were derived from microdissected ovarian tumor cells. A total of 7,706 sequenced clones from these 9 different CGAP microdissected ovarian tumor libraries were purchased from Incyte Genomics, Inc (Palo Alto, California) (Table 1).
By comparing the gene expression between these pools of ovarian tumor cDNA libraries with the rest of the cDNA libraries (~6000), a list of 294 genes that are unique to these 9 ovarian tumor libraries was identified. From the sequencing analysis, 12 of these clones have similarity to the Alu repeat and 8 of these clones are no longer in
Table 1. CGAP microdissected ovarian tumor libraries
Library name No.of unique genesa Characteristics (microdissected tumors)
NCI_CGAP_Ov26 98 ovary papillary serous carcinoma
NCI_CGAP_Ov31 39 ovary invasive tumor
NCI_CGAP_Ov32 118 ovary invasive tumor
NCI_CGAP_Ov33 17 ovary borderline (LMP)
NCI_CGAP_Ov34 24 ovary borderline (LMP)
NCI_CGAP_Ov36 19 ovary borderline (LMP)
NCI_CGAP_Ov37 1 ovary early stage papillary serous carcinoma
NCI_CGAP_Ov39 31 ovary papillary serous ovarian metastasis to the omentum
NCI_CGAP_Ov40 74 ovary endometrioid ovarian metastasis to the omentum
a
Some of the unique genes are present in more than one of these libraries.
the unigene database.
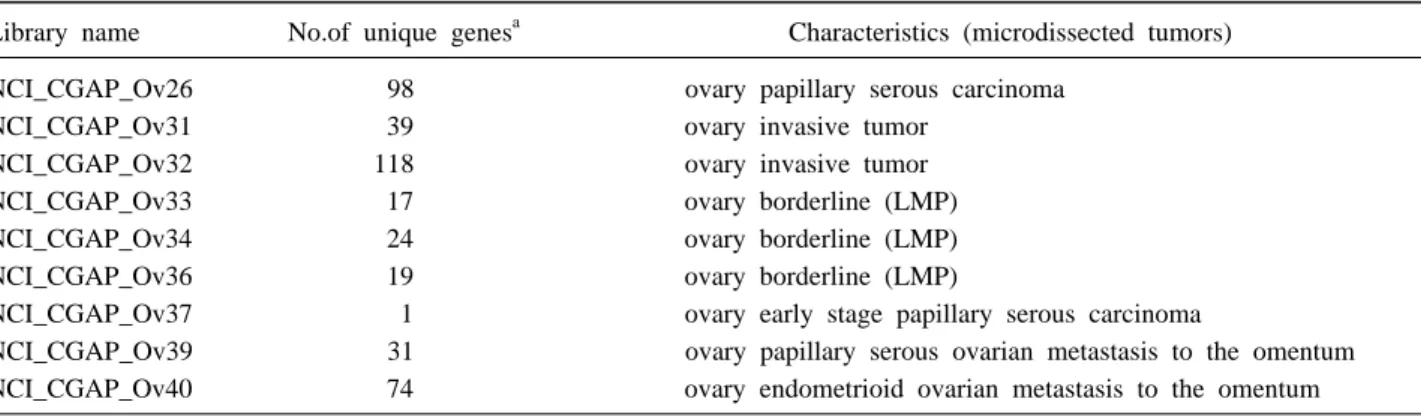
Using these 294 ovarian unique expressed sequence tags (ESTs) from the CGAP, 452 known genes and ESTs from our own ovarian tumor library and the normal HOSE cDNA library generated from microdissected normal HOSE cells, 19 house keeping genes, and 3 arabidopsis spike control, we have constructed an ovarian specific cDNA microarray composed of total of 768 spots. The clones were rearrayed into two 384 well plates, PCR amplified and purified. The PCR products were re-sequenced and printed onto GAPS slides (Corning Inc., Fountain valley, CA) in duplicate using a PixSys 5,500XL arrayer (Cartesian Technologies, Irvine, CA). A typical result is shown in Fig. 1.
2. Gene expression analysis of 25 ovarian tumors We used this ovarian specific microarray to analyze the expression profiles of 25 ovarian tumors that included 9 serous grade III, 4 serous
grade I, 4 mucinous, 4 clear cell and 4
endometrioid histological subtypes. The relevant clinical features of these patients are summarized
Fig. 1. Quantitation of differential hybridization signals between
normal ovarian surface epithelial cells (green) and ovarian cancer cells (red) from a home-made ovarian specific cDNA microarray with 768 genes printed in duplicate. Analysis was done with software Imagene 4.2. Yellow means almost equal signals from both samples. One microgram of total RNA from tumor or HOSE cells was labeled with the MICROMAX TSA system.
in Table II. A pool of 6 independent human ovarian surface epithelial primary cell cultures was used as the reference RNA. The TSA indirect labeling method was adopted in this study because of the limited amount of total RNA from the samples. Briefly, 1 µg of total RNA from tumor sample was labeled with biotin-dUTP during cDNA synthesis, while the reference RNA was labeled with fluorescein-dUTP. After hybridization, the signals from the tumor and reference sample were amplified with tyramide-Cy3 and tyramide-Cy5 respectively in the presence of horseradish peroxidase. After hybridization, the slides were scanned with a dual laser scanner, ScanArray 3,000 (General Scanning, now part of Perkin
Elmer Life Sciences, Boston, MA). The
hybridization signals were analyzed with software Imagene 4.2 (Biodiscovery Inc., Marina Del Rey, CA) and the hybridization signals were normalized to the median signal of 19 house-keeping genes. In addition, another method of data analysis developed by Tseng et al (2001) was also used. In briefly, for comparing two different conditions using cDNA microaray data, a quality index and calibration experiments for normalization were used. A rank invariant method was suggested to select non-differentially expressed genes and to construct normalization curves in comparative experiments. After normalization, the residuals from the calibration data are used to provide prior
information on variance components in the
analysis of comparative experiments.
Hierarchical clustering was performed using J-Express (Version 2.1).
3. Cell lines and culture conditions
All cell lines and cultures were maintained at
37℃ in a humidified 5% CO2 ambient air
atmosphere. They were grown in Medium 199 and MCDB 105 (1:1) (Sigma, St Louis, MO) supplemented with 10% fetal bovine serum (Gemini Bio-Products, Calabasas, CA). Normal human ovarian surface epithelial cells (HOSE) cultures were established by scraping the surface of the ovary, as described previously (Tsao et al, 1995). In brief, the scraped cells were spun down, resuspended and cultured in 2.5 mL of growth
medium. Cells at 75% confluenc were then
harvested by trypsinization and used for the total RNA isolation. For real time PCR, we prepared 9 HOSE cells and 21 ovarian cancer cell lines. Normal HOSE cells used in this experiment were
HOSE601, HOSE667, HOSE696, HOSE 713, HOSE718, HOSE 726, HOSE730, HOSE806, and HOSE831. Ovarian cancer cell lines were used ALST, CAOV3, DOV13, OVCA3, SKOV3, OVCA429,
OVCA432, OVCA433, OVCA633, OVCA680,
OVCA702, OVCA5071, PEO4, TOV112, TOV21, 2008PO4, MCAS, RMUG-L, RMUG-S, RMG-1 as well as ES-2. MCAS, RMUG-L and RMUG-S were originated from ovarian mucinous cystadenocar-cinoma. TOV112 was originated from ovarian endometrioid adenocarcinoma. TOV21, RMG-1 and ES-2 were originated from clear cell carcinoma. The others were from serous cystadenocarcinoma. OVCAR-3, SKOV-3, and ES-2, MCAS, RMUG-L, RMUG-R and RMG-1, PEO4, and 2008PO4 were purchased from American Type Culture Collection (Rockville, MD), the Japanese Collection of Research Bioresources (Tokyo, Japan), Imperial Cancer Research Fund, and the University of Texas Southwestern Medical Center, respectively. The other cell lines were kindly supplied from the Laboratory of Gynecologic Oncology, Brigham and Women's Hospital.
4. Tissue samples
All the patients were treated at Saint Vincent‘s Hospital between 1995 and 2000. We randomly retrieved the patients’ tissue specimens having ovarian tumor with different histologic types and grades based on the WHO and the International Federation of Gynecology and Obstetrics criteria. All tumor tissues were collected from the primary sites of ovarian cancer. They contained less than 20% normal tissue.
For frozen sections, fresh specimens collected at the operating room were placed in tissue culture
medium, Medium 199 and MCDB 105 (1:1) with 10% FBS, and then quickly transported to the laboratory. After removing the nontumorous tissues, the specimens were immediately embedded in Tissue Tek OCT medium (Miles, Elkhart, IN), snap-frozen in liquid nitrogen, and stored at -80℃ until use for laser capture microdissection.
5. Laser capture microdissection (LCM)
For real time PCR, microdissected tissues were used. Tissues stored in Tissue Tek OCT medium at -80℃were sectioned at 7 mm in a cryostat (Leica, Allendate, NJ). The sections were mounted onto uncoated glass slides and immediately fixed in 70%
and 50% ethanol for 30 seconds in each
concentration, then stained with Hematoxylin and Eosin, and next dehydrated in an increasing series of alcohol and clear xylene for 5 minutes in each concentration. The slides were air-dried once for 3 minutes, and next the sections were laser microdissected with the PixCell II (Arctarus, CA). Morphologically malignant epithelial ovarian cancer cells were so procured.
6. Real-time quantitative RT-PCR
RNA was extracted from the cell lines and tissues using a micro RNA extraction kit as described by the manufacturer (Stratagene, Valenica, CA), and quantified by fluorometry
(Gemini Bio-Products). Real-time PCR was
performed in duplicate using primer sets specific for NET-1 (forward primer: 5‘-CCAGAATGGA CCTGCCCTTT-3’; reverse primer: 5’-TGGTCCCTA
TCTAGCCCCAA-3’), ABLIM (forward primer:
CACAACCCATCCCTCCAGC-3’), clusterin (forward primer: 5‘-TTCCCACACTTCTGACTCGGAC-3’; reverse primer: 5‘-AACATCCACATCTCACTCC TCC-3‘) and a house keeping gene, GAPDH (forward primer: 5’-CATCTCTGCCCCCTCTGCTGA-3‘; reverse primer 5’-GGATGACCTTGCCCACA GCCT-3’), in an ABI PRISM 5,700 Sequence Detector. mRNA was extracted from normal HOSE cell cultures, ovarian carcinoma cell lines and normal ovarian tissues, respectively.
cDNA was generated from 1 g total RNA using
the TaqMan reverse transcription reagents
containing 1X TaqMan RT buffer, 5.5 mM MgCl2,
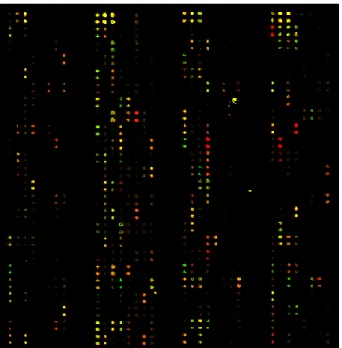
Table 2. Clinical characteristics of 25 cases of epithelial ovarian cancers used in the microarray study
Sample No. Pathologic Subtype Grade Stage Survival*
309 Endometrioid 3 Ⅲ D 316 Endometrioid 3 Ⅲ D 321 Serous 3 Ⅲ D 324 Serous 3 Ⅲ D 329 Endometrioid 1 Ⅲ D 332 Serous 3 Ⅲ D 333 Serous 1 Ⅰ L 334 Serous 3 Ⅲ D 341 Clear 3 Ⅲ D 343 Mucinous 3 Ⅲ D 349 Serous 3 Ⅲ L 351 Serous 3 Ⅲ L 354 Serous 1 Ⅲ L 373 Serous 1 Ⅰ L 375 Serous 3 Ⅲ L 380 Serous 3 Ⅲ D 382 Endometrioid 2 Ⅱ L 386 Serous 3 Ⅲ L 432 Clear 3 Ⅲ D 436 Mucinous 1 Ⅰ D 440 Mucinous 2 Ⅰ L 489 Serous 1 Ⅲ D 622 Clear 3 Ⅲ D 700 Mucinous 2 Ⅰ L 857 Clear 2 Ⅱ D * D: death, L: live
500 mM dNTP, 2.5 mM random hexamer, 0.4 U/mL Rnase inhibitor, and 1.25 U/mL MultiScribe reverse transcriptase (PE Applied Biosystems, Foster City CA) in a 100 mL. The reaction was incubated at 25℃ for 10 minutes, 48℃ for 30 minutes and finally at 95℃ for 5 minutes. A total of 0.5 mL of cDNA was used in a 20 mL PCR mix containing 1X SYBR PCR buffer, 3 mM MgCl2,
0.8 mM dNTP, and 0.025 U/mL AmpliTaq Gold (PE Applied Biosystems, Foster City, CA).
Amplification was then performed with
denaturation for 10 minutes at 95 , followed by℃ 40 PCR cycles of denaturation at 95℃ for 15
seconds and annealing/extension at 60℃ for 1 minute. The ABI 5,700 system software monitored the changes in fluorescence of SYBR Green I dye in every cycle and the threshold cycle (CT) for each reaction was calculated.
The relative amount of PCR products generated from each primer set was determined based on the threshold cycle (CT) value. GAPDH was used for the normalization of RNA used. Its CT value was then subtracted from that of each target gene to obtain a DCT value. The difference (DDCT) between the DCT values of the samples for each gene target and the DCT value of the calibrator was determined. The relative quantitative value was expressed as 2-DDCT. To confirm the specificity of the PCR reaction, PCR products were electrophoresed on a 1.2% agarose gel.
7. Statistical Analysis
Mann-Whitney U-test was used to test statistical significance for the real time PCR. The level of critical significance was assigned at p<0.05. The data were mainly summarized as means and standard deviations (SD). All analyses were performed using SPSS version 9.0 (SPSS Inc., Chicago, IL).
RESULTS
1. Identification of genes differentially expressed between EOC tissues and HOSE cells
The cDNA microarray technique was applied to analyze the expression patterns of EOC tissues and HOSE cells. Among the relevant 763 genes and expressed sequence tags (ESTs) assembled in the
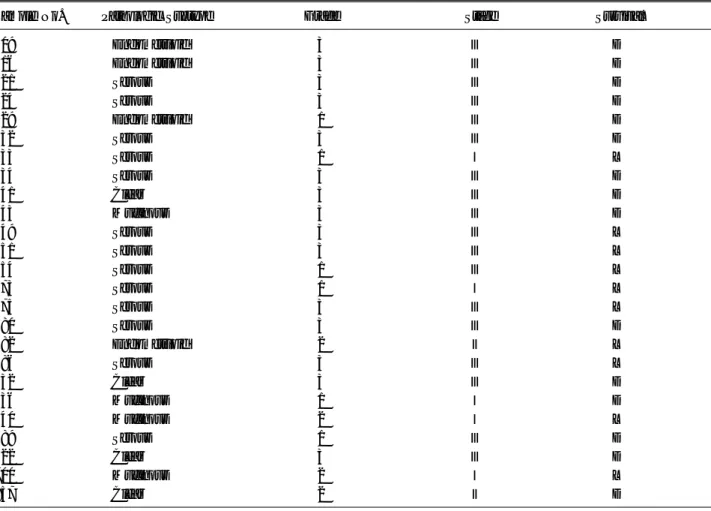
cDNA microarray, 64 were found differentially expressed with the difference signal intensity ratio of more than 2.0 by a Mann-Whitney U test. Genes and ESTS were divided into two groups on the basis of the difference in signal intensity. Out of 64 differentially expressed genes or ESTs, 30 were up-regulated (a signal intensity ratio of more than 2) and 34 down-regulated (signal intensity ratio of less than 1/2) in EOC tissues compared with HOSE cells (Table 3, 4). The data were then visualized using the J-express program, and this process resulted in a dendrogram of genes grouped together on the basis of the similarity of each gene's expression pattern (Fig. 2).
Fig. 2. Hierarchical clustering of microarray data. Twenty five
ovarian tumors, which include 9 serous grade III, 4 serous grade I, 4 mucinous, 4 clear cell, and 4 endometrioid histological subtypes were used. A pool of 6 independent human ovarian surface epithelial primary cell cultures was used as reference RNA. Red indicated genes that were cy-regulated in tumors compared to normal, and green also indicated genes that were down regulated in tumor compared to normal. Data were analyzed using J-Express version 2.1.
2. Real-time RT-PCR analysis
To further validate the microarry-based
findings, we performed real time RT-PCR
experiments with the NET-1 gene, clusterin gene,
Table 3. Genes and ESTs up-regulated in epithelial ovarian tumor#
Gene name Gene No.* Fold†
NET-1 AF065388 49.8 VK1 S59162 6.2 Ephrin-A1 (EFNA1) M004428 4.8 Ribosomal protein L30 L05095 4.3 FLJ 22875fis AK026528 4.1 Seb4B X75315 3.6 EST Hs.229831 3.0 EST Hs.278748 2.9 HDCMD 47P AF068287 2.8 EST Hs.278749 2.6 EST Hs.278876 2.5
HumFibm for fibrillarin X56597 2.5
EST Hs.278747 2.5
CD 68 M001251 2.5
EST Hs.235247 2.4
EST Hs.278862 2.3
Ribosomal protein S10 (RPS10) M001014 2.3
Actin binding LIM protein1 (ABLIM) M006720 2.3
Clusterin (SP-40) M001831 2.3
EST Hs.235457 2.2
EST Hs.254398 2.2
EST Hs.276352 2.1
Aldehyde reductase (AKR1A1) F112482 2.1
EST Hs.176874 2.1
EST Hs.41132 2.1
EST Hs.177415 2.1
FLJ 20203 M017710 2.1
Zinc finger protein (ZNF9) M003418 2.0
EST Hs.245672 2.0
EST H175651 2.0
#
More than two fold, P-values <0.05 * GeneBank accession number
†
Median value of expression of tumor compared to HOSE
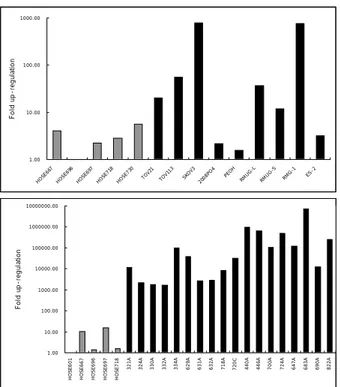
and actin-binding LIM protein 1. The results confirmed the pattern of expression identified by the microarray hybridization and showed higher expression of the genes in most of the EOC cell lines and tissues (Fig. 3, 4, 5).
Table 4. Genes and ESTs down-regulated in epithelial ovarian tumor#
Gene name Gene no.* Fold†
Keratin18 (KRT18) P000215 0.1
LIM protein P006448 0.1
EST P006842 0.2
EST AX013703 0.2
| -galactosidase binding proteinβ P002296 0.2
Integrin,beta1 (ITGB1) M002211 0.2
Iron-responsive regulatory protein M58510 0.2
KIAA0109 D63475.1 0.3
Calumenin (CALU) M001219 0.3
Heatshockprotein70 (Hsp70) U69698 0.3
Transcriptional repressor (GCF2) gi|3421044 0.3
Complement component 3 (C3) gi|4557384 0.3
BAC clone RP11-343B21 AC009230 0.3
Ferritin H chain gi|182504 0.3
EST AX018174 0.4
Clone DT1P1A7 gi|2781403 0.4
Clone 23698 gi|3360400 0.4
Serine/threonine proteinkinase 1 gi|5231142 0.4
Platelet-type phosphofructokinase D25328 0.4 EST Hs.274859 0.4 Scofilin1 (CFL1) gi|5031634 0.4 I factor (IF) NM000204 0.4 EST NP005722 0.4 3BACRP11-297K7 AC009319 0.4 EST AC034207 0.4
Alpha-tubulin isoform1m gi|3420928 0.4
RAB7 M004637 0.5
KIAA 0905 gi|4240298 0.5
EST Hs.278762 0.5
TATA box binding protein (TBP)-associated factor M003187 0.5
Rab11 X56740 0.5
Eukaryotic translation initiation factor 4 gamma 2 M001418 0.5
EST Hs.63472 0.5
Actin, gamma1 (ACTG1) M001614 0.5
#
More than two fold, P-values <0.05 * GeneBank accession number
†
1.00 10.00 100.00 1000.00 HOSE 667 HOSE6 96 HOSE 697 HOS E718 HOS E730 TOV21 TOV1 13 SKO V3 2008 PO4 PEO H RMU G-L RMU G-S RMG -1 ES-2 Fo ld u p -r e g u la ti o n 1.00 10.00 100.00 1000.00 10000.00 100000.00 1000000.00 10000000.00 HO S E 6 0 1 HO S E 6 6 7 HO S E 6 9 6 HO S E 6 9 7 HO S E 7 1 8 321 A 324 A 330 A 332 A 334 A 62 9 A 631 A 632 A 718 A 72 0C 440A 44 6 A 70 0 A 724 A 647 A 683 A 690 A 822A F o ld up -re g ul a ti o n
Fig. 3. Relative quantitation of NET-1 mRNA in HOSE cells
and epithelial ovarian cancers. A. Statistically significant differences were not obtained between normal HOSE cells (HOSE 601, HOSE 667, HOSE 696, HOSE 697, HOSE 718) and ovarian cancer cell lines (TOV21, TOV112, SKOV 3, 2008PO4, PEOH, RMUG-L, RMUG-S, RMG-1, ES-2) by the Mann-Whitney U Test. B. Expression differences were statistically obtained between 5 HOSE cells and 18 cancer tissues by the Mann-Whitney U-test (p<0.01). Each value was expressed as the mean of the duplicates.
DISCUSSIONS
The majority of women with ovarian cancer are diagnosed when they have distant metastatic disease. Primary surgical treatment is seldom curative for late stage disease and adjuvant treatment with radiation or chemotherapy is indispensable. At present, an accurate and reliable, screening method for earley detection has not yet been developed. An early detection method that has been suggested is the use of pelvic ultrasound, but this approach has limitations.
1.00 10.00 100.00 1000.00 HOSE 601 HOS E667 HOSE696HOSE 697 HOS E718321A324A 330A332A334A629A631A632A718A720 C 440A446A700A724A647A683A690A822A Fold u p -regulat ion 1.00 10.00 100.00 1000.00 HOS E667 HOS E696 HOSE 697 HOSE 718 HOS E730 TOV21 TOV113 SKO V3 200 8PO 4 PEO H RMU G-L RM UG-S RMG -1 ES-2 Fol d u p -r e g u lati o n
Fig. 4. Relative quantitation of ABLIM mRNA in HOSE cells
and epithelial ovarian cancers. A. Statistically significant differences were obtained between normal HOSE cells (HOSE 601, HOSE 667, HOSE 696, HOSE 697, HOSE 718) and ovarian cancer cell lines (TOV21, TOV112, SKOV 3, 2008PO4, PEOH, RMUG-L, RMUG-S, RMG-1, ES-2) by the Mann-Whitney U Test (p<0.05). B. Expression differences were statistically obtained between 5 HOSE cells and 18 cancer tissues by the Mann-Whitney U-test (p<0.01). Each value was expressed as the mean of the duplicates.
Pelvic ultrasound is high in cost and it may lead to unnecessory surgery with its attendant costs and potential morbidity for many non-cancerous cysts of the ovary for every case of ovarian cancer detected (Karlan, 1995). At the same time, there are case reports of ovarian cancers involving only the surface of the ovary that were detected at the time of prophylactic oophorectomy but thtse
lesions had not been seen on the pelvic
ultrasounds done shortly before the operation. Although ultrasound undoubtedly remains an important component of the work-up for those
0 20 40 60 80 100 120 140 160 HO SE71 3 HO SE72 6 HO SE73 0 HO SE806 HOS E83 1 ALS T CA OV3 DO V13 OV CA3 SK OV 3 OVC A42 9 OVCA 432 OVCA 433 OVC A63 3 OVCA 680 OVCA 702 OV CA507 1 TO V1122008 PEOH TOV 21 MC AS RM U G-L RM UG-S RMG -1 ES -2 Fo ld up-re gulat ion 1 10 100 1000 10000 100000 HOSE6 36 HOSE6 95 HOS E69 7 HOSE 713 HOS E726 HOS E730 HOSE8 06 HOSE8 31 317A324A330A333A427 A 428A440A442A446A466A473 A 489A489C629A652B683A685N690A700A720A720C721C724A729A734A741A809A822 A 834 A F o ld u p -r e gul at io
Fig. 5. Relative quantitation of clusterin mRNA in normal and
malignant epithelial ovarian cancer cell lines and tissues. A. Statistically significant differences were not obtained between normal ovarian epithelial cells (HOSE 713, HOSE 726, HOSE 730, HOSE 806, HOSE 831) and ovarian cancer cell lines (ALST, CAOV3, DOV13, OVCA3, SKOV3, OVCA429, OVCA-432, OVCA433, OVCA633, OVCA680, OVCA702, OVCA5071, TOV112, 2008, PEOH, TOV21, MCAS, RMUG-L, RMUG-S: RMG-1, and ES-2) by the Mann-Whitney U Test. OVCA3, OVCA432, OVCA633, OVCA5071, 2008PO4, PEOH, RMUG-S, and ES-2 showed highly expressed clusterin. B. Expression differences were obtained between 8 HOSE cells and 29 cancer tissues by the Mann-Whitney U-test (p<0.01). Each value was expressed as the mean of the duplicates.
women at risk for ovarian cancer, it has not been proved to be an ideal primary screening method. The use of biologic markers is an appealing approach to the early detection because such markers have the potential to detect early ovarian cancers not visible on ultrasound. Blood specimens are easily obtained, acceptable to patients, and could be made inexpensive to assay. There are currently a number of serum markers for ovarian
cancer: CA-125, OVX1, M-CSF, LPA, and folate-binding protein (Bast et al, 1981; Bast et al, 1983, Xu et al, 1993; Suzuki et al, 1995; Suzuki et al, 1998; Xu et al, 1998). While many of these have good prognostic value, none have been proven to be effective in early detection. The best studied of these is CA-125. However, its use in early detection is limited to clinical trials due to its uncertain sensitivity for asymptomatic early stage disease and a lack of specificity in younger women where an elevated CA-125 may be associated with benign conditions including endometriosis, fibroids, pelvic infection, and even menstruation (Woolas et al, 1993). The CA-125 test may be more useful in postmenopausal women. It seems clear that the ideal serologic test for the early detection of ovarian cancer has not yet been developed.
Microarray analysis of ovarian cancer has facilitated the rapid identification of potential diagnostic and therapeutic targets. However, this is just the beginning of a long journey to fully understand the pathogenesis of ovarian cancer. The cDNA microarray analysis of the 768 ovarian tumor-specific cDNA clones with 25 ovarian tumors has demonstrated that tumor-specific genes certainly do exist as potential targets for developing effective bio-markers. A problem with current screening method for early cancer diagnosis is its lack of adequate sensitivity and specificity. If we can validate the tissue specificity of these tumor-specific genes and their roles in the pathogenetic pathways, then we might be able to develop a more specific diagnostic tool for a specific tumor type. Likewise, similar strategies can be applied to other tumors. It will be exciting to identify all the tissue-specific and tumor-specific cDNA clones using the CGAP resources
(Boon et al, 2002), and to use those identified clones for a tumor specific microarray. By coupling with the recent advances in data mining and visualization tools, we might be able to gain a better understanding of the pathogenetic pathways for ovarian cancers. By defining the functional role of each ovarian tumor specific differentially expressed gene into the context of the altered cancer pathways, hopefully, we may one day conquer the scourge of ovarian cancer.
NET-1 is found to be up-regulated by 49.8 fold in EOC tissues compared with the normal control. NET-1 is a new member of the tetraspanin family of proteins. Immunohistochemic analyses of normal cervical epithelium and that of metaplasia, condyloma and CIN of differing severity suggest
that NET-1 expression is associated with
neoplastic cell proliferation. The potential importance for this gene in cervical carcinogenesis is underlined by an invariably strong expression of NET-1 observed in all the undifferentiated squamous cell cancers examined. (Wollscheid et al, 2002). Our data supports the concept of up-regulation of NET-1 in EOC.
Clusterin is a glycoprotein and it has also been termed apolipoprotein J, and SP40. It is composed of two 35-40 kD subunits (α and β) that are encoded for by a single gene (Rosenberg and Silkensen, 1995). Clusterin has been proposed to have functions in the setting of tumorigenesis including the regulation of apoptosis (Gleave et al, 2001). However, clusterin has recently been considered as a kind of survival gene because of its overexpression in the surviving neighboring cells compared to dead cells (Sensibar et al, 1995). Moreover, it was shown that clusterin expression
is up-regulated in response to stress agents like heat, cytotoxic drugs, UVA exposure, and oxidative stress (Viard et al, 1999; Dumont et al, 2000). Although the exact role of clusterin is not known, we can recognize the possibility of it being biomarker of EOC.
Actin binding LIM protein 1 is known as a key molecular adaptor with a remarkable potential to mediate protein-protein interactions. Its other ability is related to cofactor exchange that provides a molecular basis for its pleiotropic functions (Matthews et al, 2003).
Many of the candidate genes as molecular bio-markers were screened rapidly in this study. Our in-house cDNA microarray system is an efficient tool to analyze the expression status of the genes in an ovary. The large number of differentially expressed genes identified by this analysis and the characterization of theses genes will lead us to develop effective biomarkers as targets for earley diagnosis and treatment.
감사의 글
오늘까지 저의 부족함을 도와 이 논문을 만들 수 있도 록 협력해 주신 모든 분들께 영광을 돌리고자 합니다. 특히 김대훈 지도 교수님 김수평 전 주임 교수님 남, , , 궁성은 전 주임 교수님 김진홍 현 주임 교수님 강남성, , 모병원 이준모 교수님 성모병원 한구택 교수님 영동, , 세브란스병원 김재훈 교수님 가톨릭대학교의과대학 병, 리학교실의 유남진 교수님 남석우 교수님 그 외 직간접, 적으로 도움을 아끼지 않으셨던 여러 교수님과 교실 동 료 선 후배님 연구실 관계자 분께 깊은 감사를 드립니, , 다. 아울러 저에게 힘이 되어준 사랑하는 가족 친지 모두 에게 진심으로 감사 드리며 지금의 영광을 바칩니다.REFERENCES
1. Alvarez AA, Moore WF, Robboy SJ, Bentley RC, Gumbs C, Futreal PA, Berchuck A. K-ras mutations in Mullerian inclusion cysts associated with serous borderline tumors of the ovary. Gynecol Oncol 2001; 80: 201.
2. Aunoble B, Sanches R, Didier E, Bignon YJ. Major oncogenes and tumor suppressor genes involved in epithelial ovarian cancer (review). Int J Oncol 2000; 16: 567-76.
3. Bast RC Jr, Feeney M, Lazarus H, Nadler LM, Colvin RB, Knapp RC. Reactivity of a monoclonal antibody with human ovarian carcinoma. J Clin Invest 1981; 1068: 1331-7.
4. Bast RC Jr, Klug TL, St John E, Jenison E, Niloff, JM, Lazarus H. A radioimmunoassay using a monoclonal antibody to monitor the course of epithelial ovarian cancer. N Engl J Med 1983; 309: 883-7. 5. Boon K, Osorio EC, Greenhut SF, Schaefer CF, Shoemaker J, Polyak K, Morin PJ, Buetow KH, Strausberg RL, De Souza SJ, Riggins GJ. An anatomy of normal and malignant gene expression. Proc Natl Acad Sci USA 2002; 99: 11287-92.
6. Dumont P, Burton M, Chen QM, Gonos ES, Frippiat C, Mazarati JB, Eliaers F, Remacle J, Toussaint O. Induction of replicative senescence biomarkers by sublethal oxidative stresses in normal human fibroblast. Free Radic Biol Med 2000; 3: 361-73.
7. Gleave ME, Miyake H, Zellweger T, Chi K, July L, Nelson C, Rennie P. Use of antisense oligonucleotides targeting the antiapoptotic gene, clusterin/testosterone-repressed prostate message 2, to enhance androgen sensitivity and chemosensitivity in prostate cancer. Urology. 2001; 58(2 Suppl 1): 39-49.
8. Itkes AV, Imamova LR, Alexandrova NM, Favorova OO, Kisselev LL. Expression of c-myc gene in human ovary carcinoma cells treated with vanadate. Exp Cell Res 1990; 188: 169-71.
9. Jazaeri AA, Lu K, Schmandt R, Harris CP, Rao PH, Sotiriou C, Chandramouli GV, Gershenson DM, Liu ET. Molecular determinants of tumor differentiation in papillary serous ovarian carcinoma. Mol Carcinog 2003; 36: 53-9.
10. Jemal A, Tiwari RC, Murray T, Ghafoor A, Samuels A, Ward E, Feuer EJ, Thun MJ. Cancer statistics CA Cancer J Clin 2004; 54: 8-29.
11. Karlan BY, Platt LD. Ovarian cancer screening. The role of ultrasound in early detection. Cancer 1995; 76: 2011-5.
12. Kim H, Scorilas A, Katsaros D, Yousef GM, Massobrio M, Fracchioli S, Piccinno R, Gordini G, Diamandis EP. Human kallikrein gene 5 (KLK5) expression is an indicator of poor prognosis in ovarian cancer. Br J Cancer 2001; 84: 643-50.
13. Kim JH, Herlyn D, Wong KK, Park DC, Schorge JO, Lu KH, Skates SJ, Cramer DW, Berkowitz RS, Mok SC. Identification of epithelial cell adhesion molecule autoantibody in patients with ovarian cancer. Clin Cancer Res 2003; 9: 4782-91.
14. Kim JH, Skates SJ, Uede T, Wong KK, Schorge JO, Feltmate CM, Berkowitz RS, Cramer DW, Mok SC. Osteopontin as a potential diagnostic biomarker for ovarian cancer. JAMA 2002; 287: 1671-9. 15. Kishi T, Grass L, Soosaipillai A, Scorilas A, Harbeck N, Schmalfeldt B, Dorn J, Mysliwiec M, Schmitt M, Diamandis EP. Human kallikrein 8, a novel biomarker for ovarian carcinoma. Cancer Res 2003; 63:
2771-4.
16. Leng J, Lang J, Shen K, Guo L. Overexpression of p53, EGFR, c-erbB2 and c-erbB3 in endometrioid carcinoma of the ovary. Chin Med Sci J 1997; 12: 67-70.
17. Matthews JM, Visvader JE. LIM-domain-binding protein 1: a multifunctional cofactor that interacts with diverse proteins. EMBO Rep 2003; 4: 1132-7.
18. Ministry health and welfare, Headquarters of Korea Central Cancer registry, Annual report of the Korea central registry program (2001.1-2001.12), Ministry health and welfare.
19. Mok SC, Chan WY, Wong KK, Cheung KK, Lau CC, Ng SW, Baldini A, Colitti CV, Rock CO, Berkowitz RS. DOC-2, a candidate tumor suppressor gene in human epithelial ovarian cancer. Oncogene 1998; 16: 2381-7.
20. Mok SC, Chao J, Skates SJ, Wong KK, Yiu GK, Muto MG, Berkowitz RS, Cramer DW. Prostasin, a potential serum marker for ovarian cancer: identification through microarray technology. J Natl Cancer Inst 2001; 93: 1458-64.
21. Ono K, Tanaka T, Tsunoda T, Kitahara O, Kihara C, Okamoto A, Ochiai K, Takagi T, Nakamura Y. Identification by cDNA microarray of genes involved in ovarian carcinogenesis. Cancer Res 2000; 60: 5007-11.
22. Rosenberg ME, Silkensen J. Clusterin: physiologic and pathophysiologic considerations. Int J Biochem Cell Biol 1995; 27: 633-45. 23. Sawiris GP, Sherman-Baust CA, Becker KG, Cheadle C, Teichberg D, Morin PJ. Development of a highly specialized cDNA array for the study and diagnosis of epithelial ovarian cancer. Cancer Res 2002; 62: 2923-8.
24. Sensibar JA, Sutkowski DM, Raffo A, Buttyan R, Griswold MD, Sylvester SR, Kozlowski JM, Lee C. Prevention of cell death induced by tumor necrosis factor alpha in LNCaP cells by overexpression of sulfated glycoprotein-2 (clusterin). Cancer Res 1995; 55: 2431-7. 25. Suzuki M, Kobayashi H, Ohwada M, Terao T, Sato I. Macrophage colony-stimulating factor as a marker for malignant germ cell tumors of the ovary. Gynecol Oncol 1998; 68: 35-7.
26. Suzuki M, Ohwada M, Sato I, Nagatomo M. Serum level of macrophage colony-stimulating factor as a marker for gynecologic malignancies. Oncology 1995; 52: 128-33.
27. Tsao SW, Mok SC, Fey EG, Fletcher JA, Wan TS, Chew EC, Muto MG, Knapp RC, Berkowitz RS. Characterization of human ovarian surface epithelial cells immortalized by human papilloma viral oncogenes (HPV-E6E7 ORFs). Exp Cell Res 1995; 218: 499-507. 28. Tseng GC, Oh MK, Rohlin L, Liao JC, Wong WH. Issues in cDNA microarray analysis: quality filtering, channel normalization, models of variations and assessment of gene effects. Nucleic Acids Res 2001; 29: 2549-57.
29. Viard I, Wehrli P, Jornot L, Bullani R, Vechietti JL, Schifferli JA, Tschopp J, French LE. Clusterin gene expression mediates resistance to apoptotic cell death induced by heat shock and oxidative stress. J Invest Dermatol 1999; 112: 290-6.
30. Wollscheid V, Kuhne-Heid R, Stein I, Jansen L, Kollner S, Schneider A, Durst M. Identification of a new proliferation-associated protein NET-1/C4.8 characteristic for a subset of high-grade cervical intraepithelial neoplasia and cervical carcinomas. Int J Cancer 2002; 99: 771-5.
31. Wong KK, Cheng RS, Mok SC. Identification of differentially expressed genes from ovarian cancer cells by MICROMAX cDNA microarray system. Biotechniques 2001; 30: 670-5. 32. Woolas RP, Xu FJ, Jacobs IJ, Yu YH, Daly L, Berchuck A, Soper JT,
Clarke-Pearson DL, Oram DH, Bast RC Jr. Elevation of multiple serum markers in patients with stage I ovarian cancer. J Natl Cancer Inst 1993; 85: 1748-51.
33. Xu FJ, Yu YH, Daly L, et al. OVX1 radioimmunoassay complements CA-125 for predicting the presence of residual ovarian carcinoma at second-look surgical surveillance procedures. J Clin Oncol 1993; 11: 1506-10.
34. Xu Y, Shen Z, Wiper DW, Wu M, Morton RE, Elson P, Kennedy AW, Belinson J, Markman M, Casey G. Lysophosphatidic acid as a potential biomarker for ovarian and other gynecologic cancers. JAMA 1998; 280: 719-23.
국문초록
=
=
상피성 난소암의 생화학적 표지물질을 발견하기 위하여, 25개의 상피성 난소암 조직의 유전자 표현 양상을 종양특이
를 이용하여 비교하였다 와
cDNA microarray . Comprehensive method National Cancer Institute (NCI)s Cancer Genome
의 유전자 정보를 이용하여 반복되는 을 제외한 개의 으로 구성된 를 구축하였
Anatomy Project (CGAP) , clone 768 spot array
다 상피성 난소암 조직에서 상이하게 발현되는. 64개의 유전자 또는ESTs (expressed sequence tags)를 발견하였다 유전자. 발현 여부를 확실하게 알기 위하여 미세조작된 상피성 난소암 조직과 세포주를 이용하여Real time RT- PCR을 시행하였 다. NET-1, clusterin, actin-binding LIM protein 1유전자의 발현이 상피성 남소암에서 과발현됨을 확인할 수 있었다 본. 연구는 상피성 난소암의 진단에 있어서molecular target으로 작용될 수 있는 물질을 생성하는 유전자를 밝혀 내는데 유용 한 정보를 제공할 수 있을 것이다.
중심단어:cDNA microarray, 상피성 난소암, NET-1, Clusterin, Actin-binding LIM protein 1
35. Yang SH, Kim JS, Oh TJ, Kim MS, Lee SW, Woo SK, Cho HS, Choi YH, Kim YH, Rha SY, Chung HC, An SW. Genome-scale analysis of resveratrol-induced gene expression profile in human ovarian cancer cells using a cDNA microarray. Int J Oncol 2003; 22: 741-50. 36. Yousef GM, Kyriakopoulou LG, Scorilas A, Fracchioli S, Ghiringhello B, Zarghooni M, Chang A, Diamandis M, Giardina G, Hartwick WJ, Richiardi G, Massobrio M, Diamandis EP, Katsaros D. Quantitative expression of the human kallikrein gene 9 (KLK9) in ovarian cancer: a new independent and favorable prognostic marker. Cancer Res 2001; 61: 7811-8.
37. Yousef GM, Polymeris ME Grass L, Soosaipillai A, Chan PC, Scorilas A, Borgono C, Harbeck N, Schmalfeldt B, Dorn J, Schmitt M, Diamandis EP. Human kallikrein 5: a potential novel serum biomarker for breast and ovarian cancer. Cancer Res 2003; 63: 3958-65.