Many efforts for the development of chemopreventive or
therapeutic agents for cancer from natural products have
been performed over the last several decades. As potential
antitumor agents, polymethoxy stilbenes and
dihydrostil-benes have been investigated.
1,2)Combretastatins, a branch of
stilbene derivatives, have been isolated from the South
African tree Combretum.
3,4)Among these combretastatins,
combretastatin A-4 was found to exhibit the most potent
cy-totoxicity. These compounds are known to inhibit tubulin
polymerization, to cause mitotic arrest in L1210 murine
leukemia cells, and competitively inhibit the binding of
radio-labeled colchicines to tubulin.
5)Moreover, a recent
study of combretastatins verified that combretastatin A-4
ex-hibits potent activity against multidrug-resistant (MDR)
can-cer cells.
6)This compound has been evaluated for clinical
ap-plication, resulting in only limited success due to its poor
water solubility.
7)Recently, the more water-soluble phosphate
derivatives of combretastatin A-4 have undergone clinical
evaluation. From these efforts, the development of new
stil-bene analogues continues to attract interest as a way to obtain
potential antitumor therapeutic targets (Chart 1).
Several molecular modeling studies involving stilbenes
used as antitumor agents have been reported. The proposed
models predicted the activity of combretastatin binding to the
colchicine binding site, but the models showed limited
suc-cess and usefulness.
8—10)Two-dimensional (2D) models
re-lated to stilbene derivatives that showed tubulin
polymeriza-tion inhibitory activity were also studied. However, the lack
of structural variation and an inability to predict activity are
the limitations of the models.
As part of our research on stilbenes exhibiting selective
human cytochrome P450 1B1 inhibition,
11)we evaluated the
cytotoxicity of the prepared compounds against several
tumor cell lines. A comparative molecular field analysis
(CoMFA), ligand-based drug design tool, one of the most
commonly used three dimensional quantitative
structure–ac-tivity relationship (3D-QSAR) programs, has also been
ap-plied to a number of different classes of compounds.
12,13)A
CoMFA study of the stilbenes that showed cytotoxicity
against A549 lung carcinoma was performed to yield a
rela-tively high cross-validated r
2value. In the present study, the
model is constructed using various substituents of aromatic
rings of stilbenes and diverse hetoroaromatic rings because it
is well known that a 3D-QSAR study of diversely modified
molecules showing a wide range of activity results in a
reli-able pharmacophore model (Chart 2).
Experimental
Biological Data Table 1 lists the structures and the observed and calcu-lated biological activity values of compounds forming the training set used to derive the CoMFA model. In this study, biological activity refers only to the cytotoxicity value expressed as pIC50, that is, the 2log of the concentra-tion (M) of the tested compounds that inhibited tumor cell growth by 50%. Consequently, all the activity values are in the range of 4.46 (lowest active compound) to 7.54 (most active compound). The cytotoxicity (the IC50 value) of compounds 1b, 1j—m, and 2i—l were obtained by the sulforho-damine B (SRB) method.14,15)Except for the above-mentioned compounds, the MTT colorimetric assay method was employed.16,17)In general, tabulat-ing biological activity data from different sources should be done very care-fully. For this work we have selected diverse compounds of which the activ-ity was measured by two different methods. Because the MTT and SRB methods yielded similar results,18)we felt confident that all the data are com-patible with each other. Experimental procedures of the SRB method were followed up with the US National Cancer Institute protocol as follows. Briefly, tumor cells were cultured to maintain logarithmic growth by chang-ing the medium 24 h before cytotoxicity assays. On the day of the assay, the cells were harvested by trypsinization, counted, diluted in media, and added to 96-well plates. The number of tumor cells (A549) used was 13104/well. The cells were then preincubated for 24 h in a 5% CO2incubator at 37 °C. The compounds dissolved in dimethyl sulfoxide (DMSO) were added to the wells in six 2-fold dilutions starting from the highest concentrations, and in-cubated for 48 h in a 5% CO2incubator at 37 °C. The final DMSO concen-tration was 0.05%. At the termination of the incubation, the culture medium in each well was removed, and the cells were fixed with cold 10% trichloroacetic acid (TCA) for 1 h at room temperature. The microplates were washed, dried, and stained with 0.4% SRB in 1% acetic acid for 30 min at room temperature. The cells were washed again and the bound stain was * To whom correspondence should be addressed. e-mail: [email protected] © 2003 Pharmaceutical Society of Japan
Pharmacy, Chonnam National University; Yongbong-dong Buk-gu, Kwangju 500–757, Korea: and cCollege of Pharmacy,
Ewha Womans University; Seoul 120–750, Korea. Received December 9, 2002; accepted February 13, 2003
A series of 43 stilbene derivatives that showed cytotoxicity against human lung carcinoma (A549) was ana-lyzed using comparative molecular field analysis (CoMFA) for defining the hypothetic pharmacophore model. The polyoxylated stilbenes were found to be active inhibitors of tubulin polymerization. Several cis-stilbenes are structurally similar to combretastatins. However, the trans-stilbenes are assumed to be close to resveratrol found in grapes and have been reported to be potential cancer chemopreventive agents by modulating the initiation, promotion, and progression of the carcinogenic process. With several synthesized compounds that were evalu-ated for antitumor cytotoxicity against human lung tumor cells (A549), the stilbene derivatives were subjected to CoMFA. To perform systematic molecular modeling of these compounds, a conformational search was carried out based on the precise dihedral angle analysis of the lead compound (1p). The X-ray crystallographic structure of combretastatin A-1 was also used for defining the active conformers of the compounds. After determining the energy-minimized conformers of the lead compound (1p), CoMFA was performed using five different align-ments. The three dimensional (3D)-quantitative structure–activity relationship study resulted in reasonable cross-validated, conventional r2values equal to 0.640 and 0.958, respectively.
solubilized with 10 mMTris base solution (pH 10.5), and the absorbances were measured spectrophotometrically at 520 nm on a microtiter plate reader (Molecular Devices, Sunnyvale, CA, U.S.A.). The data were transformed into Lotus-123 format and survival fractions were calculated by regression analysis (plotting the cell viability versus the concentration of the test com-pound). The IC50values represent the concentrations of the compounds that inhibit 50% of cell growth. All data represent the mean values for a mini-mum of three wells.
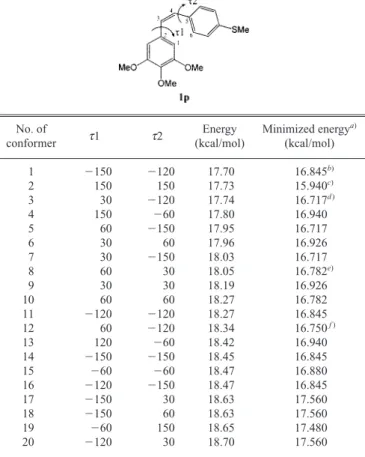
Computer Modeling The computational calculations were performed using the molecular modeling software Sybyl 6.30 on an Indigo2 worksta-tion (Silicon Graphics) with the standard bond lengths and angles.19) Molec-ular mechanics calculations including field-fit optimization were carried out with the standard Tripos force field and the minimum energy change of 0.05 kcal/mol as a convergence criteria. Charges were calculated using the Gasteiger-Huckel method as implemented in Sybyl. To find candidates for local minimum conformation, a preliminary conformational search was per-formed by the systematic search method and grid search implemented in the Sybyl system. Conformational search of 1p was performed in 30-degree in-crements in two sigma bonds (t 1, t 2) and 20 conformers were selected as shown in Table 2. For defining the active conformer of 1p, each conformer employed energy minimization again by the Tripos force field method. As a result, conformers 1, 11, 14, and 16 gave the same conformation (t 1; 41.6°, t 2; 47.3°) with the same energy (16.845 kcal). Four conformers could also be derived by the above analysis. Finally, we selected conformers 1—3, 8, and 12 as the representatives for CoMFA study. The lowest-energy minimum conformation of each compound was assumed to be the active conformer. However, it was difficult to determine the active conformers among these conformers because the value of the energy difference is too small to ex-clude the lower values. Therefore we employed CoMFA using each
con-former as a template molecule to obtain the results depicted in Table 3. The proposed active conformer of 1p was arbitrarily selected as a template mole-cule and the other compounds were superposed on it by matching the corre-sponding atoms of the stilbene derivatives of each molecule due to similar rigidity. The grid in which the molecules were regularly spaced (2 Å) with 19322322 Å (X5214 to 5, Y5210 to 12, Z5212 to 10) dimensions was determined by an automatic procedure performed by the Sybyl-CoMFA module. When the region for the molecules to be embedded in the grid box with dimensions of 16318314 Å (X5211 to 5, Y527 to 11, Z5210 to 4) was manually defined, lower statistical values such as q2and r2were ob-tained. As the initial conformations of the compounds, the X-ray crystallo-graphic data obtained from the Cambridge Crystallocrystallo-graphic Data Center (CCDC) of combretastatin A-1 were also utilized.20)We used it as a template molecule for determining the conformation of the molecules. To investigate the conformation profile, we carried out an extensive conformational search of the compounds using the torsion angle of combretastatin A-1. The torsion angles of t 1 (258.1°) and t2 (215.7°) in the compound were fixed and each active conformer of the 43 compounds was superimposed on that of the template molecule, so that each structural component was as close as possi-ble to the corresponding components of the reference. Thus, eight atoms, i.e., A-ring and C2—C3 atoms were selected because most of the com-pounds consist of these atoms as a common unit, and the sum of the squares of the distance of the eight atomic positions from the corresponding atomic positions of the reference compound was made as small as possible for the superimposition, as shown in Chart 3. However, this procedure gave less re-liable statistical values of q2as well as r2, as shown in Table 4. For perform-ing CoMFA, steric and electrostatic interaction energies were calculated using a carbon sp3probe atom with a charge of 11, and an energy cutoff of 30 kcal/mol. Using the Sybyl implementation of the partial least-squares Chart 1. The Structure of Combretastatin A4 and A1
(PLS) analysis, regression analyses were performed initially with the leave-one-out cross-validation method to reduce the possibility of obtaining chance correlations. The optimal number of components (latent variables) was chosen on the basis of the highest cross-validated r2 value and the smallest standard deviation. A 2 kcal/mol energy column filter was per-formed to improve the signal-to-noise ratio. The steric and electrostatic field columns were then used according to the COMFA STD default option.
From the above procedure, the final PLS Eq. (1) in Table 3 was derived as shown below.
pIC5052.42310.8723cLog P1[electrostatic]1[steric] n543, F(5, 37)5170 , s50.191 , r250.958
The cLog P contribution in the equations in Table 3 and 4 is relatively high (18.4—21.4%). This suggests the compounds may penetrate the cell wall or interact strongly at the hydrophobic regions for showing the biological activ-ity. The alignment produced good cross-validated results and conventional values with the optimum number of components. In this model, steric, elec-trostatic, and hydrophobic factors contributed to the QSAR equation by
40%, 41.3%, and 18.7%, respectively. It can be seen in Table 1 that the ac-tivity of all the examined compounds is calculated with an average absolute error of 0.14 log units. Figure 1 shows a plot of calculated vs. measured ac-tivities of stilbenes. A contour map of the coefficients of each grid point is depicted in Figs. 2 and 3.
CoMFA Results
The CoMFA statistical results for the cytotoxic activity of
A549 are summarized in Table 3. In these equations, m
indi-cates the number of optimum components and s is the
stan-dard deviation obtained from the leave-one-out
cross-valida-tion. The relative contribution of steric, electrostatic, and
cLog P values is shown as a percentage. To determine
whether the hydrophobic parameter is significant, cLog P
val-ues were inserted in the CoMFA analyses. As a result, their
contribution to the equation was relatively high (18.4 to
4 1d 3,4,5-(OMe)3 2-OMe — — — 5.96 6.33 20.37 3.25 5 1ea) 3,4,5-(OMe) 3 4-OMe — — — 6.01 5.95 0.06 3.25 6 1fb) 3,4,5-(OMe) 3 2-Cl — — — 7.29 7.37 20.08 4.10 4-OMe 7 1ga) 3,4,5-(OMe) 3 H — — — 6.77 6.57 0.20 3.33 8 1ha) 3,4,5-(OMe) 3 4-Cl — — — 7.10 7.14 20.04 4.04 9 1ia) 3,4,5-(OMe) 3 4-OAc — — — 5.77 5.78 20.01 2.68 10 1jc) 3,5-(OMe) 2 4-OMe — — — 6.62 6.65 20.03 4.36 11 1kc) 3,5-(OMe) 2 2,4,5-(OMe)3 — — — 5.35 5.43 20.08 3.89 12 1lc) 1-(3-furanyl)-2-(3,4,5-trimethoxyphenyl)ethene 6.12 5.76 0.36 2.50 13 1mc) 1-(3-thiophenyl)-2-(3,4,5-trimethoxyphenyl)ethene 5.12 5.56 20.44 2.97 14 1na) 1-(4-pyridyl)-2-(3,4,5-trimethoxyphenyl)ethene 4.85 4.91 20.06 1.83 15 1oa) 1-(3-pyridyl)-2-(3,4,5-trimethoxyphenyl)ethene 4.86 4.99 20.13 1.83 16 2ab) 3,4,5-(OMe) 3 4-OEt — — — 6.77 6.57 0.20 3.78 17 2cb) 3,4,5-(OMe) 3 4-SMe — — — 6.33 6.23 0.10 3.89 18 2db) 3,4,5-(OMe) 3 4-Me — — — 5.96 6.24 20.28 3.83 19 2eb) 3,4,5-(OMe) 3 4-Et — — — 6.89 6.70 0.19 4.36 20 2fc) 3,4,5-(OMe) 3 4-OMe — — — 6.88 6.64 0.24 3.25 21 2ga) 3,4,5-(OMe) 3 4-OAc — — — 5.01 5.04 20.03 2.68 22 2ha) 3,4,5-(OMe) 3 2,3,4-(OMe)3 — — — 4.90 4.89 0.01 2.22 23 2ic) 3,5-(OMe) 2 4-OMe — — — 5.53 5.46 0.07 4.36 24 2jc) 3,5-(OMe) 2 2,4-(OMe)2 — — — 5.58 5.35 0.24 4.45 25 2kc) 3,5-(OMe) 2 2-OH — — — 6.62 6.41 0.21 3.87 4-OMe 26 2lc) 1-(2-furanyl)-2-(3,4,5-trimethoxyphenyl)ethene — 4.46 4.65 20.19 2.50 27 3ab) 3,4,5-(OMe) 3 4-OEt — H H 6.72 6.75 20.03 3.93 28 3bb) 3,4,5-(OMe) 3 4-SMe — H H 6.82 6.96 20.14 4.04 29 3cb) 3,4,5-(OMe) 3 4-Et — H H 7.06 7.40 20.34 4.51 30 3da) 3,4,5-(OMe) 3 4-NH2 — H H 4.91 4.77 0.14 2.25 31 3eb) 3,4,5-(OMe) 3 4-OMe — H CN 4.94 4.96 20.02 2.10 32 3fa) 1-(3-pyridyl)-2-(3,4,5-trimethoxyphenyl)ethane 4.91 4.66 0.25 1.98 33 4ab) — 4-OMe — COOH H 4.86 5.04 20.18 2.25 34 4bb) — 4-OMe — H COOH 5.28 5.24 0.04 2.25 35 4cb) — 3-OMe — COOMe H 5.89 6.02 20.03 2.63 36 4db) — 4-OMe — CONHEt H 5.47 5.58 20.11 2.44 37 4eb) — 4-OMe — COO(CH 2)2NEt2 H 5.74 5.90 20.16 3.65 38 5aa) 3,4,5-(OMe) 3 4-OMe O — — 4.85 4.99 20.13 1.68 39 5ba) 3,5-(OMe) 2 4-OMe H2 — — 5.24 5.33 20.09 3.20 40 6ab) — — H, OH — — 5.82 5.74 0.08 1.26 41 6bb) — — H 2 — — 6.82 6.91 20.09 3.02 42 7b) — — — — 5.24 5.21 0.03 3.31 43 8b) — — — — — 4.84 4.79 0.05 1.95
a) Biological data taken from ref. 21, b) biological data taken from ref. 22, c) biological data were obtained by the SRB method and the synthesis was reported in ref. 11, d ) 2log molar concentration, e) calculated Log P value was obtained from the Sybyl 6.3 program.
21.4%) in most cases. We initially analyzed 43 compounds
and obtained Eqs. (1)—(5). Among these equations, Eq. (1),
which was derived from the overlapping of the compounds
on conformer 1 as for a template structure, was the most
sig-nificant. On the other hand, Eqs. (4) and (5) were obtained
from conformers 8 and 12, respectively, which gave poor
sta-tistical results. We assumed that conformer 1 is the active
form showing cytotoxicity. As depicted in Table 2,
con-former 1 has 41.6° (t 1) and 47.3° (t 2) torsion angles. The
calculated pIC
50values in Table 1 were derived from Eq. 1.
Discussion
The application of CoMFA to a structurally varied set of
43 antitumor agents resulted in a reasonable 3-D QSAR
model. Figures 2 and 3 represent the major steric and
electro-static potential contour maps drawn according to Eq. (1) in
Table 3, respectively. The green zone is more important and
located around the A and B rings of the stilbene derivatives
according to the higher activity of the molecules. That area
indicates regions where submolecular bulk is well
accommo-dated with an increase in cytotoxicity, whereas the yellow
areas indicate regions where the submolecular bulk is
unfa-Table 2. Torsion Angle and Energy of Lead Template 1pNo. of
t 1 t 2 Energy Minimized energy
a)
conformer (kcal/mol) (kcal/mol)
1 2150 2120 17.70 16.845b) 2 150 150 17.73 15.940c) 3 30 2120 17.74 16.717d ) 4 150 260 17.80 16.940 5 60 2150 17.95 16.717 6 30 60 17.96 16.926 7 30 2150 18.03 16.717 8 60 30 18.05 16.782e) 9 30 30 18.19 16.926 10 60 60 18.27 16.782 11 2120 2120 18.27 16.845 12 60 2120 18.34 16.750f ) 13 120 260 18.42 16.940 14 2150 2150 18.45 16.845 15 260 260 18.47 16.880 16 2120 2150 18.47 16.845 17 2150 30 18.63 17.560 18 2150 60 18.63 17.560 19 260 150 18.65 17.480 20 2120 30 18.70 17.560
Torsional angles in degree are defined with notations as follows: t 1: C1-C2-C3-C4, t 2: C3-C4-C5-C6. a) Energy minimized by the Tripos force field using the Gasteiger-Huckel charge. b) t 1: 41.6°, t 2: 47.3°; c) t 1: 243.8°, t2: 244.1°; d) t1: 40.4°, t2: 42.2°; e) t 1: 44.1°, t 2: 44.2°; f ) t 1: 43.6°, t 2: 42.2°.
Table 3. CoMFA Correlation Statistics for Stilbenes (n543)
Contribution (%)
Conformer q2 r2 s m Equation No.
st. el. cLog P 1 0.640 0.958 0.191 5 40.0 41.3 18.7 2.42310.8723cLog P 1 2 0.632 0.921 0.260 4 33.3 45.3 21.4 2.55710.8283cLog P 2 3 0.591 0.922 0.259 4 38.6 41.1 20.3 2.41810.8483cLog P 3 8 0.527 0.928 0.249 4 42.3 39.3 18.4 2.62710.8003cLog P 4 12 0.549 0.917 0.267 4 37.3 42.5 20.2 2.35110.8183cLog P 5
Table 4. CoMFA Correlation Statistics Based on the X-Ray Structure of Combretastatin A-4 as a Lead Template Contribution (%) Alignment q2 r2 s m Equation st. el. cLog P Reg 0.565 0.946 0.219 5 42.4 38.0 19.6 2.33110.8893cLog P Auto 0.513 0.913 0.274 4 37.6 43.9 18.4 2.67610.7693cLog P q2 : cross-validated R square, r2
: conventional R square, s: standard deviation, m: number of optimum components, st.: steric, el.: electrostatic, Reg: region defined manually to give the region as 16318314 Å (X5211 to 5, Y527 to 11, Z5210 to 4), Auto: region defined automatically to give the region as 19322322 Å (X5214 to 5, Y5210 to 12,
Z5212 to 10).
Chart 3. Template Molecules for Molecular Superposition
Chart 4. Structue of Combretastatin A-1. t 1: C1–C2–C3–C4, t 2; C3–C4– C5–C6, t 1: 258.1°, t2: 215.7°
vorable for activity to occur. As can be seen in Fig. 2, it is
well explained that bulky substitution at the para-position of
ring B such as OPr, Br, Cl, and OMe groups contributes to
On the other hand, yellow contour regions that extend
roughly perpendicular to the previously described green
re-gion accommodate the heteroaromatic ring position instead
of ring B, which is the same as in trans-configuration
com-pounds. A small steric yellow region of the upper area of the
double bond external to the green region also suggests that
the dimensions of these substituents cannot be too large or it
will render the compound inactive (i.e., 3e). This
corre-sponds to the spatial positions that do not contain
heteroaro-matic compounds such as 1l—o, 2l, and 3f.
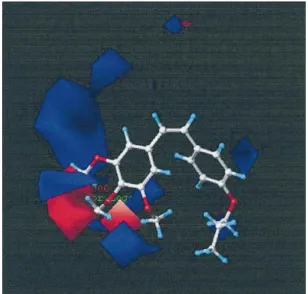
The red area indicates regions where the more negative
electrostatic interaction with the receptor increases the
activ-ity, whereas the blue areas show regions where the reverse is
the case. In a contour map, a positive electrostatic-potential
region favoring activity appears on rings A and B. Its region
is located in the outer zone of the trimethoxy group on ring
A, whereas a negative electrostatic region favorable to
activ-ity is located at the oxygen atoms of trimethoxy groups on
ring A. Compound 8 with a carboxyl group on the double
bond is less active because the electronegative function is
ex-tended away from the favored region of interaction.
Com-pounds that have heteroaromatic rings such as 1l, 1m, 1n,
and 3f are less active because the rings contain electron-rich
atoms that seem to not contribute to increased activity and
are extended away from the favored region of interaction.
According to this binding hypothesis, red polyhedra,
indicat-ing areas where high electron density within the ligands
en-hances affinity, overlap the aromatic electron density of the
most active compounds. In compounds 1a, 1b, 1f, and 3c,
with respect to the trimethoxy moiety, a red electrostatic
con-tour and a green steric concon-tour are present. Both of these
re-gions express the preference of the trimethoxy group over the
dimethoxy group at the active site. The most active
com-pounds could also indicate favorable steric interactions of
these structural elements with a large hydrophobic pocket at
the active site. The descriptive characteristics of the present
model are good and the plot of the calculated versus the
ob-served pIC
50for the CoMFA of the 43 compounds is shown
in Fig. 1. The reliability of a QSAR model is usually
evalu-ated by testing its ability to predict the biological activity of
newly designed molecules acting on the same biological
sys-tem. In this study, the CoMFA model not only showed that
the cytotoxicities of the 43 combretastatin derivatives had an
excellent correlation with the electrostatic and steric field,
but also provided an important pharmacophore model that
could be useful in depicting the receptor sites
three-dimen-sionally.
Acknowledgment This work was supported by a research grant from the Ministry of Health and Welfare of Korea (00-PJ1-PG1-CH15-0002). References
1) Pettit G. R., Singh S. B., Hamel E., Lin C. M., Alberts D. S., Garcia-Kendal D., Experientia, 45, 209—211 (1989).
Fig. 1. Plot of the Calculated versus Observed pIC50 for the CoMFA Analysis of the 43 Compounds Aligned According to Eq. (1) in Table 4
Fig. 2. Steric Contour Map from the CoMFA Mode for Combretastatins
Favoring activity: green, bulky group; yellow, less bulky group.
Fig. 3. Electrostatic Contour Map from the CoMFA Mode for Combretas-tatins
2) Bai R., Pettit G. R., Hamel E., Biochem. Pharmacol., 39, 1941—1949 (1990).
3) Ferrigni N. R., McLaughlin J. L., Powell R. G., Smith C. R., J. Nat. Prod., 47, 347—352 (1984).
4) Gill M. T., Bajaj R., Chang C. J., Nichols D. E., McLaughlin J. L., J. Nat. Prod., 50, 36—40 (1987).
5) Lin C. M., Singh S. B., Chu P. S., Dempcy R. O., Schmidt J. M., Pettit G. R., Hamel E., Mol. Pharmacol., 34, 200—208 (1988).
6) McGown A. T., Fox B. W., Cancer Chemother. Pharmacol., 26, 79— 81 (1990).
7) Jordan A., Hadfield J. A., Lawrence N. J., McGown A. T., Med. Res. Rev., 18, 259—296 (1998).
8) Ter Haar E., Rosenkranz H. S., Hamel E., Day B. W., Bioorg. Med. Chem., 4, 1659—1671 (1996).
9) Nandy P., Banerjee S., Gao H., Hui M. B., Lien E., J. Pharmaceutical. Res., 8, 776—781 (1991).
10) Brown M. L., Rieger J. M., Macdonald T. L., Bioorg. Med. Chem., 8, 1433—1441 (2000).
11) Kim S., Ko H., Park J. E., Jung S., Lee S. K., Chun Y.-J., J. Med. Chem., 45, 160—164 (2002).
12) Cramer R. D. III, Patterson D. E., Bunce J. D., J. Am. Chem. Soc., 110, 5959—5967 (1988).
13) Raghavan K., Buolamwini J. K., Fesen M. R., Pommier Y., Kohn K.
W., Weinstein J. N., J. Med. Chem., 38, 890—897 (1995).
14) Rubinstein L. V., Shoemaker R. H., Paull K. D., Simon R. M., Tosini S., Skehan P., Scudiero D. A., Monks A., Boyd M. R., J. Natl. Cancer Inst., 82, 1113—1118 (1990).
15) Skehan P., Storeng R., Scudiero D., Monks A., McMahon J., Vistica D., Warren J. T., Bokesch H., Kenney S., Boyd M. R., J. Natl. Cancer Inst., 82, 1107—1112 (1990).
16) Alley M. C., Scudiero D. A., Monks A., Hursey M. L., Czerwinski M. J., Fine D. L., Abbott B. J., Mayo J. G., Shoemaker R. H., Boyd M. R., Cancer Res., 48, 589—601 (1988).
17) Mossman T., J. Immunol. Meth., 65, 55—63 (1983).
18) Wu F. Y. H., Liao W. C., Chang H. M., Life Sci., 52, 1797—1804 (1993).
19) The Sybyl program (Version 6.3) was supplied by Tripos Associates, 1699 South Hanley Road, Suite 303, St. Louis, Missouri 63144, U.S.A.
20) Pettit G. R., Singh S. B., Niven M. L., Hamel E., Schmidt J. M., J. Nat. Prod., 50, 119—131 (1987).
21) Cushman M., Nagarathnam D., Gopal D., He H.-M., Lin C. M., Hamel E., J. Med. Chem., 35, 2293—2306 (1992).
22) Cushman M., Nagarathnam D., Gopal D., Chakraborti A. K., Lin C. M., Hamel E., J. Med. Chem., 34, 2579—2588 (1991).