R E S E A R C H A R T I C L E
Open Access
The relationship between students
’
perception of the educational environment
and their subjective happiness
Dong-Mi Yoo
1and Do-Hwan Kim
2*Abstract
Background: Happiness, a subjective judgment about one’s quality of life, is influenced by environmental factors and should be considered as an important goal of medical education, which should support each learner’s development as a person as well as a professional. However, although several studies have reported on the correlation between Dundee Ready Educational Environment Measure (DREEM) scores and students’ academic achievement, few have investigated the relationship between DREEM scores and students’ subjective happiness. This study examined different perceptions of the educational environment between phases of the curriculum and determined which DREEM subscales affect the overall level of happiness.
Methods: We used the Korean version of the DREEM questionnaire and a single item measure of happiness on a scale of 0 to 10. First we analyzed student perceptions of the educational environment according to their demographic characteristics using independent sample t-tests and one-way analysis of variance. A multiple regression analysis was performed to reveal which subscales affect the overall level of happiness while controlling for grade point average (GPA) and other demographic characteristics.
Results: The subjects were 239 medical school students across all stages of the curriculum. The students’ overall perception was more positive for the educational environment during Phase 3 (clerkship) than Phase 1 (pre-medical). Among the DREEM subscales, this difference was especially prominent in Students’ Perception of Learning and Students’ Academic Self-Perceptions. In contrast, no difference in the subjective perception of happiness was found between phases. The effect of GPA on happiness became insignificant under the control of other variables, but the influence of the Students’ Social Self-Perceptions (SSSP) subscale remained significant.
Conclusions: The students’ overall perception of the educational environment was more positive during the clerkship period than in the pre-medical period. Based on our finding that the SSSP correlates significantly with subjective happiness, we suggest that institutions promote not only students’ academic development but also their happiness by fostering an appropriate educational environment.
Keywords: Dundee ready educational environment measure, Educational environment, Undergraduate medical education, Happiness, Academic achievement
© The Author(s). 2019 Open Access This article is distributed under the terms of the Creative Commons Attribution 4.0 International License (http://creativecommons.org/licenses/by/4.0/), which permits unrestricted use, distribution, and reproduction in any medium, provided you give appropriate credit to the original author(s) and the source, provide a link to the Creative Commons license, and indicate if changes were made. The Creative Commons Public Domain Dedication waiver (http://creativecommons.org/publicdomain/zero/1.0/) applies to the data made available in this article, unless otherwise stated.
* Correspondence:[email protected]
2Department of Medical Education, Hanyang University College of Medicine,
222 Wangsimni-ro, Seongdong-gu, Seoul 04763, Republic of Korea Full list of author information is available at the end of the article
Background
In the era of competency-based medical education (CBME), fostering a “competent doctor” who has inte-grated knowledge, skills, and attitudes aligned with the health needs of the population is an important goal of undergraduate medical education (UME) [1, 2]. How-ever, despite the advantages of CBME, several concerns have been raised recently about its negative effects on individual learners, such as burnout among medical stu-dents [3]. One possible reason for those effects is that the newly emphasized competencies act as drivers of stress and burnout because they’ve been added to an already overcrowded curriculum [4]. The alarming rate of burnout and depressive symptoms among practicing physicians and medical students, which continues to in-crease, indicates that the problem has not been effect-ively addressed [5–7], although CBME might not be its only cause.
Thus, it has been argued that fostering so-called“good doctors” who have adequate knowledge, skills, and atti-tudes cannot be the sole aim of medical education [8]. Situated learning theory argues that merely acquiring medical knowledge and skills is insufficient for the for-mation of an identity [9, 10]. Given that all students manage multiple identities [11], medical education has to help learners integrate their personal and professional development [4, 12]. But personal development often holds only a secondary position in the curriculum [13] or competency domain [14]. In this context, it has been claimed that medical education should work to generate doctors who are both good and happy, rather than one to the exclusion of the other [15].
But what does it mean to be a “happy doctor” beyond mere rhetoric? First, existing studies of happiness gener-ally define it as a“global evaluation of [an] individual’s life quality according to their own criteria” [16]. It conceptu-ally overlaps with quality of life (QOL) and subjective well-being, sharing physical, psychological, social, and en-vironmental aspects as common components [16,17]. For medical students, Dunn et al. explained that well-being is an outcome that combines personal factors being repre-sented as a reservoir and environmental factors expressed as positive and negative input [18]. They also indicated that the influence of a particular input is not fixed; the same stressor can be perceived differently depending on a learner’s past experience or current state [18].
If happiness can be understood as a subjective judg-ment influenced by environjudg-mental factors, then medical students’ happiness will be affected by the educational environment, which makes up the major physical, tem-poral, and relational portions of their lives. More im-portant, similar to the varying effects of inputs and stressors, it could be that students’ perceptions of the educational environment, rather than the environment
itself, actually influence their happiness [4]. This possi-bility is consistent with the constructivist view that values learners’ autonomous and subjective construc-tions in learning based on their existing experiences, perceptions, and knowledge [10]. Indeed, the perception of an educational environment affects not only students’ academic achievement [19] but also the formation of their professional identity [20]. Therefore, researchers in the field of health-professions education have made con-siderable efforts to measure learners’ perceptions of the educational environment. Among the variety of available tools, the Dundee Ready Educational Environment Measure (DREEM) inventory has gained wide popularity and been deemed the most suitable tool for UME set-tings [21].
Numerous reports using DREEM have been made since its development [22]. However, important research areas remain untouched by existing research. First, ac-cording to a recently published systematic review [23], 52% of published research using DREEM originated in Asia while 40% originated in the Middle East. Although the majority of DREEM publications were from Asia, few studies using DREEM have been published from East Asian countries including China, Japan and South Korea, which have many medical schools [24] and that limits the applicability and generalizability of previous findings because the Asian sub-regions differ in their so-cial development, health care needs, and educational tra-ditions [25–27]. Furthermore, the specific structures used in medical education generally and the specifics of each educational stage vary widely from country to country [28]. For instance, the UME system in South Korea is distinguished from that of China or Japan, as well as from other parts of the globe, in using undergraduate-entry programs, and its first two years of pre-medical curriculum are fairly separate from the fol-lowing four-year medical curriculum [29].
Second, the relationship between DREEM scores and possible correlates beyond academic achievement needs further examination [23]. Indeed, no previous studies have used the term “happiness,” and only a few studies have reported on the correlation between DREEM scores and well-being, using constructs such as QOL and resili-ence, and those which have been conducted had their own limitations. For example, a possible association be-tween high DREEM scores and QOL was suggested by two studies conducted in a single country [30, 31], and although they successfully controlled for sex, age, and year, GPA, a main cause of mental distress among stu-dents [32], was not included as an independent variable. Similarly, another study that showed an association be-tween the Medical Student Well-Being Index and aca-demic self-perceptions, a subscale of DREEM, also failed to use appropriate objective data for academic
performance and included atypical subjects, such as international medical students [33].
Assuming that the educational environment influences the subjective happiness of medical students at all, re-searchers need to be able to specify which factors in that environment are relevant. Therefore, we first sampled and examined overall DREEM scores from students across all stages of the curriculum at a medical school in South Korea. Subsequently, to determine which sub-scales of DREEM affected the overall level of happiness, we investigated the relationship between the subscales and happiness while controlling for GPA and other demographic characteristics.
Methods
Study design
The study is cross-sectional and follows the pragmatic research tradition. Regarding terminology, although two terms— educational environment and learning environ-ment — are often used interchangeably, we use only educational environment in this study because it can cover “everything that is happening in the medical school” [34]. Some environmental elements in medical school could be more relevant to subjective happiness than to learning and vice versa.
Setting
This study was conducted at the Eulji University School of Medicine (EUSOM), located in the city of Daejeon, South Korea. EUSOM is a six-year private medical school, and its curriculum is largely divided into three stages. Phase 1 corresponds to medical school year 1 (M1) and medical school year 2 (M2) and consists mainly of basic science courses, such as biology, chemis-try, and physics. Social sciences and humanities, com-monly considered as pre-medical requirements [35], are also taught during this phase. Phase 2 corresponds to M3 and M4, and most courses in this phase use an organ-based integrated curriculum to teach basic and clinical science. Phase 3 comprises M5 and M6 and uses a curriculum focused on a clinical clerkship at the affili-ated teaching hospital. Each year, the number of stu-dents per year level has remained around 45; in 2018, the total number of students was 281, with 47 M1 stu-dents, 51 M2 stustu-dents, 51 M3 stustu-dents, 43 M4 stustu-dents, 45 M5 students, and 44 M6 students.
Data collection
The survey was conducted from May to July, the latter half of the first semester of 2018. To collect data com-prehensively from all M1 to M6 students, the survey schedule was arranged based on the curricular schedule for each cohort. Prior to data collection, the purpose of the survey was explained, and written information was
provided. Each student could decide whether to take part in the survey. The Institutional Review Board waived the need for explicit consent from participants by considering return of the survey as consent to partici-pate. Of the total 281 students, 243 students initially submitted responses. If a response omitted only one item, it was included, and the missing item was replaced with the average value of the remaining items. However, if a response omitted more than one item, it was ex-cluded and considered an incomplete response. To col-lect demographic information about the participants, the survey asked for the students’ identification (ID) num-bers. For those who provided their ID number, we col-lected data such as their age, sex, and GPA from the institutional database.
Instruments
Korean version of the Dundee ready educational environment measure
The Korean version of the DREEM survey was identical to the one used by the Korean Society for Medical Edu-cation in 2013 for a nationwide analysis of all medical schools in South Korea [36]. The survey contains 50 questions, of which nine are reverse-scored. Each item is measured on a five-point Likert scale from 0 (strongly disagree) to 4 (strongly agree). These 50 items can be analyzed on three levels: overall score, five subscales, and individual items. An open-ended question included in the original DREEM inventory was not included in this study.
In terms of subscales, the overall survey contains 12 questions reflecting Students’ Perception of Learning (SPL), 11 questions reflecting Students’ Perception of Teaching (SPT), eight questions about Students’ Aca-demic Self-Perceptions (SPP), 12 questions about Stu-dents’ Perceptions of Atmosphere (SPA), and seven questions about Students’ Social Self-Perceptions (SSSP). In this study, the three items that require at least some form of direct experience in a clinical setting, items number 6 (SPT), 11 (SPA), and 18 (SPT), were asked only of Phase 3 students because the EUSOM curricu-lum structure makes it difficult for Phase 1 and 2 stu-dents to provide valid responses to those questions.
Single-item measure of happiness
In this study, we used a single-item measure of happi-ness: “To what extent do you think you are living a happy life?” with an 11-point scale (0: not at all – 10: a great deal) based on a previous study that showed high temporal reliability and concurrent, convergent, and di-vergent validity of happiness measured by a single item [37]. Similarly, it has been reported that happiness can be validly and reliably measured using a single-item measure [17], and evidence shows that happiness,
subjective well-being, and QOL are interchangeable with one another in terms of their construct [16]. Further-more, in terms of response rates, studies have confirmed that shorter surveys generally provide better results [38]. Because the DREEM already requires answers to as many as 50 questions, we aimed to increase the compli-ance of participants by reducing the additional burden and using a single-item measure for happiness.
Data analysis
We included 239 valid responses in our analysis, after excluding four incomplete responses. In general, the DREEM scores are reported as the summation of each item. However, because students in Phases 1, 2, and 3 answered 47, 47, and 50 items, respectively, we used the mean score of items to accurately reflect the differences in the maximum total scores possible for each phase.
The overall and subscale scores were analyzed using parametric statistics. Despite controversy about the ap-propriateness of treating a Likert response as a number, it has been strongly argued that the summed score of many items is suitable for use with parametric methods as interval data [39]. The distribution of data was assessed using Kolmogorov-Smirnov tests and boxplots. Cronbach’s alpha was then calculated to check the in-ternal consistency of each subscale. We did not use Cronbach’s alpha for the overall DREEM score because it could inappropriately inflate the alpha value [40].
For the DREEM scores and subjective happiness measure-ments, we analyzed differences between the means using in-dependent sample t-tests or one-way analysis of variance (ANOVA). To reduce the risk of type 1 errors during mul-tiple pairwise comparisons, we used Tukey’s HSD test for post-hoc comparison of the ANOVA results [41,42]. Pear-son’s correlation coefficients were calculated to examine the univariate relationships between variables. A multiple re-gression analysis was performed to examine the influence of the five DREEM subscales and GPA while controlling for demographic factors such as age and sex. P-values of less than 0.05 were considered statistically significant.
To interpret the strength of the Pearson correlation coefficient, we followed Evans’ classification (0.00–0.19, very weak; 0.20–0.39, weak; 0.40–0.59, moderate; 0.60– 0.79, strong) [43]. Eta squared was used to calculate the effect size and was interpreted based on Cohen’s recom-mendation (0.01, small effect; 0.06, medium effect; 0.14, large effect) [44]. For all statistical analyses, we used IBM SPSS Statistics for Windows software (version 20; IBM Corp., Armonk, NY, USA).
Results
Demographic characteristics
Table 1 displays the demographic characteristics of the respondents. Overall, 243 responses were received from
the total of 281 students; 239 of those responses were considered valid, for an overall response rate of 85.1%. The 229 students (81.5%) who provided their student ID number with the survey and 52 students who did not re-spond to the survey showed no significant difference in gender (p = 0.870) or previous GPA (p = 0.994). How-ever, the two groups did differ significantly in age (p = 0.025 in independent sample t-test) and phase (p = 0.003 by Pearson’s chi square), which correlated significantly with age.
Of the 239 valid respondents, 61.9% were male, and the sex balance was similar throughout the phases. Phase 1, Phase 2, and Phase 3 accounted for 37.7, 33.1, and 29.3% of respondents, respectively. The average age of students differed significantly by phase (p < 0.001) but not by sex (p = 0.779) or the previous year’s GPA (p = 0.950).
Cross-sectional analysis of educational environment and subjective happiness
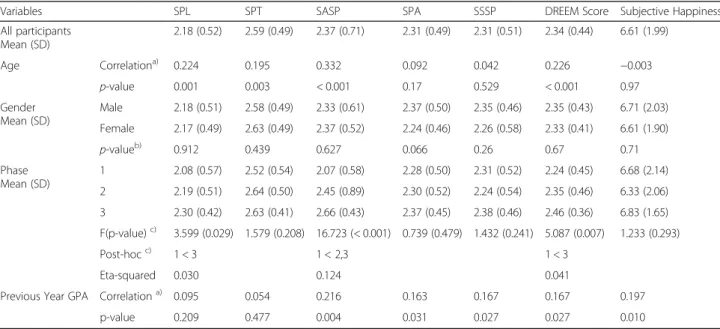
The DREEM and happiness scores were first investigated with regard to their relationships with demographic fac-tors (Table 2). The Cronbach’s alphas for the SPL, SPT,
SASP, SPA, and SSSP were 0.783, 0.753, 0.579, 0.745, and 0.573, respectively. The DREEM scores did not dif-fer by sex but those of Phase 3 students were signifi-cantly higher than those of Phase 1 students (p = 0.007). The DREEM scores also correlated significantly with age and GPA, but with weak or very weak strengths of ap-proximately 0.2. Only GPAs correlated significantly with subjective happiness, and that connection was weak; no other demographic variables demonstrated any signifi-cant association with subjective happiness.
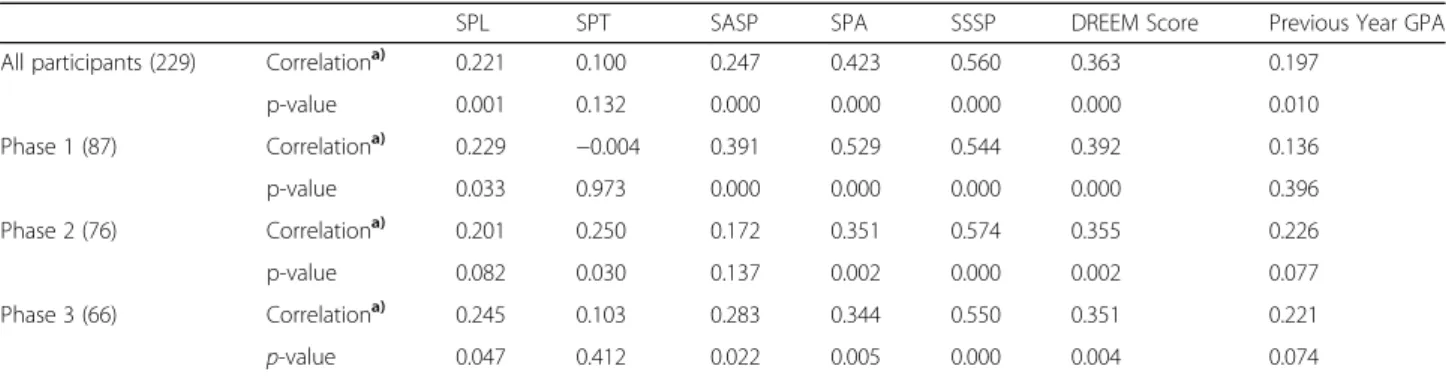
Table 3 shows the correlation between happiness and other variables. The total DREEM scores correlated sig-nificantly with happiness, regardless of phase (Phases 1, 2, 3, and all participants), but GPA lost its significance when analyzed by phase. When the DREEM was divided into subscales, the SSSP and SPA demonstrated rela-tively strong correlations, with values of 0.560 and 0.423, respectively. In particular, the correlations between the SSSP and happiness scores were above 0.5 in all phases.
Factors associated with subjective happiness
The multiple regression analysis produced a significant regression eq. (F (9, 158) = 17.892,p < 0.001) with an R2 of 0.505. When demographic variables were controlled, SSSP and SPT were the significant factors affecting hap-piness among the DREEM subscales, with SSSP (β = 0.628, p < 0.001) predicting happiness more powerfully than SPT (β = − 0.131, p < 0.027) (Table 4). Students’
demographic characteristics and the other DREEM sub-scales — SPL, SASP, and SPA — were not significant predictors of happiness.
Discussion
In this study, we used the DREEM to examine the envir-onment of a medical school and understand its relation-ship with the subjective happiness of students. The overall perceptions of the educational environment were more positive during the clerkship period than in the pre-medical period, and this tendency was especially prominent in the SPL and SASP subscales. By contrast, subjective happiness did not differ significantly between phases and had a stronger correlation with SPA and SSSP than with the other subscales. When other vari-ables (sex, age, phase, and GPA) were controlled, only
the influence of SSSP on subjective happiness remained significantly positive.
Overall and subscale DREEM scores
When we converted our mean DREEM scores by multi-plying them by 50, which is the total number of items, to make them comparable to previous studies that re-ported the summation of individual items, 112, 117.5, and 123 points were obtained for Phases 1, 2, and 3, re-spectively. According to the suggested guideline for in-terpretation [45], those converted DREEM scores from students in all three phases at EUSOM were categorized
Table 1 Demographic characteristic of the responders
Variables Phase 1 Phase 2 Phase 3 Total
respondents Valid Respondents Proportion
(frequency)
37.7%(90) 33.1%(79) 29.3%(70) 100%(239)
Response rate 91.8% 84.0% 78.7% 85.1%
Age (yr)a)Mean (SD) 20.7 (1.60)
(range: 19–26) 23.3 (2.21) (range: 21–34) 25.3 (2.13) (range: 23–34) 22.9 (2.78) (range: 19–34) Gendera)Proportion (frequency) Male 68.9%(62) 66.1%(41) 64.3%(45) 61.9%(148) Female 31.1%(28) 33.9%(21) 35.7%(25) 31.0%(74)
Year Proportion (frequency) Year 1: 52.2%(47), Year 2: 47.8%(43)
Year 3: 50.6%(40), Year 4: 49.4%(39)
Year 5: 41.4%(29), Year 6: 58.6%(41)
Previous Year GPAa), c)Mean (SD) 3.20 (0.69)b)
(range: 1.48–4.44)
3.22 (0.64) (range: 2.10–4.38) 3.23 (0.62) (range: 2.06–4.43)
3.22 (0.64) (range: 1.48–4.44) a) Fourteen students who participated in the survey but did not disclose their student ID numbers were excluded; b) Year 1 students who entered in 2018 were excluded due to their lack of previous GPA data at the time of analysis; c) EUSOM follows the A–F grading system (A + =4.5, A = 4, B + =3.5, B = 3, C + =2.5, C = 2, D + =1.5, D = 1, and F = 0). An A+ in all subjects produces a maximum GPA of 4.5, and an F in all subjects produces a minimum GPA of 0
Abbreviation: SD Standard Deviation, GPA Grade Point Average
Table 2 DREEM and happiness scores by demographic characteristics (univariate analysis)
Variables SPL SPT SASP SPA SSSP DREEM Score Subjective Happiness
All participants Mean (SD) 2.18 (0.52) 2.59 (0.49) 2.37 (0.71) 2.31 (0.49) 2.31 (0.51) 2.34 (0.44) 6.61 (1.99) Age Correlationa) 0.224 0.195 0.332 0.092 0.042 0.226 −0.003 p-value 0.001 0.003 < 0.001 0.17 0.529 < 0.001 0.97 Gender Mean (SD) Male 2.18 (0.51) 2.58 (0.49) 2.33 (0.61) 2.37 (0.50) 2.35 (0.46) 2.35 (0.43) 6.71 (2.03) Female 2.17 (0.49) 2.63 (0.49) 2.37 (0.52) 2.24 (0.46) 2.26 (0.58) 2.33 (0.41) 6.61 (1.90) p-valueb) 0.912 0.439 0.627 0.066 0.26 0.67 0.71 Phase Mean (SD) 1 2.08 (0.57) 2.52 (0.54) 2.07 (0.58) 2.28 (0.50) 2.31 (0.52) 2.24 (0.45) 6.68 (2.14) 2 2.19 (0.51) 2.64 (0.50) 2.45 (0.89) 2.30 (0.52) 2.24 (0.54) 2.35 (0.46) 6.33 (2.06) 3 2.30 (0.42) 2.63 (0.41) 2.66 (0.43) 2.37 (0.45) 2.38 (0.46) 2.46 (0.36) 6.83 (1.65) F(p-value)c) 3.599 (0.029) 1.579 (0.208) 16.723 (< 0.001) 0.739 (0.479) 1.432 (0.241) 5.087 (0.007) 1.233 (0.293) Post-hocc) 1 < 3 1 < 2,3 1 < 3 Eta-squared 0.030 0.124 0.041
Previous Year GPA Correlationa) 0.095 0.054 0.216 0.163 0.167 0.167 0.197
p-value 0.209 0.477 0.004 0.031 0.027 0.027 0.010
a) Pearson correlation; b) Independent sample t-test; c) Tukey’s HSD test was used to analyze data with equal variance
Abbreviation: SASP Students’ Academic Self-Perceptions, SPA Students’ Perceptions of Atmosphere, SPL Students’ Perception of Learning, SPT Students’ Perception of Teaching, SSSP Students’ Social Self-Perceptions
as “more positive than negative.” However, that range (101–150 points) contains more than 80% of the DREEM scores reported from various countries [23]. Ac-cording to a nationwide cross-sectional study in Japan, for example, 77 out of 80 medical schools were in the “more positive than negative” category [46].
Although the scores from all three phase fit into the same category, an increasing tendency was maintained through the phases from 1 to 3. This is in contrast to previous studies, which reported that lower DREEM scores were related to seniority [23] or found a u-shaped pattern with high scores at the beginning and end and low scores in the middle [40]. It is thus worth examining why the phase 1 students in this study gave significantly lower scores than the phase 2 and 3 students.
First, the characteristics of the EUSOM curriculum in phases 2 and 3 might have produced the difference. Ac-cording to previous studies, an integrated curriculum such as that used in phase 2 can induce more positive perceptions than a curriculum organized by discipline,
such as that used in phase 1 [47]. Furthermore, phase 3 emphasizes each student’s authentic engagement as a member of a clinical team in a hospital setting, whereas phases 1 and 2 mainly involve listening to didactic lec-tures in a classroom setting. We assume that those dif-ferences in the level of student participation improved the SPL and SASP subscale scores in phase 3 by posi-tively influencing on that phase’s study-centeredness of education and academic self-efficacy of students [48]. In-deed, student perceptions of their level of engagement, though not measured in DREEM, have been suggested as a key factor in determining the educational environ-ment [49].
Second, the current undergraduate medical education system in South Korea could also explain the improve-ment in DREEM scores from phase 1 to phase 3. The system is a unique model introduced during the colonization era of the early twentieth century [50], with phase 1 (pre-medical) operating in isolation from the fol-lowing four years of medical education. As a result, it
Table 3 Correlations between happiness and other variables
SPL SPT SASP SPA SSSP DREEM Score Previous Year GPA
All participants (229) Correlationa) 0.221 0.100 0.247 0.423 0.560 0.363 0.197
p-value 0.001 0.132 0.000 0.000 0.000 0.000 0.010 Phase 1 (87) Correlationa) 0.229 −0.004 0.391 0.529 0.544 0.392 0.136 p-value 0.033 0.973 0.000 0.000 0.000 0.000 0.396 Phase 2 (76) Correlationa) 0.201 0.250 0.172 0.351 0.574 0.355 0.226 p-value 0.082 0.030 0.137 0.002 0.000 0.002 0.077 Phase 3 (66) Correlationa) 0.245 0.103 0.283 0.344 0.550 0.351 0.221 p-value 0.047 0.412 0.022 0.005 0.000 0.004 0.074 a) Pearson correlation
Abbreviation: SASP Students’ Academic Self-Perceptions; SPA Students’ Perceptions of Atmosphere, SPL Students’ Perception of Learning, SPT Students’ Perception of Teaching; SSSP Students’ Social Self-Perceptions
Table 4 Multiple regression analysis
Dependent Variable Independent Variables
Unstandardized coefficient Standardized coefficient t
p-value
Adj R2 (F)
B Standard error β
Subjective Happiness (Constant) −2.097 1.557 −1.347 0.180 0.477 (17.892)
Gender (Female) 0.350 0.257 0.084 1.365 0.174
Age 0.107 0.059 0.136 1.821 0.070
Phase −0.074 0.206 −0.029 −0.361 0.719
Previous Year GPA 0.257 0.189 0.082 1.361 0.175
SPL −0.557 0.393 −0.131 −1.419 0.158
SPT −0.819 0.366 −0.183 −2.240 0.027
SASP 0.636 0.334 0.181 1.905 0.059
SPA 0.528 0.397 0.133 1.331 0.185
SSSP 2.394 0.300 0.628 7.993 0.000
Abbreviation: SASP Students’ Academic Self-Perceptions, SPA Students’ Perceptions of Atmosphere, SPL Students’ Perception of Learning, SPT Students’ Perception of Teaching, SSSP Students’ Social Self-Perceptions
has long been argued that students suffer from deterior-ating academic motivation, study habits, and professional identity formation during phase 1 [29]. The lower SPL and SASP scores, which are the subscales most directly related to academic and professional development, seem to reflect this current state of pre-medical education, which also contributed greatly to the lower overall DREEM scores from phase 1 students.
Subjective happiness and DREEM scores
Interestingly, in contrast to the DREEM scores, subject-ive happiness did not differ between phases. If the sig-nificant difference in the DREEM scores reflects differences between the pre-medical and clinical phases, this result suggests that more positive perceptions of the educational environment do not necessarily guarantee happier students. In other words, although DREEM scores might reflect professional development into the “good doctors” expected by society, medical schools should also pay keen attention to students’ personal de-velopment to ensure that they grow into“happy doctors” as well.
In this regard, it is worth mentioning that among the subscales, only SSSP had a significant positive influence on subjective happiness when other variables were con-trolled in the multiple regression analysis (Table 4). To put it another way, SPL and SASP, which are more dir-ectly related to schoolwork, exerted only a minimal ef-fect on subjective happiness. This finding — social self-perception plays a primary role in the subjective happi-ness of medical students — is consistent with previous studies that highlighted the importance of social support in the general population [51].
However, that finding contradicts a study from a Bra-zilian medical school that found that all subscale scores and the total DREEM score were associated with QOL [31], which is regarded as interchangeable with happi-ness [16]. This difference could result from differences in the criteria used to judge happiness in the two cul-tures [52].]. Researchers have shown that East Asian cul-tures tend to focus on interpersonal aspects in the perception of happiness [53, 54]. Similarly, in a collectivism-oriented culture, the importance of an indi-vidual’s social acceptance tends to be prominent [55] and could explain why the SSSP and subjective happi-ness had the strongest correlation in our results.
Therefore, setting the pursuit of academic develop-ment as the solitary goal of medical education might not be desirable, particularly if it is weighted heavily toward individual achievement, because improving subjective well-being through higher academic achievement is un-certain; we did not find that the contribution of GPA to subjective happiness was significant in our multiple re-gression. Instead, the stress that comes from acquiring a
higher GPA can trigger burnout [18], which could hin-der the development of professional attitudes and values [56]. The limited connection between a high GPA and happiness might also be explained by EUSOM’s use of the A–F grading system, which has been shown to cause distress and anxiety regardless of one’s level of achieve-ment [4].
In summary, as the title of one Korean film put it, “Happiness Does Not Come in Grades (Woo-suk Kang, 1989).” Rather, our findings indicate that social relation-ships are a more important factor. Our findings clearly suggest that students’ subjective happiness levels and their perceptions of the educational environment cannot be easily or straightforwardly changed by aiming for higher academic achievement.
Limitations
This study had several limitations. First, its generalizability could be limited by its cross-sectional design and its use of data from a single university. The general characteristics of EUSOM students, as well as the specific institutional and cultural context, might have affected the results of this study. Although our response rate was 85.1%, it is possible that the non-responders in phase 3 had a more negative perception of the educa-tional environment than the responders, which is why they chose not to participate in the survey. Second, in terms of the collected data, the Cronbach’s alphas of SASP and SSSP, 0.579 and 0.573, respectively, were rela-tively low. However, it is well known that Cronbach’s alpha is sensitive to the number of items [57], and these two subscales were composed of eight and seven items, respectively, which is fewer than the other subscales. Third, as a quantitative measure, the DREEM has the clear advantage of enabling intra- and inter-medical school comparisons, but the weakness of the instrument itself also needs to be considered. Concerns have been raised about the psychometric robustness of the DREEM, such as its internal consistency and construct validity, as well as the need to revise items [58,59]. Our findings of lower Cronbach’s alpha values for the SASP and SSSP subscales could be partly attributable to this psychometric weakness of the DREEM. In addition, its insufficient validity evidence has been pointed out as a weakness, especially considering its popularity [60]. Fourth, this research could not determine causal rela-tionships. For example, in the relationship between DREEM scores and happiness, either side could be the cause of the other, at least partly, or both could be caused by a third, unstudied variable.
Implications for medical educators and future research
This study has the following implications for educational practice and future research. First, based on the overall
DREEM scores, this study suggests that improving the educational environment for junior students, rather than seniors, needs to be a priority. This period should be given particular consideration because the pre-medical period comprises a significant portion of UME, and the formation of a professional identity starts at the begin-ning of medical education. Moreover, it has been argued that junior students in medical schools tend to have higher expectations for educational responsibility than senior students [61], which might have contributed to the lower DREEM scores.
For further study, both global and interdisciplinary re-search is needed to deepen understanding about longitu-dinal changes in overall DREEM scores across educational years. Most of all, the upward sloping ten-dency in the DREEM scores that we found might not be a representative pattern. The previous literature has shown mixed results, including a downward slope [23] that suggests that junior students gave higher ratings than seniors and a u-shaped pattern in which negative perceptions got stronger in the middle of the curriculum [40]. Therefore, it might be premature to conclude that any universal or prescribed tendency exists in how stu-dents in the health professions change their perceptions throughout the curriculum. A comparison study might be able to identify the main causes for the differences found between institutions or disciplines.
At the local and regional level, studies are needed to explore the possible influence of the East Asian, national, and institutional contexts, possibly by using a mixed method or qualitative approach that can sidestep the limitations of the quantitative approach [62]. Looking at the individual items included in each subscale might also be useful; this study analyzed survey results only at the subscale and overall level. To interpret at the item level, it has been recommended that researchers focus on the ratio of three categories — strongly disagree/disagree, unsure, and strongly agree/agree— rather than the aver-age scores because a skewed or bimodal distribution often occurs at the item level [63].
Second, the relationships among the DREEM scores, GPA, and happiness suggest that investment in and sup-port for students’ achievements need to be balanced with investments to promote their positive social perceptions and relationships. In the short run, it is well known that social relationships are very closely related to profes-sional identity formation in medical schools [64]. In the long term, skills in maintaining supportive relationships both personally and professionally are critical to prevent burnout among physicians [65].
To attain a balance between academic achievement and social relationships, medical schools need to shift their view of learning from an“acquisition” model centered on individuals and independence to a “participation” model
that emphasizes social relationships and interactions [66]. That change is consistent with situated learning theory, a perspective of medical education that considers learning to be“inextricably tied to its context and to the social rela-tions” [10]. In practice, one recommended approach in UME could be the introduction of a pass–fail grading sys-tem to promote a collaborative environment among stu-dents. The fact that such a grading system would facilitate students’ well-being without decreasing their academic performance [67] suggests that cultivating doctors who are both happy and competent is not an impossible goal.
For future study, exploring variables that correlate sig-nificantly with DREEM scores would be an important task. Further understanding the “relationship with other variables,” as one of the five sources of validity evidence, will strengthen the DREEM [60]. In addition, as men-tioned earlier, most reported DREEM scores fall into the category “more positive than negative,” in which scores can vary by as much as 50 points. Investigating the rela-tionship between the DREEM and other variables will help establish the practical meaning of differences in DREEM scores that are masked within that category or offered as mere numbers.
Conclusion
To understand the relationship between DREEM scores and the subjective happiness of students in a single medical school, we first analyzed the scores according to students’ phase in the curriculum and personal charac-teristics, and then we examined the factors that influ-enced happiness. Significant differences in the DREEM scores over time were identified, whereas no difference was identified for subjective happiness. The effects of GPA on happiness disappeared when other variables were controlled; only the influence of the SSSP remained significantly positive among the five subscales. Putting these results together, our study suggests that institu-tions need to work on using an integrated approach throughout their curriculum and creating an appropriate educational environment that promotes not only stu-dents’ academic development but also their personal de-velopment and social relationships.
Abbreviations
CBME:Competency-Based Medical Education; DREEM: Dundee Ready Educational Environment Measure; EUSOM: Eulji University School of Medicine; GPA: Grade Point Averages; QOL: Quality of Life; SASP: Students’ Academic Self-Perceptions; SPA: Students’ Perceptions of Atmosphere; SPL: Students’ Perception of Learning; SPP: Students’ Academic Self-Perceptions; SPT: Students’ Perception of Teaching; SSSP: Students’ Social Self-Perceptions; UME: Undergraduate Medical Education
Acknowledgements
The authors would like to thank the students of the Eulji University who answered the survey for this study.
Authors’ contributions
DHK and DMY conceived the design of the study and drafted the initial manuscript. DHK contributed to the construction of survey and analysis of the data. DMY made contribution to the interpretation of the data and revised the initial manuscript. All authors read, critically reviewed, and approved the final manuscript.
Funding
This work was supported by the research fund of Hanyang University (HY-2019).). This funding body had no role in the design of the study; collection, analysis, and interpretation of data; or in preparation of the manuscript. Availability of data and materials
Data and materials used during the study are available from the corresponding author on reasonable request.
Ethics approval and consent to participate
This study was approved by the Institutional Review Board of EUSOM (EUIRB2018–101). The Institutional Review Board waived the need for explicit consent from participants.
Consent for publication Not applicable. Competing interests
The authors declare that they have no competing interests. Author details
1
Department of Medical Education, College of Medicine, The Catholic University of Korea, Banpo-daero 222, Seocho-gu, Seoul 06591, Republic of Korea.2Department of Medical Education, Hanyang University College of Medicine, 222 Wangsimni-ro, Seongdong-gu, Seoul 04763, Republic of Korea. Received: 9 May 2019 Accepted: 23 October 2019
References
1. Krupat E. Critical thoughts about the core entrustable professional activities in undergraduate medical education. Acad Med. 2018;93(3):371–6. 2. Carraccio CL, Englander R. From Flexner to competencies: reflections on a
decade and the journey ahead. Acad Med. 2013;88(8):1067–73.
3. Holmboe ES. Competency-based medical education and the ghost of Kuhn: reflections on the messy and meaningful work of transformation. Acad Med. 2018;93(3):350–3.
4. Dyrbye L, Shanafelt T. A narrative review on burnout experienced by medical students and residents. Med Educ. 2016;50(1):132–49. 5. Rotenstein LS, Torre M, Ramos MA, Rosales RC, Guille C, Sen S, Mata DA.
Prevalence of burnout among physicians: a systematic review. JAMA. 2018; 320(11):1131–50.
6. IsHak W, Nikravesh R, Lederer S, Perry R, Ogunyemi D, Bernstein C. Burnout in medical students: a systematic review. Clin Teach. 2013;10(4):242–5. 7. Rotenstein LS, Ramos MA, Torre M, Segal JB, Peluso MJ, Guille C, Mata DA.
Prevalence of depression, depressive symptoms, and suicidal ideation among medical students: a systematic review and meta-analysis. JAMA. 2016;316(21):2214–36.
8. Jung HY, Kim JW, Lee S, Yoo SH, Jeon JH, Kim TW, Shin MS. A study of core humanistic competency for developing humanism education for medical students. J Korean Med Sci. 2016;31(6):829–35.
9. O’Brien BC, Battista A. Situated learning theory in health professions education research: a scoping review. Adv Health Sci Educ. 2019:1–27. 10. Mann KV. Theoretical perspectives in medical education: past experience
and future possibilities. Med Educ. 2011;45(1):60–8.
11. Monrouxe LV. Identity, identification and medical education: why should we care? Med Educ. 2010;44(1):40–9.
12. Wald HS, Anthony D, Hutchinson TA, Liben S, Smilovitch M, Donato AA. Professional identity formation in medical education for humanistic, resilient physicians: pedagogic strategies for bridging theory to practice. Acad Med. 2015;90(6):753–60.
13. Riley SC. Student selected components (SSCs): AMEE guide no 46. Med Teach. 209;31(10):885–894.
14. Englander R, Cameron T, Ballard AJ, Dodge J, Bull J, Aschenbrener CA. Toward a common taxonomy of competency domains for the health professions and competencies for physicians. Acad Med. 2013;88(8):1088–94.
15. You H. Two aims of medical humanities education: good doctors and happy doctors. Korean J Med Rev. 2015;17(2):51–6.
16. Medvedev ON, Landhuis CE. Exploring constructs of well-being, happiness and quality of life. Peer J. 2018;6:e4903.
17. Ali A, Ambler G, Strydom A, Rai D, Cooper C, McManus S, Hassiotis A. The relationship between happiness and intelligent quotient: the contribution of socio-economic and clinical factors. Psy Med. 2013;43(6):1303–12. 18. Dunn LB, Iglewicz A, Moutier C. A conceptual model of medical student
well-being: promoting resilience and preventing burnout. Acad Psych. 2008; 32(1):44–53.
19. Wayne SJ, Fortner SA, Kitzes JA, Timm C, Kalishman S. Cause or effect? The relationship between student perception of the medical school learning environment and academic performance on USMLE step 1. Med Teach. 2013;35(5):376–80.
20. Weaver R, Peters K, Koch J, Wilson I.‘Part of the team’: professional identity and social exclusivity in medical students. Med Educ. 2011;45(12):1220–9. 21. Soemantri D, Herrera C, Riquelme A. Measuring the educational
environment in health professions studies: a systematic review. Med Teach. 2010;32(12):947–52.
22. Roff S, McAleer S, Harden RM, Al-Qahtani M, Ahmed AU, Deza H, Groenen G, Primparyon P. Development and validation of the Dundee ready education environment measure (DREEM). Med Teach. 1997;19(4):295–9. 23. Chan CYW, Sum MY, Tan GMY, Tor PC, Sim K. Adoption and correlates of
the Dundee ready educational environment measure (DREEM) in the evaluation of undergraduate learning environments–a systematic review. Med Teach. 2018;40(12):1240–7.
24. Duvivier RJ, Boulet JR, Opalek A, Van-Zanten M, Norcini J. Overview of the world's medical schools: an update. Med Educ. 2014;48(9):860–9. 25. Frambach JM, Driessen EW, Chan LC, van der Vleuten CP. Rethinking the
globalisation of problem-based learning: how culture challenges self-directed learning. Med Educ. 2012;46(8):738–47.
26. Kim DH, Yoon HB, Sung MS, Yoo DM, Hwang JY, Kim EJ, Shin JS. Evaluation of an international faculty development program for developing countries in Asia: the Seoul intensive course for medical educators. BMC Med Educ. 2015;15(1):224.
27. Lam TP, Lam YYB. Medical education reform: the Asian experience. Acad Med. 2009;84(9):1313–7.
28. Wijnen-Meijer M, Burdick W, Alofs L, Burgers C, ten Cate O. Stages and transitions in medical education around the world: clarifying structures and terminology. Med Teach. 2013;35(4):301–7.
29. Lee YM. It is time to reconsider the unnecessary division of premedical and medical studies. Korean J Med Educ. 2018;30(4):279–81.
30. Tempski P, Santos IS, Mayer FB, Enns SC, Perotta B, Paro HB, Guimaraes KB. Relationship among medical student resilience, educational environment and quality of life. PLoS One. 2015;10(6):e0131535.
31. Enns SC, Perotta B, Paro HB, Gannam S, Peleias M, Mayer FB, Silveira PS. Medical students’ perception of their educational environment and quality of life: is there a positive association? Acad Med. 2016;91(3):409–17. 32. Roh MS, Jeon HJ, Kim H, Han SK, Hahm BJ. The prevalence and impact of
depression among medical students: a nationwide cross-sectional study in South Korea. Acad Med. 2010;85(8):1384–90.
33. Yamada Y, Klugar M, Ivanova K, Oborna I. Psychological distress and academic self-perception among international medical students: the role of peer social support. BMC Med Educ. 2014;14(1):256.
34. Genn JM. AMEE medical education guide no. 23 (part 1): curriculum, environment, climate, quality and change in medical education–a unifying perspective. Med Teach. 2001;23(4):337–44.
35. Emanuel EJ. Changing premed requirements and the medical curriculum. JAMA. 2006;296(9):1128–31.
36. Park KH, Park JH, Kim S, Rhee J, Kim JH, Ahn YJ, Suh DJ. Students' perception of the educational environment of medical schools in Korea: findings from a nationwide survey. Korean J Med Educ. 2015;27(2):117–30. 37. Abdel-Khalek AM. Measuring happiness with a single-item scale. Soc Behav
Pers Int J. 2006;34(2):139–50.
38. Phillips AW, Reddy S, Durning SJ. Improving response rates and evaluating nonresponse bias in surveys: AMEE guide no. 102. Med Teach. 2016;38(3):217–28. 39. Norman G. Likert scales, levels of measurement and the“laws” of statistics.
40. Palmgren PJ, Sundberg T, Laksov KB. Reassessing the educational environment among undergraduate students in a chiropractic training institution: a study over time. J Chiropractic Edu. 2015;29(2):110–26. 41. McHugh ML. Multiple comparison analysis testing in ANOVA. Biochemia
Medica. 2011;21(3):203–9.
42. Kim HY. Statistical notes for clinical researchers: post-hoc multiple comparisons. Restorative Dent & Endo. 2015;40(2):172–6.
43. Evans JD. Straightforward statistics for the behavioral sciences. Pacific grove, CA: brooks/Cole; 1996.Cohen J. statistical power analysis for the behavioral sciences. 2nd ed. New York. L. Erlbaum Associates: Hillsdale, N.J; 1988. 44. Cohen J. Statistical power analysis for the behavioral sciences. 2nd ed. New
York. L. Erlbaum Associates: Hillsdale, N.J; 1988.
45. McAleer S, Roff S. A practical guide to using the Dundee ready education environment measure (DREEM). AMEE Med Educ Guide. 2001;23(5):29–33. 46. Tokuda Y, Goto E, Otaki J, Jacobs J, Omata F, Obara H, Takahashi O.
Undergraduate educational environment, perceived preparedness for postgraduate clinical training, and pass rate on the national medical licensure examination in Japan. BMC Med Educ. 2010;10(1):35.
47. Shehnaz SI, Sreedharan J. Students’ perceptions of educational environment in a medical school experiencing curricular transition in United Arab Emirates. Med Teach. 2011;33(1):e37–42.
48. Artino AR. Academic self-efficacy: from educational theory to instructional practice. Perspect Med Euc. 2012;1(2):76–85.
49. Tackett S, Shochet R, Shilkofski NA, Colbert-Getz J, Rampal K, Bakar HA, Wright S. Learning environment assessments of a single curriculum being taught at two medical schools 10,000 miles apart. BMC Med Educ. 2015; 15(1):105.
50. Onishi H. History of Japanese medical education. Korean J Med Educ. 2018; 30(4):283–94.
51. Lu L. Personal or environmental causes of happiness: a longitudinal analysis. J Social Psych. 1999;139(1):79–90.
52. Diener E, Oishi S, Ryan KL. Universals and cultural differences in the causes and structure of happiness: a multilevel review. Dordrecht: Springer; 2013. p. 153–76.
53. Uchida Y, Kitayama S. Happiness and unhappiness in east and west: themes and variations. Emotion. 2009;9(4):441.
54. Uchida Y, Norasakkunkit V, Kitayama S. Cultural constructions of happiness: theory and empirical evidence. J Happiness Stud. 2004;5(3):223–39. 55. Joy S, Kolb DA. Are there cultural differences in learning style? Int J Intercult
Relat. 2009;33(1):69–85.
56. Dyrbye LN, Massie FS, Eacker A, Harper W, Power D, Durning SJ, Shanafelt TD. Relationship between burnout and professional conduct and attitudes among US medical students. JAMA. 2010;304(11):1173–80.
57. Voss KE, Stem DE, Fotopoulos S. A comment on the relationship between coefficient alpha and scale characteristics. Market Lett. 2000;11(2):177–91. 58. Hammond SM, O'Rourke M, Kelly M, Bennett D, O'Flynn S. A psychometric
appraisal of the DREEM. BMC Med Educ. 2012;12(1):2.
59. Palmgren PJ, Brodin U, Nilsson GH, Watson R, Stenfors T. Investigating psychometric properties and dimensional structure of an educational environment measure (DREEM) using Mokken scale analysis–a pragmatic approach. BMC Med Educ. 2018;18(1):235.
60. Colbert-Getz JM, Kim S, Goode VH, Shochet RB, Wright SM. Assessing medical students’ and residents’ perceptions of the learning environment: exploring validity evidence for the interpretation of scores from existing tools. Acad Med. 2014;89(12):1687–93.
61. Bowen L, Marshall M, Murdoch-Eaton D. Medical student perceptions of feedback and feedback behaviors within the context of the“educational Alliance”. Acad Med. 2017;92(9):1303–12.
62. Lavelle E, Vuk J, Barber C. Twelve tips for getting started using mixed methods in medical education research. Med Teach. 2013;35(4):272–6. 63. Swift L, Miles S, Leinster SJ. The analysis and reporting of the Dundee ready
education environment measure (DREEM): some informed guidelines for evaluators. Creative Educ. 2013;4(05):340.
64. Wilson I, Cowin LS, Johnson M, Young H. Professional identity in medical students: pedagogical challenges to medical education. Teach Learn Med. 2013;25(4):369–73.
65. Zwack J, Schweitzer J. If every fifth physician is affected by burnout, what about the other four? Resilience strategies of experienced physicians. Acad Med. 2013;88(3):382–9.
66. Eichbaum Q. Acquired and participatory competencies in health professions education: definition and assessment in global health. Acad Med. 2017; 92(4):468–74.
67. Spring L, Robillard D, Gehlbach L, Moore Simas TA. Impact of pass/fail grading on medical students’ well-being and academic outcomes. Med Educ. 2011;45(9):867–77.
Publisher’s Note
Springer Nature remains neutral with regard to jurisdictional claims in published maps and institutional affiliations.