Analysis of Hydrogen Economy using Vensim
E.J. Jun, Y.H. Jeong and S.H. ChangDepartment of Nuclear and Quantum Engineering, KAIST 373-1, Daejeon 305-701, Korea [email protected]
1. Introduction
As oil price being boosted, people worry about the energy crisis. Hydrogen is strong candidate for the future energy carrier along with electricity. [1]
Hydrogen is the most common element in the world though it is not in pure form. Hydrogen can be produced from many energy sources such as fossil fuels, renewable and nuclear reactors. Nowadays hydrogen was produced mostly from the fossil fuels natural gas (48%), heavy oils and naphtha (30%) and coal (18%) and by electrolysis (4%) as a by-product of chlorine production.1 However, future energy sources should be
clean, cheap, and efficient. [2] Theoretically, renewable energy sources such as solar, wind, geothermal, ocean thermal energy through water electrolysis are considered as an ideal scenario for hydrogen economy. However, there are too many barriers – cost, availability etc. An important avenue for arriving at the hydrogen economy involves the use of nuclear energy as the primary energy-supply source. [3] Nuclear energy includes nuclear fission, breeder and fusion reactors. Then, how can we achieve the hydrogen economy? One of the possible answers is that hydrogen can be used as a transportation fuel. Use of hydrogen in the transport sector is a major challenge for hydrogen economy. To estimate the growth of hydrogen economy in Korea Vensim was used.
2. Analysis model
Vensim is a visual modeling tool. It is used to conceptualize, document, simulate, analyze and optimize models of dynamic system. And it builds simulation models from causal loop or stock and flow diagrams.
To estimate the growth of hydrogen economy, market should be defined. Market contains the industrial sector as well as transportation sector. However the magnitude is too small and already saturated, we can ignore it. To estimate the market size, oil cost, portion and hydrogen cost are needed. Portion means the percentage that the total number of consumers per number of consumers who select the hydrogen as a fuel. It can be determined by decision factor. Oil cost and hydrogen cost are consisted of two parts. One is operating cost and the other is capital cost. Each of them is also consisted of other factors. To use the hydrogen as a fuel FC (fuel cell) is needed. FC cost is followed learning
1 IAEA-TECDOC-1085, 03/15/02 on the internet
curve2[4] which was suggested by Haruki Tsuchiya and
Osamu Kobaysahi. Market size influences on infrastructure. Infrastructure decay is also considered. To run this model seed values are need. Seed market and seed infrastructure value are $ 2.5 10× 7 ,
depreciation time is 30 years.
Figure 1. Analysis model of hydrogen market in Vensim
0 5 10 15 20 25 30 0.0 0.2 0.4 0.6 0.8 1.0 1.2 1.4 1.6 1.8 2.0 2.2 2.4 2.6 N orm al iz ed Va lu es Year FC Price (4,000 $/kW), FC Car Price (400,000 $/car) FC Efficiency (40 %)
Design Life of H2 Car (5 years) Raw H2 Price (10 $/GJ) Capital Cost of H2 Car (4 $/km) Operating Cost of H2 Car (0.14 $/km)
Figure 2. Normalized input data in Vensim
2
Yi
= ×
A Xi
−rYi: product cost at i th production
Xi : cumulative number of products at i th production A : constant
r : shoulder ,
F
=
2
−rF : how production cost could be reduced at each time Market Infrastructure Transportation Seed infrastructure Depreciation time Industry Operating cost H2 Hydrogen cost Portion Capital cost H2 efficiency decision factor Oil cost Hydrogen car price Seed market oil car
price raw H2price FC_eff fuel_eff DL_H2 mileage operating cost oil Capital cost oil oil price oil_eff DL_oil
FC_cost required power
Decayed infrastructure number of car
Transactions of the Korean Nuclear Society Autumn Meeting Busan, Korea, October 27-28, 2005
As seen the figure 2, at time 0, input data are assumed as following. FC price is about 4000$/kW, raw hydrogen, which is came from natural gas, cost is 10$/GJ. [5] Capital cost of hydrogen car is calculated as 4$/km and operating cost is calculated as 0.14$/km. To calculate these inputs, some of assumption was installed.
3. Results
3.1. Expected market size
Figure 3. Estimation result of the market size
Figure 3 presents that the market will be saturated at 30 years later from now. This result can be explained like this. As the market size getting bigger, raw hydrogen production cost will be decreased. Therefore the summation of the market size will be saturated.
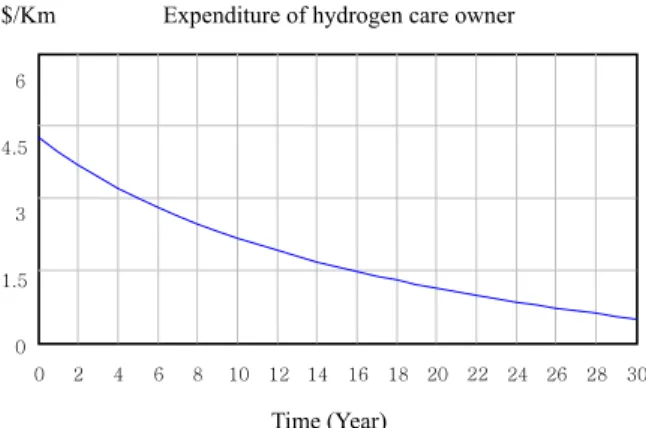
Figure 4. Estimation result of the expenditure of hydrogen car owner
The most noticeable facts that the FC cost determine the hydrogen economy market. [6] If FC cost lower, expenditure of hydrogen car owner also lower. Then people choose more hydrogen powered vehicles than gasoline powered vehicles. More people use the hydrogen, expenditure of hydrogen car owner could be downed more and expense of car users’ will decrease. This sequence will keep going on. Figure 5 shows this scenario. 0 5 1 0 1 5 2 0 2 5 3 0 0 1 2 3 4 5 Spend of C ar O w n ers [ $/ km ] Y e a r S p e n d o f H 2 C a r O w n e r S p e n d o f O il C a r O w n e r
Figure 5. Expense of car owners 4. Summary
From the result, hydrogen market will be grown by 3.3 % per year in about 30 years. Actually real value will be greater than estimated one because this study exclusive the hybrid electric vehicles (HEV). HEV will be a more practical answer therefore this part should be focused in later study. Expenditure of hydrogen car owner highly affects to the hydrogen market size. Main factor which affects the value is FC cost. Within 30 years, if FC related technology is developed, there will be a great change for our transportation sector. Nowadays all manner of FC studying are progressed which can lead the hydrogen economy. However this study of oil cost and other options should be revised more precisely.
REFERENCES
[1] S.A. Sherif, Frano Barbir, T.N. Vezziroglu, The
Electricity Journal, 2005, 1040=6190
[2] Carl-Jochen Winter, Itn’l journal of Hydrogen
Energy 30 (2005) 681-685
[3] A.I. Miller, Romney B. Duffey, Energy 30 (2005) 2690-2702
[4] Haruki Tsuchiya, Osamu Kobayashi, International Energy Workshop. 2002
[5] Carl-Jochen Winter, Int’l Journal of Hydrogen
Energy 29(2004) 1095-1097 [6] S.S. Penner, Energy 31 (2006) 33-34 Market 60 B 45 B 30 B 15 B 0 0 2 4 6 8 10 12 14 16 18 20 22 24 26 28 30 Time (Year) $
Expenditure of hydrogen care owner
6 4.5 3 1.5 0 0 2 4 6 8 10 12 14 16 18 20 22 24 26 28 30 Time (Year) $/Km