S C I E N C E A D V A N C E S
|
R E S E A R C H A R T I C L E
H E A L T H A N D M E D I C I N E
Hydrogel cross-linking–programmed release of nitric
oxide regulates source-dependent angiogenic
behaviors of human mesenchymal stem cell
Mi-Lan Kang1,2*, Hye-Seon Kim1*, Jin You1*, Young Sik Choi3, Byeong-Ju Kwon1,Chan Hee Park4, Wooyeol Baek5, Min Sup Kim1, Yong Jae Lee3, Gun-Il Im6, Jeong-Kee Yoon1, Jung Bok Lee1, Hak-Joon Sung1†
Angiogenesis is stimulated by nitric oxide (NO) production in endothelial cells (ECs). Although proangiogenic actions of human mesenchymal stem cells (hMSCs) have been extensively studied, the mechanistic role of NO in this action remains obscure. Here, we used a gelatin hydrogel that releases NO upon crosslinking by a transglutaminase reaction (“NO gel”). Then, the source-specific behaviors of bone marrow versus adipose tissue-derived hMSCs (BMSCs versus ADSCs) were monitored in the NO gels. NO inhibition resulted in significant decreases in their angiogenic activities. The NO gel induced pericyte-like characteristics in BMSCs in contrast to EC differentiation in ADSCs, as evidenced by tube stabilization versus tube formation, 3D colocalization versus 2D coformation with EC tube networks, pericyte-like wound healing versus EC-like vasculogenesis in gel plugs, and pericyte versus EC marker production. These results provide previously unidentified insights into the effects of NO in regulating hMSC source-specific angiogenic mechanisms and their therapeutic applications.
INTRODUCTION
Nitric oxide (NO) is a potent proangiogenic stimulator upon pro-duction by endothelial cells (ECs) (1) and can be generated using ammonia (NH3) (2). NO is a vasodilator and promotes EC growth
and migration, thereby promoting new vessel sprouting from existing ones. Hence, various NO-releasing biomaterials have recently been used to study the beneficial effects of NO on tissue regeneration (3). This particular function was programmed to promote vascular regeneration and therapy in the form of surface coating, nanoparticles, hydrogel, and scaffolds. However, the temporal release settings hamper their long-term applications (4), indicating a significant need to use a material template that is programmed to release NO continuously. For example, an essential NO source is deposited into a template so that NO can be released by further reaction or biosynthesis over a long period.
Significant advances have been made to regenerate tissues using human mesenchymal stem cells (hMSCs), leading to clinical trials for a range of therapeutic applications. Despite their promise, hMSC transplantation requires in vitro expansion to achieve the relevant number of cells, and serially expanded hMSCs demonstrate cell aging– associated changes in their therapeutic potential (5). Hence, this progressive alteration in donor cell properties should be thoroughly investigated to improve their successful clinical uses. Moreover, their therapeutic potential and mechanism of action vary depending on
their tissue of origin (6). hMSCs can be isolated from fetal and most adult tissues. Bone marrow–derived MSCs (BMSCs) were discovered first and have been widely used for clinical applications. Adipose tissue– derived MSCs (ADSCs) can be more easily isolated in larger amounts. These two types of hMSCs have been most widely studied because of their many shared biological properties, therapeutic efficiencies, and safe applications. However, growing evidence suggests that BMSCs and ADSCs have different immunophenotypes, differentiation potentials, and transcriptome, proteome, and immunomodulatory activities (7).
The therapeutic potential of MSCs is predominantly a result of their proangiogenic activities (8). While efforts have been made recently to elucidate other aspects of the difference between BMSCs and ADSCs (7), their different proangiogenic behaviors have not been thoroughly investigated yet. The main proangiogenic mecha-nisms of hMSCs include paracrine effects (8), endothelial differen-tiation (9), and pericyte function (10). Regardless of the hMSC type, a consensus has been reached on the paracrine mechanism because most hMSCs are known to release proangiogenic factors (11). However, hMSC type–dependent endothelial differentiation and pericyte func-tions remain unclear. hMSCs not only transdifferentiate into ECs (9) but also exhibit inherent similarities with pericytes (12), a supportive cell type that localizes on abluminal sites on an EC layer and regu-lates vascular stabilization, remodeling, and homeostasis. Previous studies have reported that the proangiogenic activity of ADSCs is driven partly by their endothelial differentiation and is higher than that of BMSCs in a mouse model of hindlimb ischemia (13). Because NO generation was found to enhance proangiogenic potential (3) and endothelial differentiation (14) of MSCs, the regulatory role of NO may differentiate these angiogenic actions between BMSCs and ADSCs.
In this study, gelatin cross-linking by microbial transglutaminase (mTG) resulted in deposition of ammonia (NH3) and the consequent
release of NO via a further biosynthetic reaction for a long period 1Department of Medical Engineering, Yonsei University College of Medicine, Seoul
03722, Republic of Korea. 2TMD LAB Co., Ltd., Seoul 03722, Republic of Korea. 3Department of Obstetrics and Gynecology, Severance Hospital, Yonsei University
College of Medicine, Seoul 03722, Republic of Korea. 4Metareceptome Research
Center, College of Pharmacy, Chung-Ang University, Seoul 06911, Republic of Korea.
5Institute for Human Tissue Restoration, Department of Plastic & Reconstructive
Surgery, Severance Hospital, Yonsei University College of Medicine, Seoul 03722, Republic of Korea. 6Department of Orthopedics, Dongguk University Ilsan Hospital,
Goyang 10326, Republic of Korea.
*These authors contributed equally to this work and are co-first authors. †Corresponding author. Email: hj72sung@yuhs.ac
Copyright © 2020 The Authors, some rights reserved; exclusive licensee American Association for the Advancement of Science. No claim to original U.S. Government Works. Distributed under a Creative Commons Attribution NonCommercial License 4.0 (CC BY-NC).
(“NO gel”). We compared the proangiogenic effects of NO on EC differentiation and pericyte function of ADSCs versus BMSCs in NO gels with stiffness optimized to 1.5 kPa (elastic modulus). The NO gel induced pericyte actions in BMSCs, as evidenced by enhanced tube stabilization, close-contact localization with ECs inside the gel matrix, enhanced pericyte-like wound healing in animal models, and expression of well-known pericyte markers. In contrast, the NO gel promoted predominantly EC-like characteristics of ADSCs, as evidenced by tube formation, two-dimensional (2D) coformation with an EC network, endothelial differentiation–mediated vasculo-genesis in a gel plug assay, and increased expression of the main EC markers. This study suggests that the effect of NO should be considered to select the hMSC type depending on the purpose of hMSC therapy owing to its regulatory role in hMSC source–dependent angiogenic mechanisms.
RESULTS
NO gel preparation
During gelatin cross-linking, mTG catalyzed isopeptide bond
forma-tion of -carboxamide groups [-(C═O)NH2] of glutamine with
-amino groups (-NH3) of lysine, resulting in NH3 deposition in
gelatin. This setting was programmed to continuously release NO as result of partial oxidation of NH3 through the biosynthetic coupling
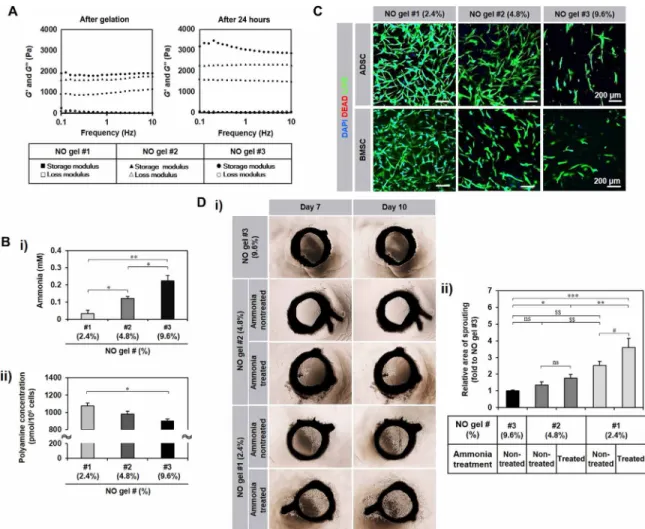
of the NO cycle with other cycles (e.g., urea cycle) (2). In addition to NO release, this NO gel was used because of the ease of placing cells into the gel and the ability to monitor hMSC behavior in the 3D environment within the gel compared with that on the 2D surface on the gel under coculture and implantation conditions. Gel stiffness was varied by controlling the cross-linking degree [NO gels (cross-linker weight/total solution volume%): 2.4% (#1), 4.8% (#2), and 9.6% (#3)], and the corresponding elastic modulus was determined using a rheometer. The modulus increased after gelation for 24 hours (table S1) as the mTG concentration was increased (Fig. 1A) from NO 2.4% gel (#1: ~1.5 kPa) to 4.8% (#2: ~2.3 kPa) and further to 9.6% (#3: ~3.4 kPa).
As an indication of NO source deposition to the gels, the ammonia (NH3) concentration increased proportionally to the used mTG
amount but inversely proportionally to the gel stiffness, with the highest ammonia concentration in NO 9.6% gel (#3:~3.4 kPa) (Fig. 1B-i), enabling the gels to set the NO release by partial ammonia oxidation in the gel system and further to control the deposition of the amount of NH3. Because ammonia can also be produced through
the mTG reaction with intracellular polyamine substrates, the poly-amine concentration in hMSCs after NO gel culture increased in an inversely proportional manner to the used mTG amount (Fig. 1B-ii), which serves as another evidence of NO release in the gel upon hMSC culture. hMSCs were defined by marker expression following the minimal criteria of defining MSCs by the International Society of Cellular Therapy (fig. S1) (15). All hMSCs fully expressed the posi-tive markers (>99%) but barely expressed the negaposi-tive markers (<1%). ADSCs and BMSCs cultured in NO gels of 2.4% (#1) supported in vitro 3D growth and sprouting of both hMSC types better than NO gels of 4.8% (#2) and 9.6% (#3) over 7 days (Fig. 1C), which was confirmed by most microvessel outgrowth with the highest sprouting area values in the ex vivo culture of rat aortic rings in test gels (Fig. 1D). To equalize the concentration of NO among the three test gels but to vary the stiffness, NO gels of 2.4% (#1) and 4.8% (#2) were supplemented with ammonia to reach the level equal to 9.6%
(#3). Then, the incremental multiples of vascular sprouting area from 7 to 10 days were determined. Although the ammonia amount was equalized, more vessels sprouted in the 2.4% (#1) gel compared with those in the other gels. Only the 2.4% (#1) gel exhibited pro-motion of vessel sprouting by ammonia supplementation (Fig. 1D). These results suggest that gel stiffness plays a key role in regulating hMSC behavior such as sprouting outgrowth in addition to the proangiogenic NO effect, with the NO gel 2.4% (#1: ~1.5 kPa) being the most supportive among the test groups. This was used for the following analyses.
Monoculture of hMSC in NO gel
Proangiogenic behaviors of ADSCs and BMSCs at passage 3 (P3) and P6 in the NO gel 2.4% (#1: ~1.5 kPa) were compared after 14 days of culture. While both passages of ADSCs exhibited robust cell-cell interactions with tube formation, such morphology was much less observed in both passages of BMSCs (Fig. 2A-i). Pro-angiogenic genes, platelet EC adhesion molecule 1 (PECAM1) and fetal liver kinase 1 (Flk1), were significantly up-regulated in the gel culture of ADSCs after both passages compared with 2D culture on tissue culture polystyrene (TCPS) (Fig. 2A-ii). However, only P6 of BMSCs in the gel expressed CD34, PECAM1, Flk1, and vascular endothelial cadherin (VE-cadherin) genes at significantly higher levels than TCPS in contrast to P3 cells (Fig. 2A-ii). The overall gene expression increased from P3 to P6 in both hMSC types. This result agrees well with the results of a previous study, in which NO promoted ex vivo angiogenesis of aged cells and in vivo wound repair in an aged mouse model (16). Therefore, P6 cells were used for sub-sequent analyses.
The effect of the presence versus absence of hMSCs on the NO release of the #1 gel was compared by profiling the cumulative NO amount for 14 days (fig. S2A). Under both conditions, NO was con-tinuously released for the initial 5 days with the sharper slopes in the presence of ADSCs or BMSCs compared with that in the absence of hMSCs (NO gel only). This difference became much clearer after day 5, when a minimal increase in the NO gel was noted compared with the continuously significant increase in the presence of hMSCs until day 14. The results confirm a causative role of hMSC presence in maintaining sustained NO release (“programmed release”). Gene expression of stemness markers, Kruppel-like factor 4 (Klf4) and CD271, increased visibly in the NO gel culture of ADSCs in both passages compared with culture in TCPS, whereas there was no visible difference between the NO gel and TCPS culture of BMSCs in both passages (fig. S2B). These results indicate that ADSCs are more sus-ceptible to the effect of NO gel culture than BMSCs. Gene expression of EC markers, PECAM1 and Flk1, was significantly higher in P6 of the ADSC culture compared with that in P6 of the BMSC culture, whereas only Flk1 expression was significantly higher in P3 of ADSCs compared with P3 of BMSCs (fig. S2C). Protein expressions of EC markers, PECAM1 and Flk1, were clearly higher in ADSCs compared with that in BMSCs (Fig. 2B-i), which was confirmed by Western blotting (Fig. 2B-ii) and supported by enzyme-linked immuno-sorbent assay (ELISA)–based determination of the cumulative release of VE growth factor (VEGF) (fig. S2D). ADSCs also exhibited sig-nificantly higher amounts of low-density lipoprotein (LDL) uptake compared with BMSCs on day 14 after culture in the NO gel (Fig. 2B-vi). Meanwhile, the cumulative secretion of angiopoietin 1 (ANGPT1), a pericyte-mediated vessel-stabilizing factor, was main-tained at higher levels in BMSCs than in ADSCs in the NO gel culture
S C I E N C E A D V A N C E S
|
R E S E A R C H A R T I C L E
(Fig. 2B-iii). These series of results suggest that the NO gel sup-ports a more predominant potential for ADSCs to differentiate into EC-like cells compared with the pericyte-like characteristics of BMSCs.
To determine whether NO production was induced both intra-cellularly and environmentally by the NO gel system, intracellular NO levels of hMSCs and external NO levels in the culture medium were measured. Because NO can be oxidized to nitrite (NO2−) and
nitrate (NO3−), the concentrations of these anion (“total NO
con-centration”) were measured as a proof of NO production. The 3D NO gel culture of hMSCs for 14 days exhibited a significantly high-er total NO concentration compared with the 2D TCPS culture for 14 days (Fig. 2C). Aminoguanidine (AG) inhibited all the inducible, endothelial, and neuronal NO synthase (NOS) (17). The immuno-staining images showed that AG treatment significantly reduced
tube formation in both hMSC types (Fig. 2D-i), which was supported by the quantitative analysis of angiogenic parameters (Fig. 2D-ii). NO production in the NO gel was confirmed by culturing human umbilical vein ECs (HUVECs), followed by Gene Ontology analysis of microarray data (Fig. 2D-iii). The 3D NO gel culture exhibited significantly higher expression levels of NO biosynthetic process– related genes compared with the 2D TCPS culture (Fig. 2D-iii). After NO inhibition by AG treatment, genes were markedly down-regulated in BMSCs after NO gel culture, while no significant differences were noted in ADSCs (Fig. 2D-iii). These results suggest that BMSCs were more susceptible to NO inhibition compared with ADSCs, although tube formation of both hMSC types was attenuated similarly by NO inhibition, indicating the support of another mechanism rather than NO inhibition for the angiogenic behavior of ADSCs.
Fig. 1. Characterization of NO gel. (A) Elastic modulus of NO gel prepared with different ratios of gelatin and mTG [NO gels (cross-linker weight/total solution volume %):
2.4% (#1), 4.8% (#2), and 9.6% (#3)]. Rheometer measurement of storage modulus (G′) and loss modulus (G″) of each NO gel formulation immediately after and 24 hours after gelation. (B) (i) Ammonia concentration of NO gels [2.4% (#1), 4.8% (#2), and 9.6% (#3)] (n = 3). (ii) Intracellular polyamine concentration of ADSC (n = 2, triplicates) in NO gels (#1 to #3) after 5-day culture. All data are presented as means ± SD. *P < 0.05 and **P < 0.01. (C) Behaviors of the two hMSC types in NO gels [2.4% (#1), 4.8% (#2), and 9.6% (#3)] after 7-day culture with live (green)/dead (red) staining. DAPI, 4′,6-diamidino-2-phenylindole. (D) Microvessel sprouting from ex vivo culture with rat aortic ring (n = 10) in NO gels 2.4% (#1), 4.8% (#2), and 9.6% (#3) with a quantitative analysis of sprouting area. (i) NO 2.4% (#1) and 4.8% (#2) gels were supplemented with ammonia to reach the level equal to 9.6% (#3). (ii) Then, the incremental multiples of vascular sprouting area from 7 to 10 days were determined and presented as a ratio with the value corresponding to NO gel 9.6% (#3) set to 1. *P < 0.05, **P < 0.01, and ***P < 0.001 between the groups where the ammonia concentration was the same but the stiffness was different. #P < 0.05 between the groups where the stiffness was the same and the ammonia concentration was different. $$P < 0.01 between the groups where both stiffness and ammonia concentration were different. ns, not significantly different. All data are presented as means ± SD (photo credit: Hye-Seon Kim, Yonsei University College of Medicine).
Coculture of MSCs and ECs in the NO gel
The differences of the NO-guided angiogenic mechanism became more apparent in coculture with HUVECs within NO gels for 14 days. After hMSCs were placed inside NO gels, HUVECs were seeded as a monolayer onto the gel surface after gelation (Fig. 3A). HUVECs seeded without hMSCs were used as the control (i.e., HUVEC monoculture). This coculture system allowed us to analyze paracrine action, colocalization, and differentiation of hMSCs in close contact with red fluorescent protein (RFP)–expressing HUVECs. Upon
coculturing at day 1, HUVECs initiated clustering over the surface in all the three conditions. These HUVEC clusters showed more sprouting in the ADSC coculture compared with the other groups at day 7. However, only the BMSC coculture demonstrated con-tinuous increases in sprouting with stable structures compared with the other groups at day 14. These results agree well with the above results in that the NO gel promotes the pericyte role of BMSCs in stabilizing vascular networks over 14 days, whereas ADSCs act like ECs in the NO gel in the initial 7 days of coculture. These results are Fig. 2. Evidence of EC-like ADSC and pericyte-like BMSC behavior at P3 and P6 in 14-day in vitro NO gel culture. (A) (i) Comparison of morphology with live (green)/
dead (red) staining. Red arrows indicate tubular formation through cell lining. (ii) Expression of angiogenesis genes, CD34, PECAM1, Flk1, and VE-cadherin by reverse transcription polymerase chain reaction (RT-PCR) and real-time quantitative PCR (qPCR) in hMSCs (n = 4) after NO gel culture (fold change to their corresponding mono-layer culture on TCPS). P3, passage 3; P6, passage 6. (B) (i) Immunostaining and (ii) Western blotting analysis of PECAM1 and Flk1 proteins in hMSCs (n = 3) after NO gel culture. In immunostaining, phalloidin staining shows actin organization. In Western blotting, the common housekeeping gene -tubulin was used for normalization of expression. (iii) Angiopoietin 1 (ANGPT1) secretion from hMSCs (n = 3) after NO gel culture by enzyme-linked immunosorbent assay (ELISA). (iv) Quantitative determina-tion of low-density lipoprotein (LDL) uptake by hMSCs (n = 2) after treatment with LDL for 1 day on day 14 after culture in NO gel. (C) NO concentradetermina-tion of hMSCs (n = 3) on days 5 (short term) and 14 (long term) after NO gel culture. Total NO concentration represents nitrite and nitrate. (D) (i) Immunostaining of NOS of hMSCs after NO gel culture after treatment with the NO inhibitor, aminoguanidine (AG). (ii) Quantitative analysis of tube formation by hMSCs (n = 3) after NO gel culture on day 5 after AG treatment (1 mM). Data are presented as % to n/t (nontreatment) of each angiogenic parameter (i.e., node, junction, segment, branch, length, and branching length). (iii) Left: Expression levels of NO biosynthesis–related genes, interleukin-6 (IL-6), clusterin (CLU), prostaglandin-I synthase (PTGIS), pentraxin-related protein 3 (PTX3), and
intercellular adhesion molecule 1 (ICAM1), in monoculture of human umbilical vein ECs (HUVECs) only after 3D NO gel culture (3DH) versus their 2D monolayer culture
(2DH) by microarray analysis. Right: Expression levels of the genes in monoculture of hMSCs only (n = 3) after NO gel culture on day 14 after AG treatment by RT-PCR. All data are presented as means ± SD. *P < 0.05, **P < 0.01, and ***P < 0.001.
S C I E N C E A D V A N C E S
|
R E S E A R C H A R T I C L E
supported by complete linkage hierarchical clustering analysis, in which ADSCs cocultured with HUVECs exhibited more within-group similarities compared with the corresponding BMSC culture condi-tions (fig. S3). ADSCs exhibited EC-like coformation with 2D HUVEC networks on the gel surface, whereas BMSCs demonstrated pericyte-like colocalization with HUVECs within the 3D inner matrix in 14 days, as observed by z-stack confocal imaging (Fig. 3B).
Analysis of paracrine secretion from the coculture groups further supports the above results. A recent study has reported that platelet- derived growth factor BB (PDGF-BB) promotes recruitment of pericytes to EC networks, resulting in enhanced vessel stabilization (18). The BMSC coculture on day 6 induces significantly more secretion of PDGF-BB compared with the ADSC coculture on day 14 (Fig. 3C-i), whereas the HUVEC monoculture maintained the highest
level of secretion among the groups for the entire culture period, as pericyte recruitment was continuously required. ANGPT1 stabilizes newly formed blood vessels and is largely produced by pericytes (19). BMSC coculture maintained its higher secretion compared with the other groups during the 14-day culture (Fig. 3C-ii). In contrast, VEGF, one of the most important growth and survival factors for endothelium, was released significantly more from the ADSC co-culture compared with the other groups (Fig. 3C-iii). These results agree with recent reports that BMSCs behave like pericytes by wrap-ping around HUVEC tubes for 83 days (20), whereas ADSCs act like ECs in promoting their angiogenic activities in a mouse model of hindlimb ischemia.
Next, we conducted a gene microarray analysis to determine the global-scale differences in phenotypic marker expression. First, fold Fig. 3. In vitro coculture of hMSCs with HUVECs in NO gel for 14 days. (A) Morphology of HUVECRFP in coculture with ADSCs or BMSCs (n = 3) on days 1, 7, and 14.
(B) 2D network formation with ADSCs on the gel surface versus 3D close contact of BMSCs with HUVECRFP in coculture by z-stack confocal microscopy. Yellow color
indicates overlap of green phalloidin (hMSC) and red RFP (HUVECRFP)) (t, top of gel; b, bottom of gel). (C) Secretion of proangiogenic factors (i) PDGF-BB, (ii) ANGPT1,
and (iii) VEGF from HUVECs only and in their coculture with ADSCs or BMSCs (n = 3) (*P < 0.05, ***P < 0.001 for HUVECs only versus cocultures and #P < 0.05, ##P < 0.01, and ###P < 0.001 for ADSC-HUVEC versus BMSC-HUVEC). (D) Hierarchical clustering analysis from profiling expression of pericyte marker genes. Heat map analysis for comparison between groups from GeneChip Human Gene 2.0 ST Array results (n = 2) showing significant differences in the expression of ≥2-fold changes between BMSCs (B) and ADSCs (A) (B/A) or between HUVEC coculture with BMSCs (BH) and with ADSCs (AH) (BH/AH). A dendrogram of the cluster correlation is shown on the left. The colors indicate expression levels (red, increased; black, equal; green, decreased expression comparing B versus A or BH versus AH). (i) Increased (19 genes) and (ii) decreased expression (15 genes) in B versus A as opposed to BH versus AH is presented on the right. Confirmation of CYP1B1 (cytochrome P450 family 1 subfamily B member 1) and S1PR1 (sphingosine-1-phosphate receptor 1) expression by (E) real-time qPCR (fold changes of B to A or BH to AH) and by (F) immunostaining. All data are shown as means ± SD. *P < 0.05 and ***P < 0.001.
changes were analyzed compared with HUVEC monoculture (table S2). Gene expressions of pericyte markers, endosialin and platelet-derived growth factor receptor beta (PDGFRβ), were markedly up-regulated in both coculture conditions, whereas expressions of other pericyte genes varied slightly higher or lower compared with the HUVEC monoculture. These results agree with previous reports that endosialin is preferentially expressed on mural cells, including pericyte, but not by ECs (21), and blocking the PDGF pathway leads to pericyte deficiency (22). We further analyzed both microarray and real-time quantitative polymerase chain reaction (qPCR) results by comparing BMSCs to ADSCs with (right column) or without (left column) HUVEC coculture (table S3). Among the eight genes compared by microarray or qPCR, the expressions of six genes were significantly higher in both columns, although there were large variations in their fold changes. These results suggest that the NO gel predominantly supports pericyte characteristics of BMSCs compared with ADSCs.
The microarray results exhibited clear differences in the NO- mediated expression of angiogenesis, pericyte, and migration-related genes among HUVECs, BMSC coculture, and ADSC coculture as well as between ADSCs and BMSCs both in monoculture or both in coculture (fig. S4). In particular, a hierarchical clustering analysis of 830 pericyte markers was applied to the microarray results, and genes showing different expression patterns upon comparison of BMSCs with ADSCs with or without HUVEC coculture are presented (Fig. 3D). There are large differences in gene expression patterns between BMSCs and ADSCs both in monoculture, between BMSCs and ADSCs both in coculture with HUVECs, and between the mono- and coculture conditions. Because pericyte- or EC-like characteristics became more apparent in coculture with HUVECs in the NO gel, our next analysis focused on changes in gene expression from the monoculture to coculture conditions. Notably, the expression of cytochrome P450 family 1 subfamily B member 1 (CYP1B1) was higher (8.08-fold) in BMSCs compared with ADSCs in monoculture, but not in coculture (0.23-fold). This trend was reversed in sphingosine-1- phosphate receptor 1 (S1PR1) expression, which was lower (0.24-fold) in BMSCs than in ADSCs in monoculture but increased significantly in coculture (27.85-fold). The results were confirmed by qPCR (Fig. 3E) and immunostaining (Fig. 3F). These results align with the previous study (23), which reported that BMSCs act like pericytes. CYP1B1 deficiency leads to proliferation, migration, and survival of pericytes, whereas S1PR1 is required for pericyte interaction with ECs; thus, S1PR1 knockout mice show blocked vascular maturation (24). Further analysis of microarray results by a volume plot of gene expression levels demonstrates that gene expression of connective tissue growth factor, an essential factor for pericyte adhesion during angiogenesis (25), was higher (22.63-fold change; volume, 10.59) in BMSCs compared with ADSCs in coculture (fig. S3) within the NO gels.
Ex vivo culture in NO gel
In ex vivo coculture with rat aortic rings, the patterns of CYP1B1 expression were similar to the coculture results, as evidenced by its higher expression in BMSCs compared with ADSCs in monoculture (Fig. 4A). Its expression was maintained at high levels in both co-culture conditions with aortic rings, suggesting that some degree of CYP1B1 expression is required to maintain both pericyte and EC functions (17), as supported by the fact that CYP1B1-deficient mice fail to elicit a neovascular EC response during oxygen-induced ischemic retinopathy (26). Expression of Flk1, a major EC marker, was not detected in the culture of only the aortic ring but was clearly observed
in ADSC coculture with aortic rings (fig. S5A). In alignment with the coculture results, S1PR1 was more highly expressed in the BMSC coculture compared with the ADSC coculture (Fig. 4B). However, S1PR1 expression was not detected in MSCs alone, which is expected because S1PR1 expression is activated in the context of interaction between pericytes, as reported by recent studies.
Neural/glial antigen 2 (NG2) is consistently expressed by pericytes of developing vascular structures (27). NG2 was highly expressed in the monoculture of both hMSC types, and its expression increased more in the BMSC–aortic ring coculture compared with the ADSC coculture (Fig. 4C). The expression patterns were similar to those of PDGFR (Fig. 4D), and the human origin of BMSCs was confirmed (fig. S5B). PDGFR is a crucial regulatory factor for the prolifera-tion, migraprolifera-tion, and survival of pericytes (28).
In vivo wound healing assay
NO promotes wound healing through collagen deposition with cell migration and proliferation (29). Moreover, MSCs have shown beneficial effects on cutaneous wound healing and skin regeneration, in part because of pericyte functions (30), as well as promoting EC-mediated angiogenesis (31). Thus, a wound healing assay may further confirm the NO effect on the differences in hMSC source– dependent proangiogenic mechanisms. In this in vivo model of wound healing, wound closure of BMSC-embedded NO gels was faster (Fig. 5A), as evidenced by earlier formation of collagen fibers with more delayed inflammatory infiltration in the wound areas compared with the other groups (Fig. 5B). The BMSC- and ADSC-embedded groups formed PECAM1+ neovascular networks at the wound sites
with complete involucrin-positive epithelial healing compared with the other test groups (fig. S6). However, only the BMSC-embedded group showed distinct colocalization of -smooth muscle actin– positive (SMA+) and PECAM1+ signals within the wound site,
indicating the peracetic roles of BMSCs in enhancing vessel forma-tion and maturaforma-tion during wound healing. When the remaining area of the NO gel in the wound healing model was quantitatively determined by Masson’s trichrome (MT) staining with an image analysis (yellow dot areas in Fig. 5B-i with Fig. 5B-iii), the remaining gel area significantly decreased from the NO gel–only group to the ADSC + NO gel group and further to the BMSC + NO gel group, whereas hNuclei+ cells were enriched in the tissue areas where the
test gels were located and degraded, supporting the pericyte- or EC function–dependent differences in the healing speed (Fig. 5C-ii) and associated gel degradation (Fig. 5C-iii).
Pericyte characteristics were determined by quantitative analysis and visualization of pericyte markers (CD146, NG2, and desmin) and human nuclei expression (Fig. 5C). Significantly more cells stained positive for both the pericyte marker and the human nuclei marker in the BMSC group than in the ADSC group (Fig. 5C-i), which was confirmed by immunostaining (Fig. 5C-ii). The results further support the pericyte-like behavior of BMSCs to accelerate wound healing.
In vivo gel plug assay
A gel plug angiogenesis assay was conducted to determine whether NO promotes a causative role of EC-like behavior of ADSCs in in-ducing vasculogenesis in this context. After 14 days, more distinct vessel structures were observed in the ADSC-embedded NO gel group compared with the other groups (Fig. 6A). Blood perfusion, an indication of functional vessel formation, was confirmed in the ADSC and BMSC groups by injecting fluorescent beads into the left
S C I E N C E A D V A N C E S
|
R E S E A R C H A R T I C L E
ventricle of a mouse heart (Fig. 6B). The ADSC group showed higher fluorescence intensity compared with the other groups. The MT staining results showed that more cells migrated to the gel surface of the ADSC group compared with the other groups (Fig. 6C). More-over, the Flk1+ vessel density increased in the ADSC group compared
with the other groups (Fig. 6D). These results suggest that the NO gel promoted EC-like characteristics of ADSCs, thereby inducing neovascularization more effectively compared with the BMSCs in the gel plug assay in vivo, although BMSCs are able to induce vessel formation to some degree.
DISCUSSION
Because NO promotes various EC functions (32), inhibition of NO bioactivity usually reduces angiogenesis, as evidenced by the anti-NO effect of oxidized LDL inhibiting capillary sprouting from segments of rabbit thoracic aorta or human coronary artery (33). Our results also agreed with the fact that NO inhibition by AG treatment sig-nificantly reduced tubulogenesis of hMSCs in the NO gel. Because the beneficial effects of NO on angiogenesis and hMSC behavior have been widely studied but in different ways, this NO gel served as the first platform to elucidate hMSC source–dependent angiogenic mechanisms, representing a critical value in the field of biomaterials and regenerative medicine. This in-depth study could not be carried out without this NO gel setting to program continuous release of NO by depositing a source in the matrix. This advanced functional material platform is expected to address the long-standing issue of the temporal release of most delivery settings in the field.
The NO hydrogel system with stiffness optimization (1.5-kPa elastic modulus) allowed for the easy placement of cells in a 3D environment in addition to the NO release, followed by the investi-gation of progressive changes in hMSC behaviors from the 3D inner matrix to the 2D gel surface. First, in monoculture, both types of stem cells showed NO-mediated in vitro angiogenic activities, as evidenced by tube formation and proangiogenic molecule expression, which was enhanced when the passage was increased from 3 (early) to 6 (late). When both hMSCs were compared, BMSCs produced more ANGPT1, a pericyte-driven vessel stabilization factor, whereas ADSCs produced more PECAM1 and Flk1, which are EC-driven proangiogenic fac-tors, indicating that the NO gel promoted dominant pericyte- and EC-like properties of BMSCs and ADSCs, respectively, in this con-text. These different characteristics became more evident when these cells were cocultured with HUVECs because (i) vessel stabilization was superior in coculture with BMSCs; (ii) BMSCs were localized in contact with ECs, whereas ADSCs moved to the gel surface by forming an EC-like 2D layer; and (iii) the ELISA, gene microarray, and PCR results demonstrated that more pericyte markers were produced in BMSCs with HUVECs compared with ADSCs with HUVECs. The pericyte-like BMSC and EC-like ADSC activities were confirmed by an ex vivo assay in aortic ring coculture with hMSCs and in in vivo wound healing and gel plug assays.
Pericytes communicate with ECs via both direct physical contact and paracrine signaling, thereby regulating vascular stability and homeostasis (34). MSCs and pericytes have phenotypic similarities with functional equivalence (12). In this study, the promotive effects of NO gel on the pericyte-like characteristics of BMSCs were Fig. 4. Ex vivo coculture of rat aortic ring and hMSC NO gel culture. Immunostaining analysis of pericyte markers (A) CYPB1, (B) S1PR1, (C) NG2, and (D) PDGFR
ana-lyzed by (i) merged z-stack confocal image, (ii) ortho visualization, and (iii) 3D image. NG2 expression was visualized at the (vi) near and (v) far sides from the aortic ring (t, top of NO gel; b, bottom of NO gel).
demonstrated via a series of results. It is worthwhile to evaluate the expression of CYP1B1 and S1PR1. CYP1B1 expression was higher in BMSCs compared with that in ADSCs but decreased the most among others in coculture with HUVECs or aortic rings (Figs. 3, D to F, and 4A). These results indicate that CYP1B1 function was deactivated when BMSCs interacted with HUVECs and suggests a pericyte-like role of BMSCs, which is supported by a recent study (23) that showed that CYP1B1 deficiency leads to proliferation, migration, and survival of pericytes. In contrast, S1PR1 expression was lower in BMSCs than in ADSCs, but its expression increased significantly more in BMSC-HUVEC coculture compared with the ADSC-HUVEC coculture. S1PR1 binds to sphingosine-1-phosphate (S1P), which plays a key role in the communication between ECs and pericytes (24). Thus, the higher S1PR1 expression in the BMSC coculture with the aortic ring compared with the ADSC-ring coculture (Fig. 4D) clearly supports the predominant pericyte mechanism of BMSCs for angiogenesis through NO functions. Moreover, when the marker expression was compared between the MSC monoculture and the HUVEC coculture for the 2-week period (table S3), PDGFR, an early pericyte marker (35), was expressed more in the BMSC mono-culture compared with the ADSC monomono-culture as opposed to the
results from the HUVEC coculture conditions. In contrast, the expression of SMA, a late pericyte marker (36), was higher in the BMSC-HUVEC coculture compared with the ADSC-HUVEC co-culture as opposed to the monoco-culture conditions. These results indicate that compared with ADSCs, more mature pericyte charac-teristics of BMSCs were developed in coculture with HUVECs, although the expression of an early, immature pericyte marker was dominant in the corresponding monoculture conditions.
A previous study reported that pericyte-like MSC function acceler-ated wound healing by promoting angiogenesis, anti-inflammatory activities, and more organized dermis/epidermis formation (37). Our wound healing study also demonstrated that when implanted with the NO gel, the higher BMSC number with colocalized expression of pericyte markers (NG2 and CD146) and human nuclei resulted in accelerated wound healing compared with the ADSC group. In contrast, the absence of MSCs in the aortic ring assay resulted in the promotion of microvessel outgrowth in the NO gel 2.4% (#1) com-pared to the other test gel types, and the implantation of the same NO gel type with ADSCs accelerated perfusable vessel growth even more with dominant expression of EC markers in the gel plug assay. These results support the overarching suggestion that NO mediates Fig. 5. In vivo wound healing study with hMSCs embedded in NO gels for 14 days. (A) Representative macroscopic images of wound closure sites among the test
groups (photo credit: Mi-Lan Kang, Yonsei University College of Medicine). (B) (i) MT staining (sc, stratum corneum; sg, stratum granulosum; ss, stratum spinosum) with quantitative analysis of (ii) the defect length from the calculation of the length of nonregenerated stratum granulosum (between red arrows on each group) and (iii) the remaining gel areas (yellow dotted lines in the right panel of MT staining images) as an indication of in vivo gel degradation. (C) (i) Quantitative analysis of cell numbers positive for both pericyte markers (CD146, NG2, or desmin) and hNuclei. (ii) Immunostaining images of pericyte markers and hNuclei. Yellow arrows indicate cells double stained with pericyte marker+ and hNuclei+. All data are shown as means ± SD. *P < 0.05 and ***P < 0.001.
S C I E N C E A D V A N C E S
|
R E S E A R C H A R T I C L E
the pericyte mechanism of BMSCs and promotes the EC-like properties of ADSCs in the gel implantation status. With respect to the NO gel degradation and hNuclei+ cell population in the wound healing assay
(Fig. 5B), a clear conclusion cannot be made regarding whether hNuclei+ cells migrated from or just remained around the gel areas
under the effect of NO release. However, it is most likely that hNuclei+
cells contributed to the tissue regeneration in some variation depend-ing on the pericyte and EC functions, considerdepend-ing the differences of the remaining gel areas among the test groups.
In the current study, it was not possible to determine the effects of sex and age differences of the donors of the two MSC types because BMSCs were exclusively extracted from old patients who were subject to hip replacement surgery because of avascular necrosis of the femoral head (AVNFH) (38). In contrast, ADSCs were exclu-sively extracted from young female patients who underwent liposuction (39). However, MSCs underwent a robust quality control process regarding the inherent MSC morphology and phenotype markers to ensure minimal differences in the healthy status of the two MSC types before the experiments. A future study is proposed to investigate these variables after setting up reliable clinical sources in collabora-tion with a hospital. In this way, more novel insights into the regu-latory roles of NO in MSC type–specific angiogenic mechanisms will be provided in alignment with this current study. In particular, although it has been almost impossible to obtain BMSCs from young donors, this advanced setting of clinical source will inform the importance
of (i) NO signaling, (ii) the mechanism-dependent selection of the MSC type, and (iii) the effects of donor age and sex in therapy for old patients with AVNFH.
METHODS
Cells and experimental animals
BMSCs were isolated from bone marrow aspirates of patients with AVNFH with a mean age of 77 years (range, 64 to 90 years; n = 4) who underwent total hip replacement surgeries. ADSCs were isolated from four patients with a mean age of 39.5 years (range, 38 to 42 years; n = 4) who underwent liposuction. Informed consent was obtained from all donors. The isolation and use of these cells were approved by the Institutional Review Board (IRB) of Dongguk University Ilsan Hospital (IRB no. 2012-34) and Yonsei University College of Medicine (IRB no. 4-2016-1111). During culture, adherent cells were selected from a plastic culture plate surface, and their phenotypes were con-firmed by flow cytometry using hMSC phenotyping kits (Miltenyi Biotech, Germany, and BD Biosciences, USA) according to the manu-facturers’ instructions. Dulbecco’s modified Eagle’s medium (DMEM)– low glucose (Gibco) with fetal bovine serum (10%, v/v; Gibco) and an antibiotic-antimycotic solution (1%, v/v; Gibco) was used for culture. The degree of population doubling as a function of passaging up to 10 was calculated by determining the difference between the numbers of harvested and plated cells at each passage using the Fig. 6. In vivo gel plug study with hMSCs in NO gels. (A) Subcutaneous implantation of test groups with plug formation (left panel with white arrows) under the dorsal
skin of nude mice, followed by harvest of test groups after 14 days (right) (photo credit: Mi-Lan Kang, Yonsei University College of Medicine). (B) 3D visualization of perfusable vessel formation by injecting fluorescence beads through the left ventricle of the heart by z-stack confocal microscopy. (C) MT and (D) Flk1 staining of the harvested samples.
following formula: [log10(N) − log10(N0)]/log10(2). The population
doubling time was determined using the formula (t − t0)∙log2/
log(N − N0), where t − t0 is the culture time (in hours), N is the
number of harvested cells, and N0 is the number of cells at the
be-ginning point. HUVECs were purchased from the American Type Culture Collection (ATCC; USA), and their authentication is available in ATCC. The experimental animals were 8-week-old male Sprague- Dawley rats (Orient Inc.) and 6-week-old male BALB/c nude mice (Orient Inc.). All animal experiments were performed in accordance with the Korean Food and Drug Administration guidelines. Protocols were approved by the Institutional Animal Care and Use Committee of the Yonsei Laboratory Animal Research Center (permit no. 2016-0194).
Hydrogel fabrication and rheological analysis
TI transglutaminase formula (mTG; Modernist Pantry) was dissolved in phosphate-buffered saline (PBS) (mTG weight/total solution volume: w/v%) at NO gels 2.43% (#1), 4.76% (#2), and 9.6% (#3), followed by addition of gelatin (Sigma-Aldrich) at 5.5% (w/v) in PBS. The ratio of mTG to gelatin was consistently 9:1 (v:v). Elastic modulus, an indi-cation of gel stiffness, was measured using a rheometer (MCR 102; Anton-Paar) at 37°C by determining the storage modulus (G′) and loss modulus (G″) in a frequency sweep mode at a frequency range from 0.1 to 10 Hz under constant 1% shear strain.
Ammonia assay
NO gels 2.4% (#1), 4.8% (#2), and 9.6% (#3) were formed by mTG- mediated cross-linking of gelatin. Media supernatants were then collected to determine ammonia concentrations during the cross- linking reaction of test gels (n = 3). Samples were centrifuged for 5 min at 14,000 rpm to remove particles. The ammonia concentration was measured using an ammonia assay kit (Sigma-Aldrich) following the manufacturer’s instructions. Briefly, samples were mixed and reacted with working reagents for 15 min in the dark at room temperature. The fluorescence intensity as an indication of total ammonia con-centration was measured at Ex = 360 nm and Em = 450 nm (BioTek,
Republic of Korea).
Polyamine assay
ADSCs (1 × 10⁶ cells/ml; n = 2 in triplicates) at P6 were mixed with NO gels (2.4% #1, 4.8% #2, and 9.6% #3) and cultured for 5 days, which were then collected and chopped in 100 l of cold PBS using a homogenizer to extract the intracellular polyamines, followed by centrifugation at 14,000 rpm for 20 min at 4°C. The supernatants were collected and subjected to the assay in accordance with the manufacturer’s instruction (BioVision, USA). Briefly, polyamine developer mix and diluted polyamine probe were added to the samples, which were incubated for 30 min at room temperature. The absorbance of each sample as an indication of polyamine concentration was mea-sured at 570 nm using a colorimetric microplate reader (BioTek).
hMSC culture in NO gel
BMSCs or ADSCs (1 × 10⁶ cells/ml; n = 4) at P3 were mixed with the
gel solutions at varying mTG concentrations, and then, the mixed solution underwent gelation by mTG-mediated cross-linking of gelatin. The gel size was 60.8 mm3 for in vitro culture in 24-well plates. Cell viability was determined using a LIVE/DEAD Viability/ Cytotoxicity Kit (Invitrogen) following the manufacturer’s instructions. Briefly, cells were incubated in media containing 4 mM calcein-AM and 2 mM ethidium homodimer-1 for 1 hour, and then, nuclei were
counterstained with 4′,6-diamidino-2-phenylindole (DAPI; Sigma- Aldrich). Live (green) and dead (red) cells with nuclei (blue) were imaged by confocal microscopy (LSM780; Zeiss, Oberkochen).
Ex vivo aortic ring culture assay
A rat thoracic aorta was harvested and rapidly dissected into 1-mm-thick rings in PBS with penicillin-streptomycin (1%, v/v; Gibco), followed by removing the surrounding fat and perivascular tissues and washing out the blood in PBS. A sliced ring was then embedded in an NO gel and maintained at 37°C with 5% CO2 in EC growth
medium-2 (EGM-2) (Lonza) for 10 days. To determine the inde-pendent effect of NO versus gel stiffness, the NO concentration among the three test gels was equalized with varying the stiffness. NO gels of 2.4% (#1) and 4.8% (#2) were supplemented with 0.191 and 0.1035 mM ammonia, respectively, to reach the level equal to 9.6% (#3). Areas of neovessel outgrowth from the aortic rings (n = 10) were quantitatively analyzed using ImageJ software [National Insti-tutes of Health (NIH)]. Then, the incremental multiple of vascular sprouting area from 7 to 10 days was determined and presented as a ratio with the value corresponding to the NO gel 9.6% (#3) set to 1.
In vitro angiogenic activities of hMSCs in NO gel
P3 or P6 of ADSCs or BMSCs (1 × 10⁶ cells/ml; n = 4) was encapsu-lated in the NO gel 2.4% (#1) and cultured for 14 days in the absence of any proangiogenic growth factors. The same number of cells was propagated on TCPS, a 2D culture control. Cell morphology with sprouting and tube formation was visualized by LSM780 confocal microscopy (Zeiss) after LIVE/DEAD and DAPI staining, as described above. The expression of cell markers at the gene and protein levels was determined by PCR, qPCR, immunocytochemistry, Western blotting, and ELISA. The uptake of LDL by hMSCs (n = 2) was de-termined on day 14 after culture in NO gels. Cells were washed with PBS and incubated in an assay buffer containing fluorophore-labeled LDL (0.2 mg/ml) (BioVision, USA) at 37°C for 24 hours, followed by quantitative analysis of the internalized LDL amount into cells using the assay kit, according to the manufacturer’s instruction (BioVision, USA). The functional assay results were compared with those of TCPS (negative control) and HUVECs (positive control) using the same protocols.
PCR and qPCR
Total RNA was extracted from cells by TRIzol extraction reagent (Invitrogen) following the manufacturer’s instructions (n = 4). Expression levels of numerous genes were determined by PCR and qPCR. Angiogenesis-related genes included CD34, PECAM1, Flk1, and VE-cadherin. Stemness-related genes included c-Myc, Klf4, and CD271. NO biosynthesis–associated genes included intercellular adhesion molecule 1 (ICAM1), interleukin-6 (IL-6), clusterin (CLU), pentraxin-related protein 3 (PTX3), and prostaglandin-I synthase (PTGIS). Complementary DNA (cDNA) was synthesized using the AccuPower CycleScript RT PreMix (Bioneer) according to the manufacturer’s instructions. PCR was performed on a T100 Thermal Cycler (Bio-Rad) using a HiPi Plus 5× PCR premix (Elpisbio), and the products were analyzed by 2% (w/v) agarose gel electrophoresis. Real-time qPCR was performed on a StepOnePlus Real-Time PCR System (Applied Biosystems) using SYBR Green PCR mix (Thermo Fisher Scientific). Each gene expression was normalized to 40S ribosomal protein S18 (RPS18) and analyzed by the relative quantification 2−Ct method. The values were further normalized to the corresponding
S C I E N C E A D V A N C E S
|
R E S E A R C H A R T I C L E
samples in the TCPS culture and are presented as fold changes. Primer sequences are listed in table S4.NO assay
The NO assay was carried out using a colorimetric kit (Abcam) after a 5-day culture of ADSCs or BMSCs at P6 (1 × 10⁶ cells/ml) in NO
gel 2.4% (#1) (n = 3). The same number of cells was propagated on TCPS as a 2D culture control. Samples were collected and chopped in a cold assay buffer (100 l) to extract nitrate and nitrite, followed by centrifugation at 14,000 rpm for 20 min at 4°C for collection of supernatants. Culture media were also collected on days 5 and 14 to measure the secreted NO concentration and then mixed with the supernatants to determine the total NO amount of each sample from the intracellular fraction and in the media. The cumulative NO release from gels into the culture media was profiled by collecting culture media without gels, followed by determining the NO con-centration over the course of time points. The absence (NO gel only) versus presence of hMSCs was compared. The subsequent procedures of NO assay were conducted in accordance with the manufacturer’s instructions (Abcam). Briefly, deproteinized cells were reacted with nitrate reductase and enzyme cofactor for 1 hour at room tempera-ture. After treating with Griess reagent, nitrate changed to a purple azo compound. The level of azo compound as an indication of the NO amount was measured using a colorimetric microplate reader at 540 nm (BioTek).
Immunocytochemistry
Samples (n = 3) were fixed with 4% paraformaldehyde (Sigma-Aldrich), permeabilized with 0.3% Triton X-100 (Sigma-Aldrich) in PBS, and blocked with 5% bovine serum albumin (Millipore). Samples were incubated with primary goat anti-PECAM1 (1:100; Santa Cruz Bio-technology) and rabbit anti-Flk1 (1:100; Santa Cruz BioBio-technology) antibodies, followed by washing and incubating with secondary anti-goat conjugated to Alexa Fluor 488 (1:200; Invitrogen) and rabbit conjugated to Alexa Fluor 488 (1:200; Invitrogen) anti-bodies with or without Alexa Fluor 594 Phalloidin (1:500; Invitrogen) for cytoskeleton staining. Nuclei were counterstained with NucBlue Live ReadyProbes Reagent (Invitrogen). Images were obtained using an LSM780 confocal laser scanning microscopy.
NO inhibition test
ADSCs or BMSCs at P6 (106 cells/ml; n = 3) were encapsulated in
NO gel 2.4% (#1) and cultured for 5 or 14 days with or without AG (1 mM), a NO inhibitor. The cytoskeletons were visualized by immunofluorescence after staining with Alexa Fluor 488 phalloidin (1:200; Invitrogen), followed by imaging with an LSM780 confocal laser scanning microscope. Subsequently, angiogenic parameters including node, junction, segment, and total length were quantita-tively analyzed using Image J (see http://image.bio.methods.free.fr/ ImageJ for the manual).
Western blotting
Total proteins were isolated from samples by lysing with radio-immunoprecipitation assay buffer (Sigma-Aldrich), and protein concentrations were determined using a Bradford assay (Sigma- Aldrich). Protein extracts were run on a 10% (w/v) SDS–polyacrylamide gel electrophoresis gel and then electrotransferred onto a nitro-cellulose membrane. The membranes were blocked in TBST [20 mM tris, 0.9% NaCl, and 0.1% Tween 20 (pH 7.4)] with 5% (w/v) skim
milk and then incubated with primary rabbit anti-CD31 (PECAM1) (1:100; Abcam, Cambridge), rabbit anti-Flk1 (1:100; Santa Cruz Biotechnology), and rabbit anti–-tubulin (1:100; Abcam) antibodies, followed by treatment of secondary goat anti-rabbit immunoglobulin G (IgG) (H + L) horseradish peroxidase (HRP)–conjugated (1:2000; Vector Labs) antibodies. The signals were visualized using the ECL Plus Western Blotting Detection Kit (Amersham Biosciences) accord-ing to the manufacturer’s instruction and analyzed usaccord-ing an image reader LAS-3000 (Fujifilm, Tokyo). This experiment was performed in triplicate with a mix of three different donor samples (n = 3).
Enzyme-linked immunosorbent assay
Secretion levels of ANGPT1 protein in sample supernatants were determined using ELISA kits (PeproTech) according to the manu-facturer’s instructions. Briefly, standards and sample supernatants were added into predefined wells and incubated for 2 hours at room temperature. After the plates were washed with washing buffer, avidin HRP conjugates were added to the plates at room temperature for 30 min, followed by washing and addition of ABTS liquid substrate solution to each well. The absorbance of each well was measured at 405 nm with wavelength correction setting at 650 nm. Cumulative amounts of ANGPT1 secretion were calculated on the basis of a standard curve (n = 3).
HUVEC coculture in NO gel
P6 BMSCs or P6 ADSCs (n = 3) were precultured in NO gels for 1 day, and 5 × 10⁵ cells/ml of RFP-HUVECs (HUVECRFP; PromoCell) were seeded on the gel surface layer and cultured in EGM-2 for 14 days. HUVECRFP morphologies with sprouting and network formation during tubulogenesis were visualized by LSM780 con-focal microscopy on days 1, 7, and 14. HUVECRFP monoculture
served as a control. Distribution and migration of hMSCs in co-culture with HUVECs from 3D inside to the NO gel surface were monitored by cytoskeletal staining using Alexa Fluor 488 phalloidin (1:500; Invitrogen) with LSM780 confocal imaging. The protein se-cretion levels of PDGF-BB, VEGF, and ANGPT1 in the sample supernatants were determined by ELISA (n = 3), as described in the above section.
Gene microarray
Microarray assays were conducted to profile the global scale of gene expression. GeneChip Human Gene 2.0 ST Array containing more than 24,000 probes (Affymetrix) was used, and the results were analyzed using the Affymetrix GeneChip Command Console Software. Triplicate samples for each group were pooled together, and microarrays were conducted in duplicate. Genes showing greater than twofold differences in expression between test groups were selected, and then, GeneSpring Software 7.2 (QIAGEN) was used for hierarchical clustering analysis and dendrogram visual-ization to determine complete linkage and Pearson correlation. Annotation of selected genes was performed using the DAVID Bioinformatics Resources (https://david.ncifcrf.gov) and the Stanford Online Universal Resource for Clones and Expressed sequence tags (http://source-search.princeton.edu). Angiogenesis-, pericyte-, and migration-related genes were analyzed and cate-gorized using Core Analysis in Ingenuity Pathways Analysis 5.5 (Ingenuity Systems). To validate the microarray results, real-time qPCR and immunocytochemistry were conducted, as described in the above section.
Ex vivo coculture with rat aortic ring in NO gel
Rat aortic rings were prepared using the same method as in the above section. Aortic rings were embedded in NO gels with hMSCs (106 cells/ml; n = 2) and maintained at 37°C and 5% CO
2 in EGM-2
for 14 days. Expressions of pericyte-related markers including CYP1B1, S1PR1, NG2, and PDGFR were evaluated by immuno-cytochemistry as described above. Expression of angiogenesis-related markers was additionally evaluated by immunostaining using primary rabbit anti-Flk1 antibody (1:100; Santa Cruz Biotechnology) with secondary biotinylated goat anti-rabbit IgG (Vector Labs) antibodies. To visualize aortic rings, Cy5-conjugated streptavidin (Vector Labs) was treated with fluorescein isothiocyanate–conjugated lectin (Sigma-Aldrich). To determine cells of human origin, human mitochondria were stained with primary anti-human mitochondria antibodies (1:20; Millipore). Z-stack or single-plane images were obtained using an LSM780 confocal microscope (Zeiss), and the images were analyzed using ZEN imaging software (ZEN 2012; Zeiss).
In vivo wound healing assay
The dorsal surface of 6-week-old male BALB/c nude mice was dis-sected, followed by removing the epidermis, dermis, and subcutaneous tissue to obtain full-thickness wounds with a consistent square shape (~18-mm length for each of the four equal sides with a gel size of 324 mm3). The mice were randomly divided into five groups (n = 6
per group): normal, sham, NO gel only (hMSC-free control), ADSC- embedded NO gel, and BMSC-embedded NO gel. P6 BMSCs or P6 ADSCs (n = 2) were embedded in NO gels at a final concentration of 106 cells/ml and cultured for 1 day at 37°C and 5% CO
2 in DMEM
(Gibco) and then transplanted into wounds. Wound areas with trans-planted gels were protected by covering with sterilized Tegaderm films (3M Health Care) and maintained for 14 days.
Analysis of wound model
On day 14 after wound implantation, each scar tissue was harvested with a rim of healthy normal tissue, fixed in 10% buffered formalin, and embedded in paraffin. Paraffin blocks were dissected to 4-m-thick slices and stained with MT staining using a ready-to-use kit (Sigma-Aldrich). Briefly, after deparaffinization and hydration, the sample slices were immersed in Bouin’s solution, followed by staining with Weigert’s hematoxylin and Biebrich scarlet acid fuchsin. The samples were then incubated with phosphotungstic-phosphomolybdic acid solution and stained with aniline blue solution, followed by in-cubation in acetic acid solution. To determine the degrees of wound closure, the length of nonregenerated stratum granulosum was cal-culated in the MT images. In vivo degradation of NO gels was determined by calculating the remaining gel area in the MT staining images using ImageJ software (NIH).
Protein expression of pericyte-related markers was evaluated by immunostaining with primary rabbit anti-CD146 (1:200; Abcam), rabbit anti-NG2 (1:100; Abcam), and rabbit anti-desmin (1:100; Abcam) antibodies overnight at 4°C after deparaffinization and hydration. Samples were incubated with mouse anti-human nuclei (1:20; Millipore) antibodies, with subsequent overnight incubation with biotinylated goat anti-rabbit IgG (Vector Labs) antibodies at 4°C, followed by incubation with Cy5-conjugated streptavidin (Vector Labs) with anti-mouse IgG conjugated to Alexa Fluor 488 (Invitrogen) for 1 hour at room temperature to confirm the human source of hMSCs. Anti-PECAM1 (1:100; Santa Cruz Biotechnology) and anti-SMA (1:100; Abcam) antibodies were additionally used to visualize
neo-vascularization and pericyte locations in wound sites. Epithelium formation, an indication of complete healing, was evaluated by staining the stratum corneum and granulosum with anti-involucrin antibodies (1:200; Abcam). All samples were counterstained with DAPI and mounted with VECTASHIELD mounting medium (Vector Labs). Images were obtained at six randomly selected sites on each slide by LSM780 confocal microscopy with quantitative analysis of the number of marker positive cells among the total number of cells.
In vivo gel plug assay
NO gel solution (200 l) with P6 hMSCs (106 cells/ml; n = 2) or without cells (hMSC-free control) was injected into two subcutaneous sites (right and left symmetrically) of 6-week-old male BALB/c nude mice and maintained for 3 weeks. To visualize perfusable vessel for-mation in the plug sites, mice were perfused with a heparinized fluorescent microbead solution (Thermo Fisher Scientific). Briefly, heparinized saline (10 IU/ml) was injected into the left ventricle after amputating the internal vena cava, followed by perfusion of heparinized fluorescent microbead solution in saline. Gel plugs were then harvested and subjected to LSM780 confocal imaging. The paraffin sections were obtained from the plug parts and stained with MT, as previously described in the above sections. To confirm neo-vascularization into gel plugs, tissue section slices were stained with primary rabbit anti-Flk1 antibody (Santa Cruz Biotechnology) and secondary phycoerythrin (PE)–conjugated goat anti-Rabbit IgG (Thermo Fisher Scientific) antibody, followed by LSM780 confocal imaging.
Statistical analysis
Descriptive statistics were used to determine the group means and SDs. Statistical comparisons were analyzed using (i) two-way analysis of variance (ANOVA) with Bonferroni’s post hoc analysis for more than two groups with more than one factor or (ii) one-way ANOVA for more than two groups with one factor (SPSS 15.0; SPSS Inc.). P values are presented in each figure and its legend.
SUPPLEMENTARY MATERIALS
Supplementary material for this article is available at http://advances.sciencemag.org/cgi/ content/full/6/9/eaay5413/DC1
Fig. S1. Phenotype marker expression and growth kinetics of the two hMSC types (n = 4). Fig. S2. NO release profile and stemness and angiogenesis marker expression.
Fig. S3. Hierarchical clustering (Euclidean method, complete linkage) and volume plot analysis from microarray data.
Fig. S4. Analysis of microarray results (n = 2).
Fig. S5. Ex vivo ADSC or BMSC coculture with rat aortic ring in NO gel. Fig. S6. In vivo wound healing study with hMSC-embedded NO gel. Table S1. Rheological properties of NO gels.
Table S2. Relative expression of pericyte markers in NO gel by microarray [BMSC (n = 2), ADSC (n = 2), triplicate] between HUVECs only and the coculture of HUVECs with ADSCs or BMSCs. Table S3. Relative expression of pericyte markers in NO gel by microarray [BMSC (n = 2), ADSC (n = 2), triplicate] and real-time qPCR (triplicate, *P < 0.05, **P < 0.01, and ***P < 0.001) of the same samples with microarray.
Table S4. PCR primers.
View/request a protocol for this paper from Bio-protocol. REFERENCES AND NOTES
1. J. P. Cooke, D. W. Losordo, Nitric oxide and angiogenesis. Circulation 105, 2133–2135 (2002).
2. H. Nagasaka, T. Yorifuji, H. Egawa, A. Inui, T. Fujisawa, H. Komatsu, H. Tsukahara, S. Uemoto, Y. Inomata, Characteristics of NO cycle coupling with urea cycle in non-hyperammonemic carriers of ornithine transcarbamylase deficiency. Mol. Genet. Metab.
109, 251–254 (2013).
3. W. Du, K. Zhang, S. Zhang, R. Wang, Y. Nie, H. Tao, Z. Han, L. Liang, D. Wang, J. Liu, N. Liu, Z. Han, D. Kong, Q. Zhao, Z. Li, Enhanced proangiogenic potential of mesenchymal stem