Fourier-transform spectroscopy
using an Er-doped fiber
femtosecond laser by sweeping
the pulse repetition rate
Keunwoo Lee, Joohyung Lee†, Yoon-Soo Jang, Seongheum Han, Heesuk Jang, Young-Jin Kim‡ & Seung-Woo Kim
Femtosecond lasers allow for simultaneous detection of multiple absorption lines of a specimen over a broad spectral range of infrared or visible light with a single spectroscopic measurement. Here, we present an 8-THz bandwidth, 0.5-GHz resolution scheme of Fourier-transform spectroscopy using an Er-doped fiber femtosecond laser. A resolving power of 1.6 × 10⁴ about a 1560-nm center
wavelength is achieved by sweeping the pulse repetition rate of the light source on a fiber Mach-Zehnder interferometer configured to capture interferograms with a 0.02-fs temporal sampling accuracy through a well-stabilized 60-m unbalance arm length. A dual-servo mechanism is realized by combining a mechanical linear stage with an electro-optic modulator (EOM) within the fiber laser cavity, enabling stable sweeping control of the pulse repetition rate over a 1.0-MHz scan range with 0.4-Hz steps with reference to the Rb clock. Experimental results demonstrate that the P-branch lines of the H13CN reference cell can be observed with a signal-to-noise ratio reaching 350 for the
most intense line.
Diverse femtosecond pulse lasers are available nowadays as broad spectral light sources suited for simul-taneous spectroscopic detection of multiple absorption lines of a specimen1–5. Dispersive-type
spectros-copy techniques can be adopted for such broad spectral sources, but special care is needed to prepare precision prisms or gratings that has to be tailored to cover the enlarged spectral bandwidth with a high resolving power6–9. On the other hand, Fourier-transform (FT) spectroscopy techniques enable
flexible adjustment of the spectral bandwidth and the resolving power during the sampling process of the cross-correlation interferogram using a Michelson-type or equivalent two-arm interferometer10–14.
Traditional FT spectroscopy techniques produce the interferogram mechanically by elongating the inter-ferometer reference arm in scanning mode. Nonetheless, for the sake of high precision spectroscopy using femtosecond lasers, the reference arm scanning has to be performed with a sub-wavelength posi-tioning accuracy over a long travel distance of up to several meters14. The burden of precise mechanical
scanning can be relieved by combining a pair of femtosecond lasers of slightly different pulse repetition rates to form a multi-heterodyne light source15–22. This dual-comb FT spectroscopy technique permits
acquisition of the interferogram by sampling the heterodyne beat-frequency signal down-converted to the radio-frequency regime. However, in order to achieve high precision spectroscopy without the fre-quency ambiguity or aliasing caused by the Nyquist sampling limit, both the combs have to be stabilized
Department of Mechanical Engineering, Korea Advanced Institute of Science and Technology (KAIST), Science Town, Daejeon, 305-701, South Korea. †Present Address: Center for Space Optics, Korea Research Institute of Standards and Science (KRISS), Science Town, Daejeon, 305-340, South Korea. ‡Present Address: School of Mechanical and Aerospace Engineering, Nanyang Technological University (NTU), 639798, Singapore. Correspondence and requests for materials should be addressed to S.-W.K (email: [email protected])
Received: 04 December 2014 Accepted: 01 October 2015 Published: 27 October 2015
OPEN
www.nature.com/scientificreports/
in synchronization to each other20, or the heterodyne beat signal has to be monitored by combining a
set of continuous-wave lasers of known wavelengths22.
Repetition rate sweeping FT spectroscopy
In this investigation, as an alternative method, FT spectroscopy is performed by sweeping the repetition rate (fr) of the femtosecond laser being used as the light source. This fr-sweeping method eliminates the interferometer arm scanning of conventional FT by employing a PZT micro-actuator so as to stretch the cavity length of the femtosecond laser23. In fact, the f
r-sweeping method has already been successfully demonstrated not only for spectroscopy24 and lidar applications25 but also for long distance
measure-ments26 and pulse duration estimation27,28. In principle, the interference overlap between pulses scales
proportionally with the frequency range of fr-sweeping, but it is usually restrained to a few hundred Hz by the maximum elongation of the PZT micro-actuator. It is known that the interference overlap can be magnified significantly by providing a long unbalance length between the interferometer arms. However, such a long unbalance length is susceptible to the ambient temperature fluctuation which deteriorates the sampling accuracy and also the low signal-to-noise ratio in the resulting Fourier-transformed spectrum. Sampling errors may be corrected by incorporating a separate reference interferometer for elaborate tracing of the actual temporal variation of the unbalance length throughout the sampling process23.
Such a posteriori error compensation requires excessive data recording and subsequently a large amount of computation to reconstruct the undistorted interferogram; besides these problems, quantifying the uncertainty of the utilized reference interferometer with traceability to a certified frequency standard remains an essential task. In our study, to cope with the problems of the previous attempts of fr-sweeping FT spectroscopy, special care was given to the real-time stabilization of the unbalance length by devis-ing a dedicated length-monitordevis-ing interferometer. At the same time, the fr-sweeping was conducted by phase-locked control so that the FT sampling accuracy can be traceable to the Rb clock. In addition, emphasis was given to constructing a compact, robust FTS system demonstrating the effectiveness of fem-tosecond lasers as the light source for diverse spectroscopic applications over broad spectral bandwidths.
Results
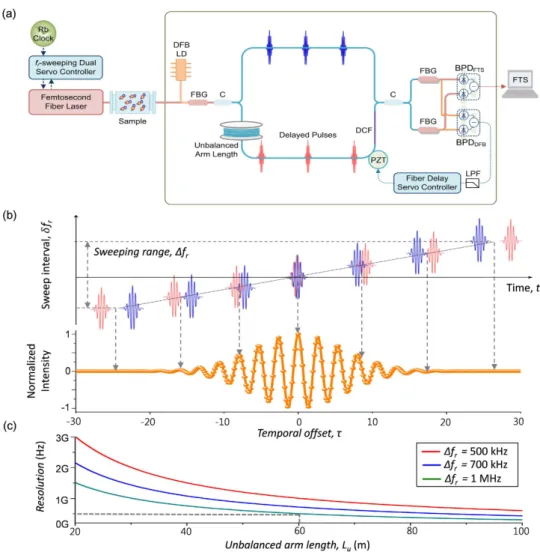
Overall FT spectrometer system design. For this study, we intended to demonstrate an enhanced fr-sweeping scheme of FT spectroscopy using an Er-doped fiber femtosecond laser. First, our FT spec-trometer system was designed to detect interferograms by configuring a two-arm fiber interferometer of Mach-Zehnder type with a 60-m unbalance arm length (Fig. 1). Second, sampling errors caused by the ambient disturbance of temperature and vibration were minimized by stabilizing the unbalance arm length within a fluctuation level of ~8 nm by embedding a homodyne length-locking control scheme inside the fiber interferometer (Fig. 2). Third, the required fr-sweeping was accomplished over a 1.0-MHz repetition rate range in 0.4-Hz steps with reference to the Rb clock. To accomplish this, a dual-servo control method was devised by combining a linear mechanical micro-stage and an electro-optic modula-tor (EOM) within the laser cavity of the Er-doped fiber light source (Fig. 3). Fourth, it was verified that the consequent fr-sweeping capability permitted a 0.02-fs accuracy in acquiring interferograms over an optical delay of 900 ps (Fig. 4). Fifth, the proposed FT spectrometer system was tested by measuring the absorption lines of the hydrogen cyanide (H13CN) reference gas cell (Fig. 5). Finally, the performance
of our spectrometer was evaluated by analyzing the measured the P-branch lines of the H13CN cell of
10-Torr (1.3 kPa) pressure over an 8-THz spectral bandwidth with a 0.5-GHz spectral resolution (Fig. 6).
Interferometer design for fr-sweeping FT spectroscopy. Figure 1a shows the two-arm fiber
interferometer designed in this investigation to attain the cross-correlation interferogram of the light source passing through the specimen. The light source is an Er-doped fiber laser made of a ring-type oscillator with a 3.0-m cavity length (l), which emits pulses of 120-fs duration at a nominal 100-MHz repetition rate (fr). A 60-m unbalance arm length (Lu) is provided by inserting a fiber spool in one interferometer arm. The temporal offset (τ ) between two pulses recombined at the interferometer exit is given as τ = m(1/fr) with m being an integer determined as m = int{Lu/l}. For Lu = ~60 m and l = ~3.0 m, the integer m becomes 20. For an increment of δ fr during fr-sweeping, the corresponding instantaneous variation of the temporal offset is given by δ τ = − m(1/fr2)δ fr. This indicates that m acts as an amplifica-tion factor that allows for a large total offset (Δ τ ) between pulses for a given fr-sweeping range (Δ fr) in the sampling process (Fig. 1b). In FT spectroscopy, a large Δ τ needs to be taken because the spectral resolution improves in proportion to 1/Δ τ . Considering that the achievable maximum value of Δ fr is about 1.0 MHz, the amplification factor m is set at 20, which extends Δ τ to 2.0 ns with a resulting spec-tral resolution of 0.5 GHz (Fig. 1c). Finally, the interferogram is detected using a balanced photo-detector (BPD) which offers a high level of common noise subtraction.
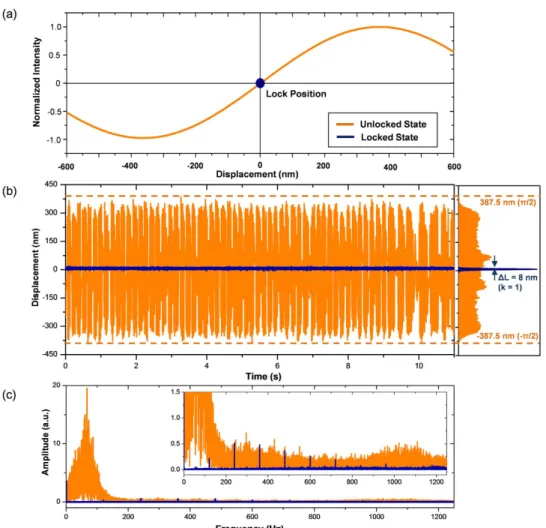
Unbalance arm length stabilization. Figure 2a shows how the unbalance arm length is stabilized by zero-locking of the interferometric phase generated from a continuous-wave DFB laser source which was installed through a fiber Bragg grating (FBG) to propagate together with the femtosecond laser source along the same interferometer arms (Fig. 1a). The DFB laser has a narrow 50-kHz linewidth about a 1550-nm center wavelength. The interferometric signal of the DFB laser is detected using a balanced photo-detector (BPD). For this process, a pair of fiber Bragg gratings (FBGs) of 100-GHz
transmission linewidth about a 1550-nm center wavelength was used for filtering out the DFB laser. The fiber material of the unbalance arm length has a thermal expansion coefficient of 9.2 × 10⁻⁶ m/m °C, so
the interferometric phase of the DFB laser undergoes a significant level of fluctuation arising from the ambient temperature change (Fig. 2b). For stabilization, a PZT-driven ring fiber bundle is inserted into the longer arm of the interferometer and controlled so that the interferometric phase is always locked to a zero-level phase reference (Fig. 2a). The zero-locking control bandwidth is 300 Hz, while the ambient disturbance mostly resides below 200 Hz (Fig. 2c). As a result, the interferometric phase is restrained at less than 0.01°, stabilizing the unbalance arm length within 8 nm (k = 1) (Fig. 2b). This stabilization level corresponds to the 0.02-fs temporal jitter in sampling the interferogram.
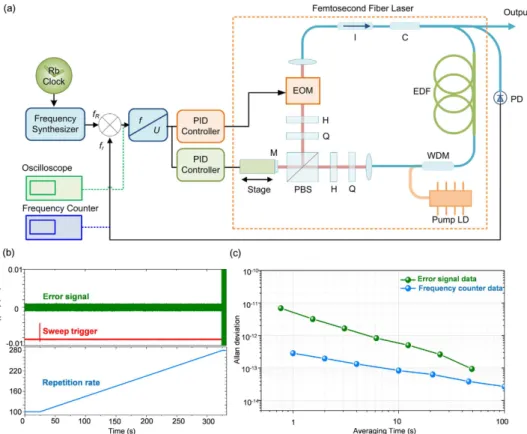
Dual-servo control for fr-sweeping over a wide dynamic range. The process of fr-sweeping demanded in our FT spectroscopy was accomplished using a dual-servo mechanism to control the ring-fiber cavity length of the laser source (Fig. 3a). The dual-servo mechanism was devised by combin-ing a mechanical stage of linear motion with an electro-optic modulator (EOM). The linear stage was driven by a stepping motor that provides coarse control over a long travel distance of tens of millimeters while moving the end position of the reflection mirror (M) installed inside the laser cavity. At the same time, fine control was achieved by the EOM which is made of a 40-mm thick MgO:LiNbO3 crystal to
yield a 1.5-μ m cavity elongation for a 200-V input, which induces a 40-Hz variation in fr-sweeping. The ramp-type command signal (fR) for fr-sweeping was generated using a frequency synthesizer that is synchronized to the Rb clock (2 × 10⁻¹¹ stability @ 1 s). At the same time, the error signal (f
R − fr) was monitored in real time using a frequency counter along with a digital oscilloscope; this signal was subsequently fed into the dual-servo control system to regulate both the linear stage and the EOM
Figure 1. (a) The unbalanced-arm fiber interferometer for FT spectroscopy by fr-sweeping; fr: pulse
repetition rate, DFB LD: distributed feedback laser diode, FBG: fiber Bragg grating, C: fiber coupler, DCF: dispersion-compensation fiber, BPDFTS: balanced photo-detector to monitor the interferogram of the
femtosecond laser source, BPDDFB: balanced photo-detector to monitor the homodyne interference signal of
DFB LD, LPF: low-pass filter. (b) Sampling of an interferogram with fr-sweeping. (c) Frequency resolution
www.nature.com/scientificreports/
simultaneously with control bandwidths of 1 kHz and 1 MHz, respectively. When fr-sweeping was con-ducted over a 180-kHz range during a 300-s time period, the error signal remained in the sub-mHz range (Fig. 3b) with a 5 × 10⁻¹² stability @ 1 s (Fig. 3c). This experimental result proves that our dual-servo
mechanism is capable of providing 0.5-mHz jitter (k = 1) in the sweeping process with direct trace-ability to the Rb clock. The fr-sweeping speed currently remains at a level of 600 Hz/s; it is limited by the Rb-clock-referenced signal generation speed of the frequency synthesizer used in our experi-ments even though the EOM is capable of responding to the command signal at 1.0-MHz bandwidth29.
The fr-sweeping will speed up when the bottlenecking frequency synthesizer is replaced with a faster, custom-made electronic device later on.
Interferogram sampling. The performance of our FT spectroscopy system was evaluated by observ-ing the P lines of the H13CN gas corresponding to 2ν
3 rotational-vibrational absorptions. Two different
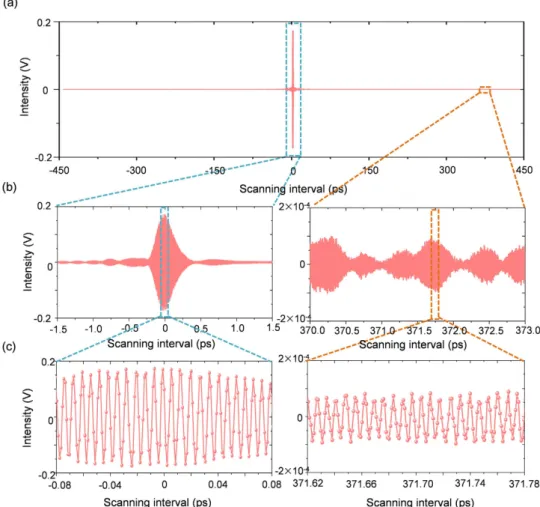
cells were used: one had an internal gas pressure of 100 Torr (13.3 kPa) and the other had an internal pressure of 10 Torr (1.33 kPa); both cells had the same length of 165 mm. Figure 4 shows an interferogram obtained using the 100-Torr cell, of which the absorption linewidth is 9-GHz in terms of full-width at half-maximum (FWHM)30,31. The requisite f
r-sweeping was provided over a range of 99.907–100.373 MHz with a step size of 0.4 Hz, i.e. Δ fr = 466 kHz and δ fr = 0.4 Hz, following a ramp-input fR command signal synthesized during a time period of 2,900 s. The cavity length underwent a 14-mm elongation. If the unbalance arm was set to zero, the cavity length extension should have been as long as 265 mm. The temporal sampling resolution was 0.76 fs over a temporal window size of 883 ps (Fig. 4a). The X300 magnified view (Fig. 4b) reveals that the cross-correlation interferogram between pulses appears to be nonsymmetrical. This is because the pulses passing through the long unbalance arm undergo a ~250-fs group delay due to dispersion, while the pulses of the short arm experience no significant dispersion. The X6000 magnified view (Fig. 4c) clearly shows a sinusoidal variation of the fundamental 1560-nm wave-length carrier signal seen underneath the interference envelop. The temporal sampling uncertainty is
Figure 2. (a) Concept of active stabilization of the interferometer unbalance arm length by zero-phase
locking of the embedded homodyne interferometer phase signal. (b) (Experiment) Zero-phase locking signals before and after stabilization. (c) Frequency distribution of the stabilized zero-phase locking signal with a magnified view (inset).
estimated to be 0.02 fs—one order of magnitude less than the 0.76-fs sampling resolution – being mainly influenced by the 8-nm thermal fluctuation of the unbalance arm length occurring during fr-sweeping (See Methods). Such high sampling accuracy reduces the noise level of the Fourier-transformed spec-trum so that the absorption lines of the specimen can be detected with better signal-to-noise ratio and consequently less uncertainty in their absolute frequency positions.
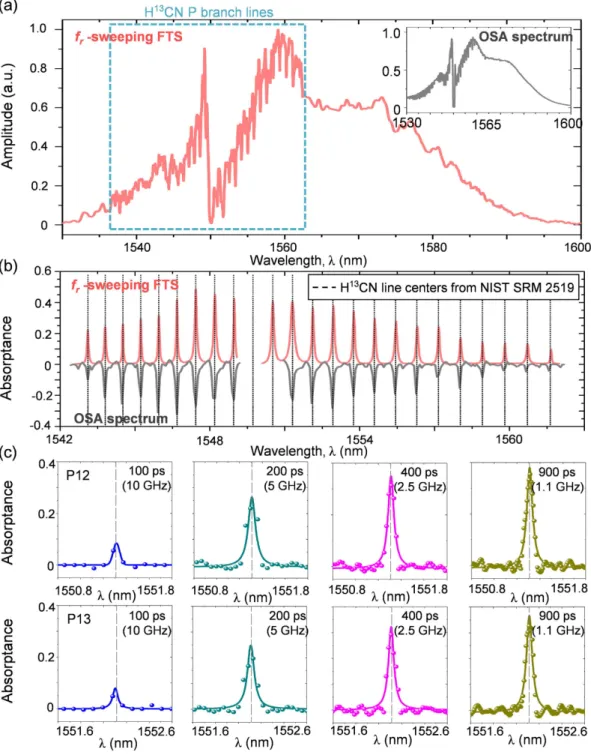
FT spectrum measurement. The sampled double-sided interferogram was processed by apodization with a Hanning function; it was then Fourier-transformed to obtain absorption spectra. No additional post-processing was necessary to compensate for the sampling error. An exemplary measured spectrum is shown in Fig. 5. The absorptance of the spectrum is calculated using the formula of Aλ = 1 − (I1/I0). I1 is the intensity of the radiation transmitted through the sample material; I0 is the total intensity of the incident radiation. The spectrum shown in Fig. 5a clearly reveals the absorption lines of the H13CN
cell (100-Torr pressure) over a spectral bandwidth of ~8 THz spanning the wavelength range of 1530– 1600 nm. The spectral distortion appearing near 1550 nm is due to a Kelly side peak which may be suppressed by dispersion control of the oscillator even though the effect of the peak on the spectrum measurement is minimal. The achieved frequency resolution is estimated to be 1.1 GHz, equivalent to 0.01 nm in wavelength, which is sufficient to resolve absorption peaks of 9-GHz linewidth31 as shown in
Fig. 5b. The P-branch H13CN line positions were fitted by Lorentzian profile (Methods). For comparison,
a raw spectrum obtained from the same H13CN cell using a commercial optical spectrum analyzer (OSA)
made of a diffraction grating of 8 GHz resolution is included in Fig. 5b. It should also be noted that when the time window size is reduced from 900 ps to 100 ps (Fig. 5c) by restricting the temporal offset (Δ τ ) in sampling, the measured absorption profiles become shallower in depth and more dispersed in width. This consequently weakens the resolving power, deteriorating the system’s ability to accurately identify the absolute peak positions.
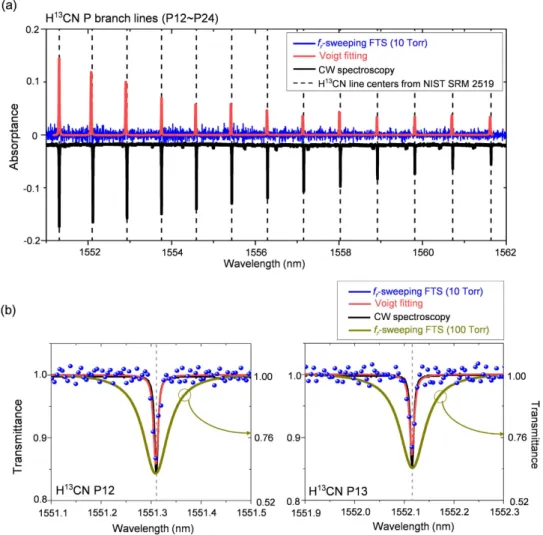
0.5-GHz resolution FT spectroscopy. Figure 6 shows another set of experimental result in which the absorption lines of the 10-Torr H13CN cell (typical linewidth: 1.0 GHz) were measured with enhanced
resolving power. For this experiment, fr-sweeping was conducted over a range of 1.05 MHz with a step size of 0.4 Hz so as to achieve an enlarged window size of 2.0 ns. The temporal sampling resolution was maintained at 0.76 fs as before. The time consumed to synthesize the ramp-input command fR signal in synchronization with the Rb clock was 6,200 s. As results, absorption lines were observed over the same
Figure 3. (a) System layout of dual-servo control for stable fr-sweeping. (b) Experimental results of fr
-sweeping. The command fR signal (blue) for fr-sweeping as initiated by the trigger signal (red) and the error
signal of fR − fr (green) used as the control input. (c) Allan deviations of the fR − fr error signal (green) and
www.nature.com/scientificreports/
spectral range of ~8 THz that was used in the previous experiment; however, frequency resolution was enhanced to 0.5 GHz. Voigt-fitted P12 and P13 absorption lines (Fig. 6b) were clearly resolved their 1.0-GHz linewidth profiles, which was not possible in the previous experiment when the frequency resolution was set at 1.1 GHz (Fig. 5). The enhanced resolution also allowed for improved identification of line peaks, Voigt-fitted line centers had discrepancies of 35 MHz (k = 1) from their certified absolute positions30. The signal-to-noise ratio was found to be 350 for the most intense line. This result was
com-pared to the case achieved using a continuous-wave laser (Fig. 6b) which offered approximately 12% higher peak amplitudes with 3-MHz resolution.
Discussion
Our fr-sweeping experimental work demonstrates 8-THz bandwidth, 0.5-GHz resolution FT spectros-copy, which offers a 1.6 × 10⁴ resolving power about a 1560-nm center wavelength. The line center
dis-crepancy between the Voigt-fitted P-branch line positions of the H13CN reference cell and their certified
frequency positions is ~35 MHz. This identification accuracy of absolute peak positions is attributable to the temporal sampling uncertainty of 0.02 fs achieved by stabilization of the unbalance arm length as well as continuous real-time referencing of the repetition rate to the Rb clock during fr-sweeping. It is anticipated that the proposed scheme of fr-sweeping FT spectroscopy can be exploited for diverse applications particularly for simultaneous observation of multiple chemical components of air-pollution in the atmosphere.
Methods
Temporal sampling accuracy. In our FT spectroscopy experiment, the temporal sampling accuracy is affected dominantly by two stability factors related to the pulse repetition rate (fr) and the unbalance arm length (Lu). First, dual-servo control of the fr-sweeping (Fig. 3) was found to provide a 0.5-mHz jitter level (k = 1) in the instantaneous value of fr throughout the sweeping process, leading to a 0.0002 fs contribution to the sampling accuracy. Second, zero-locking stabilization control of the homodyne
Figure 4. Interferogram measurement of the light source passing through the H13CN gas cell of
100-Torr pressure. (a) Overall interferogram obtained during fr-sweeping under PLL stabilization to the Rb
clock. (b) Magnified views (X300) at two different optical delays. (c) Magnified views (X6000) showing the sinusoidal carrier signal resolved inside the pulse envelope.
interferometric phase (Fig. 2) was performed within an 8-nm jitter level (k = 1) for the given Lu of 60 m; this resulted in a 0.02-fs level of sampling accuracy. Combining the two stability factors, the standard deviation of the temporal sampling accuracy is estimated to be σ τ = [(0.0002 fs)2 + (0.02 fs)2]1/2 = 0.02 fs.
Absorption line fitting. For the 10-Torr H13CN cell used in our experiment, a Voigt profile was
found more suitable to fit absorption line shapes since the line broadening is known to be affected by both the intermolecular collision of a Lorentzian profile and the Doppler effect of a Gaussian profile. The Voigt function used in our fitting is; y = A{2ln(2)ΓL/(π 1.5ΓG2)}ʃ exp(−t2)/[{sqrt(ln2)(ΓL/ΓG)}2 + {sqrt(4ln2)
(ω − ω0)/ΓG − t}2] dt where A is the amplitude, ΓL the full width at half maximum (FWHM) of the
Figure 5. (a) Normalized absorption spectrum (red) of the H13CN cell of 100-Torr pressure (9-GHz
absorption linewidth) measured by fr-sweeping FTS. For comparison, another spectrum (inset) is shown of
the same H13CN cell measured using a commercial optical spectrum analyzer (OSA) of 8-GHz resolution.
(b) Absorptance spectra of P-branch lines of the H13CN cell. (c) Magnified views of absorptance spectra for
www.nature.com/scientificreports/
Lorentzian function, ΓG the FWHM of the Gaussian function, ω the angular frequency, and ω0 the
res-onance angular frequency20,30. On the other hand, for the 100-Torr HCN cell of which the line
broaden-ing is dominated by intermolecular collisions, absorption lines were fitted by the Lorentzian function of y = (A/π )[Γ /{(ω − ω 0)2 + Γ 2}] where A is the amplitude, Γ is the full width at half maximum (FWHM),
ω is the angular frequency, and ω 0 is the resonance angular frequency20,30.
References
1. Hult, J., Watt, R. S. & Kaminski, C. F. High bandwidth absorption spectroscopy with a dispersed supercontinuum source. Opt.
Express 15, 11385–11395 (2007).
2. Langridge, J. M. et al. Cavity enhanced absorption spectroscopy of multiple trace gas species using a supercontinuum radiation source. Opt. Express 16, 10178–10188 (2008).
3. Adler, F. et al. Mid-infrared Fourier transform spectroscopy with a broadband frequency comb. Opt. Express 18, 21861–21872 (2010).
4. Zolot, A. M. et al. Direct-comb molecular spectroscopy with accurate, resolved comb teeth over 43 THz. Opt. Lett. 37, 638–640 (2012).
5. Sanders, S. T. Wavelength-agile fiber laser using group-velocity dispersion of pulsed super-continua and application to broadband absorption spectroscopy. Appl. Phys. B 75, 799–802 (2002).
6. Wang, S. X., Xiao, S. & Weiner, A. M. Broadband, high spectral resolution 2-D wavelength-parallel polarimeter for Dense WDM Systems. Opt. Express 13, 9374–9380 (2005).
7. Diddams, S., Hollberg, L. & Mbele, V. Molecular fingerprinting with spectrally-resolved modes of a femtosecond laser frequency comb. Nature 445, 627–630 (2007).
8. Thorpe, M. J., Clausen, D. B., Kirchner, M. S. & Ye, J. Cavity-enhanced optical frequency comb spectroscopy: application to human breath analysis. Opt. Express 16, 2387–2397 (2008).
9. Thorpe, M. J. & Ye, J. Cavity-enhanced direct frequency comb spectroscopy. Appl. Phys. B 91, 397–414 (2008).
10. Tillman, K. A., Maier, R. R. J., Reid, D. T. & McNaghten, E. D. Mid-infrared absorption spectroscopy across a 14.4 THz spectral range using a broadband femtosecond optical parametric oscillator. Appl. Phys. Lett. 85, 3366–3368 (2004).
Figure 6. (a) Spectra of the H13CN cell of 10-Torr pressure (1.0-GHz absorption linewidth) measured using
0.5-GHz resolution fr-sweeping FTS and a tunable continuous-wave (CW) laser (3-MHz linewidth). Raw
experimental data (blue dots) of the fr-sweeping FTS used for Voigt fitting are plotted in the background. (b)
Voigt-fitted absorption lines of P12 & P13 of the 10-Torr H13CN cell. For comparison, the absorption lines
11. Mandon, J. et al. Femtosecond laser Fourier transform absorption Spectroscopy. Opt. Lett. 32, 1677–1679 (2007).
12. Mandon, J., Guelachvili, G. & Picque, N. Fourier transform spectroscopy with a laser frequency comb. Nature Photon. 3, 99–102 (2009).
13. Helbing, J. & Hamm, P. Compact implementation of Fourier transform two-dimensional IR spectroscopy without phase ambiguity. J. Opt. Soc. Am. B 28, 171–178 (2011).
14. Balling, P. et al. Length and refractive index measurement by Fourier transform interferometry and frequency comb spectroscopy.
Meas. Sci. Technol. 23, 094001 (2012).
15. Schiller, S. Spectrometry with frequency combs. Opt. Lett. 27, 766–768 (2002).
16. Keilmann, F., Gohle, C. & Holzwarth, R. Time-domain mid-infrared frequency-comb spectrometer. Opt. Lett. 29, 1542–1544 (2004).
17. Giaccari, P. et al. Active Fourier-transform spectroscopy combining the direct RF beating of two fiber based mode-locked lasers with a novel referencing method. Opt. express 16, 4347–4365 (2008).
18. Coddington, I., Swann, W. C. & Newbury, N. R. Coherent multi heterodyne spectroscopy using stabilized optical frequency combs. Phys. Rev. Lett. 100, 13902 (2008).
19. Bernhardt, B. et al. Cavity-enhanced dual-comb spectroscopy. Nature Photon. 4, 55–57 (2010).
20. Coddington, I., Swann, W. C. & Newbury, N. R. Coherent dual-comb spectroscopy at high signal-to-noise ratio. Phys. Rev. A 82, 043817 (2010).
21. Baumann, E. et al. Spectroscopy of the methane ν3 band with an accurate midinfrared coherent dual-comb spectrometer. Phys.
Rev. A 84, 062513 (2011).
22. Ideguchi, T., Poisson, A., Guelachvili, G., Picque, N. & Hansch, T. W. Adaptive real-time dual-comb spectroscopy. Nat. Commun. 5, 3375 (2014).
23. Potvin, S., Boudreau, S., Deschenes, J.-D. & Genest, J. Fully referenced single-comb interferometry using optical sampling by laser-cavity tuning. Appl. Opt. 52, 248–255 (2013).
24. Wilk, R., Hochrein, T., Koch, M., Mei, M. & Holzwarth, R. Terahertz spectrometer operation by laser repetition frequency tuning.
J. Opt. Soc. Am. B 28, 592–595 (2011).
25. Yang, L., Nie, J. & Duan, L. Dynamic optical sampling by cavity tuning and its application in lidar. Opt. Express 21, 3850–3860 (2013).
26. Joo, W.-D. et al. Femtosecond laser pulses for fast 3-D surface profilometry of microelectronic step-structures. Opt. Express 21, 15323–15334 (2013).
27. Hochrein, T. et al. Optical sampling by laser cavity tuning. Opt. Express 18, 1613–1617 (2010).
28. Wilk, R., Hochrein, T., Koch, M., Mei, M. & Holzwarth, R. OSCAT: Novel technique for time-resolved experiments without moveable optical delay lines. J Infrared Milli. Terahz. Waves 32, 596–602 (2011).
29. Baumann, E. et al. High-performance, vibration-immune, fiber-laser frequency comb. Opt. Lett. 34, 638–640 (2009).
30. Gilbert, S. L., Swann, W. C. & Wang, C.-M. Hydrogen Cyanide H13C14N Absorption Reference for 1530-1560 nm Wavelength
Calibration—SRM 2519. NIST Special Publication 260–137 (1998).
31. Swann, W. C. & Gilbert, S. L. Line centers, pressure shift, and pressure broadening of 1530–1560 nm hydrogen cyanide wavelength calibration lines. J. Opt. Soc. Am. B 22, 1749–1756 (2005).
Acknowledgements
This work was supported by the National Honour Scientist Program funded by the National Research Foundation of the Republic of Korea (NRF-2012R1A3A1050386).
Author Contributions
The project was planned and overseen by S.-W.K. and Y.-J.K. Experimental apparatus was designed and built by K.L., J.L., Y.-S.J., S.H. and H.J. and experiment work along with data analysis was done by K.L. All authors contributed to the manuscript preparation.
Additional Information
Competing financial interests: The authors declare no competing financial interests.
How to cite this article: Lee, K. et al. Fourier-transform spectroscopy using an Er-doped fiber
femtosecond laser by sweeping the pulse repetition rate. Sci. Rep. 5, 15726; doi: 10.1038/srep15726 (2015).
This work is licensed under a Creative Commons Attribution 4.0 International License. The images or other third party material in this article are included in the article’s Creative Com-mons license, unless indicated otherwise in the credit line; if the material is not included under the Creative Commons license, users will need to obtain permission from the license holder to reproduce the material. To view a copy of this license, visit http://creativecommons.org/licenses/by/4.0/