저작자표시-비영리-변경금지 2.0 대한민국 이용자는 아래의 조건을 따르는 경우에 한하여 자유롭게 l 이 저작물을 복제, 배포, 전송, 전시, 공연 및 방송할 수 있습니다. 다음과 같은 조건을 따라야 합니다: l 귀하는, 이 저작물의 재이용이나 배포의 경우, 이 저작물에 적용된 이용허락조건 을 명확하게 나타내어야 합니다. l 저작권자로부터 별도의 허가를 받으면 이러한 조건들은 적용되지 않습니다. 저작권법에 따른 이용자의 권리는 위의 내용에 의하여 영향을 받지 않습니다. 이것은 이용허락규약(Legal Code)을 이해하기 쉽게 요약한 것입니다. Disclaimer 저작자표시. 귀하는 원저작자를 표시하여야 합니다. 비영리. 귀하는 이 저작물을 영리 목적으로 이용할 수 없습니다. 변경금지. 귀하는 이 저작물을 개작, 변형 또는 가공할 수 없습니다.
: , . IgE , IgE . , , -5 IgE . : 18 , 2011 10 2015 3 , , -5 IgE 196 . 2 ‘ (wheat allergy, WA)’, ‘
(non-wheat allergy, Non-WA)’ , WA ‘ (wheat allergy
with anaphylaxis, WAAna)’ 2
‘ (wheat allergy without anaphylaxis, WA
.
: 46 , WA 35
WAAna 17 , WANon-Ana 18 Non-WA 161 . WA
Non-WA , , -5 IgE
(P<0.001).
optimal cutoff point , , , -5
IgE cutoff point 0.9 kUA/L 0.43 kUA/L, 0.19 kUA/L
-5 IgE IgE , IgE
(78%) (94%) . IgE
IgE -5
IgE WAAna WANon-Ana optimal
cutoff point 1.56 kUA/L ( 77%, 78%) . IgE (accuracy) , -5 IgE . : , , -5 IgE , -5 IgE .
v 1 4 A. 4 B. 5 6 15 19 20 ABSTRACT 25
Fig. 1. Receiver operating characteristic curves represent sensitivity and specificity of specific IgE to wheat (solid), gluten (dotted) -5 gliadin (dashed).
Table 1. Clinical characteristic of study subjects --- (7)
Table 2. IgE antibody levels to wheat, -5 gliadin, and gluten in subjects --- (10)
Table 3. Diagnostic performance of specific IgE to wheat, gluten and -5 gliadin at different cutoff points --- (11)
Table 4. Comparison of 3 diagnostic methods for clinical prediction of wheat allergy
I.
, , ,
, , , ,(Boyce et al., 2010;
Burks et al., 2012) , , , , , , ,
.(Kim et al., 2011; Ahn et al., 2012; et al., 2012) 70% 2014 1 33.6kg 1975 .(http://www.kofmia.org) , , 0.1-1.3%, 0-0.5%, 0.2-1.2% , 6 0.37% , 1
0.08% .(Zuidmeer et al., 2008; Kim et al., 2011; Lee et al., 2013a)
IgE IgE ,
IgE ,
, ,
(food-dependent exercise-induced anaphylaxis, FDEIA) .(Inomata, 2009)
IgE , IgE
.(Boyce et al., 2010) IgE
,
, .(Boyce et al., 2010)
IgE (positive decision point)
,
, (component-resolved diagnosis)
.(Sampson, 2001; Nilsson et al., 2015) (gluten) non-gluten
, 70% (gliadin)
(glutenin) .(Morita et al., 2009)
(wheat-dependent exercise-induced anaphylaxis, WDEIA) -5 ( -5 gliadin)
WDEIA .(Inomata, 2009; Morita
et al., 2009) -5
IgE
.(Beyer et al., 2008;
Ebisawa et al., 2012) -5
IgE (Lee et al., 2013b)
,
-5 IgE
II.
A. 2011 10 18 2015 3 6 , , , -5 IgE 18 196 .ImmunoCAP (Phadia, Uppsala, Sweden) , ,
. 2
, ‘
(wheat allergy, WA)’
‘ (non-wheat allergy, Non-WA)’ ,
. WA (Sampson
et al., 2006) ‘ (wheat allergy with anaphylaxis, WAAna)’
2 ‘
(wheat allergy without anaphylaxis, WANon-Ana)’ .
B.
IBM SPSS Statistics ver. 22.0 (IBM Co., Armonk, NY,
USA) t-test Mann-Whitney test .
Receiver Operating Characteristic (ROC) curve .
III.
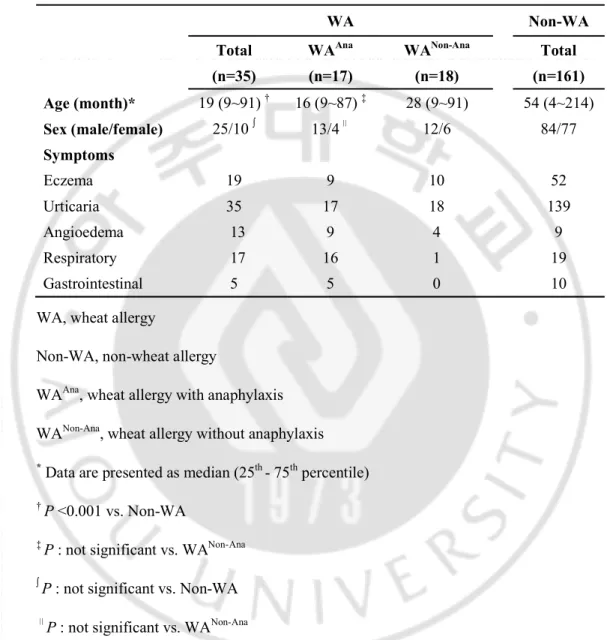
A. 196 109 87 , 46 ( , 4~214 ) . WA 35 WAAna 17 , WANon-Ana 18 , Table 1 . . Non-WA 161 52 (32%) , 139 (86%) , 9 (6%) , 19 (12%) , 10 (6%) , . WA Non-WA 19 54 (P<0.001).Table 1. Clinical characteristic of study subjects WA Non-WA Total (n=35) WAAna (n=17) WANon-Ana (n=18) Total (n=161) Age (month)* 19 (9~91) † 16 (9~87) ‡ 28 (9~91) 54 (4~214) Sex (male/female) 25/10 13/4 12/6 84/77 Symptoms Eczema 19 9 10 52 Urticaria 35 17 18 139 Angioedema 13 9 4 9 Respiratory 17 16 1 19 Gastrointestinal 5 5 0 10
WA, wheat allergy
Non-WA, non-wheat allergy
WAAna, wheat allergy with anaphylaxis
WANon-Ana, wheat allergy without anaphylaxis
*Data are presented as median (25th - 75thpercentile) †P <0.001 vs. Non-WA
‡P : not significant vs. WANon-Ana
P : not significant vs. Non-WA P : not significant vs. WANon-Ana
B. (WA) IgE
IgE , IgE , -5 IgE
WA 15.40 kUA/L, 22.80 kUA/L, 1.49 kUA/L , Non-WA
0.07 kUA/L, 0.03 kUA/L, 0.05 kUA/L WA Non-WA
(Table 2).
ImmunoCAP ROC curve
IgE AUC , IgE
0.976 (Fig.1A). Youden
optimal cutoff point
, IgE, IgE, -5 IgE
optimal cutoff point 0.90 kUA/L, 0.43 kUA/L, 0.19 kUA/L (Table 3).
WA Non-WA IgE
100% ,
-5 IgE 94%, 78% .
ImmunoCAP (assay cutoff point) 0.35 kUA/L
IgE , IgE , -5 IgE
100%, 100%, 71.4%, 80%, 86%, 97% .
95% ,
IgE , IgE , -5 IgE
3.12 kUA/L, 2.61 kUA/L, 0.21 kUA/L . 97%
IgE IgE 0.9
. -5 IgE 95%
0.06 kUA/L 89% .
C. (WAAna) (WANon-Ana)
IgE
IgE , IgE , -5 IgE
WAAna 15.40 kU A/L, 22.80 kUA/L, 3.49 kUA/L WANon-Ana 13.35 kUA/L, 17.48 kUA/L, 0.34 kUA/L -5 IgE (Table 2). 0.35 kUA/L -5 IgE 100% 22% .
ImmunoCAP ROC curve , -5
IgE 0.743 AUC (Fig.1B). -5
IgE optimal cutoff point 1.56 kUA/L , ,
, , 77%, 78%, 77%, 78% (Table 3).
-5 IgE 6.92 kUA/L 83%
, 0.21 kUA/L 94%
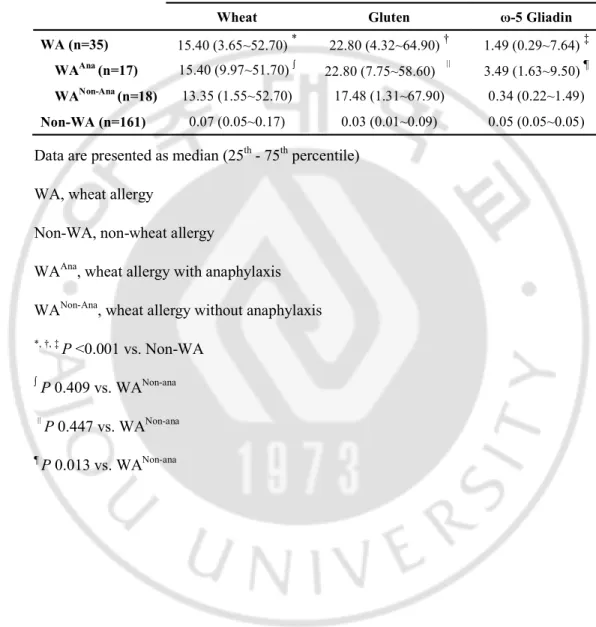
Table 2. IgE antibody levels to wheat, -5 gliadin, and gluten in subjects IgE antibody level (kUA/L)
Wheat Gluten -5 Gliadin
WA (n=35) 15.40 (3.65~52.70) * 22.80 (4.32~64.90) † 1.49 (0.29~7.64) ‡ WAAna (n=17) 15.40 (9.97~51.70)
22.80 (7.75~58.60) 3.49 (1.63~9.50) ¶ WANon-Ana (n=18) 13.35 (1.55~52.70) 17.48 (1.31~67.90) 0.34 (0.22~1.49) Non-WA (n=161) 0.07 (0.05~0.17) 0.03 (0.01~0.09) 0.05 (0.05~0.05)
Data are presented as median (25th- 75thpercentile)
WA, wheat allergy
Non-WA, non-wheat allergy
WAAna, wheat allergy with anaphylaxis
WANon-Ana, wheat allergy without anaphylaxis *, †, ‡P <0.001 vs. Non-WA
P 0.409 vs. WANon-ana P 0.447 vs. WANon-ana ¶P 0.013 vs. WANon-ana
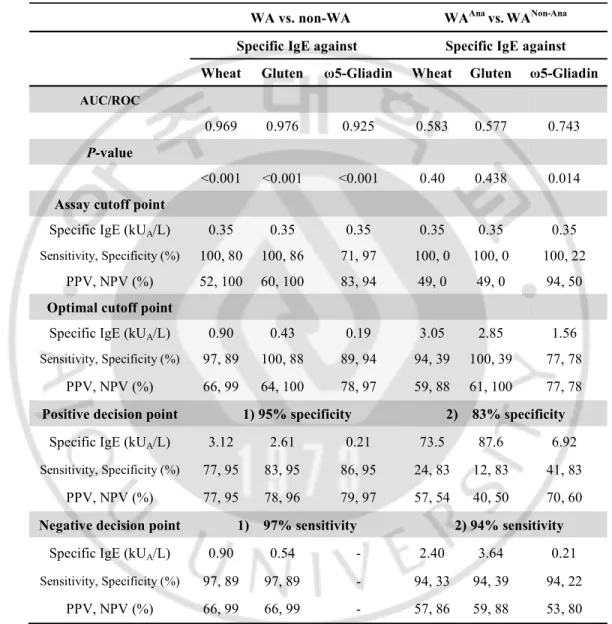
Table 3. Diagnostic performance of specific IgE to wheat, gluten and -5 gliadin at different cutoff points
WA vs. non-WA WAAna vs. WANon-Ana Specific IgE against Specific IgE against Wheat Gluten -Gliadin Wheat Gluten -Gliadin
AUC/ROC
0.969 0.976 0.925 0.583 0.577 0.743 P-value
<0.001 <0.001 <0.001 0.40 0.438 0.014 Assay cutoff point
Specific IgE (kUA/L) 0.35 0.35 0.35 0.35 0.35 0.35 Sensitivity, Specificity (%) 100, 80 100, 86 71, 97 100, 0 100, 0 100, 22
PPV, NPV (%) 52, 100 60, 100 83, 94 49, 0 49, 0 94, 50 Optimal cutoff point
Specific IgE (kUA/L) 0.90 0.43 0.19 3.05 2.85 1.56 Sensitivity, Specificity (%) 97, 89 100, 88 89, 94 94, 39 100, 39 77, 78
PPV, NPV (%) 66, 99 64, 100 78, 97 59, 88 61, 100 77, 78 Positive decision point 1) 95% specificity 2) 83% specificity
Specific IgE (kUA/L) 3.12 2.61 0.21 73.5 87.6 6.92 Sensitivity, Specificity (%) 77, 95 83, 95 86, 95 24, 83 12, 83 41, 83
PPV, NPV (%) 77, 95 78, 96 79, 97 57, 54 40, 50 70, 60 Negative decision point 1) 97% sensitivity 2) 94% sensitivity
Specific IgE (kUA/L) 0.90 0.54 - 2.40 3.64 0.21 Sensitivity, Specificity (%) 97, 89 97, 89 - 94, 33 94, 39 94, 22
PPV, NPV (%) 66, 99 66, 99 - 57, 86 59, 88 53, 80
WA, wheat allergy; Non-WA, non-wheat allergy; WAAna, wheat allergy with anaphylaxis;
WANon-Ana, wheat allergy without anaphylaxis ; AUC, area under the curve; ROC,
receiver operating characteristic; PPV, positive predictive value; NPV, negative predictive value
(A)
(B)
Fig.1 Receiver operating characteristic curves represent sensitivity and specificity of specific IgE to wheat (solid), gluten (dotted) -5 gliadin (dashed). (A) WA vs.
Non-WA, (B) WAAna vs. WANon-Ana. The numbers in parentheses indicate AUC
values ;WA, wheat allergy ; Non-WA, non-wheat allergy ; WAAna, wheat allergy with
D. IgE
(accuracy)
, IgE, IgE, -5 IgE
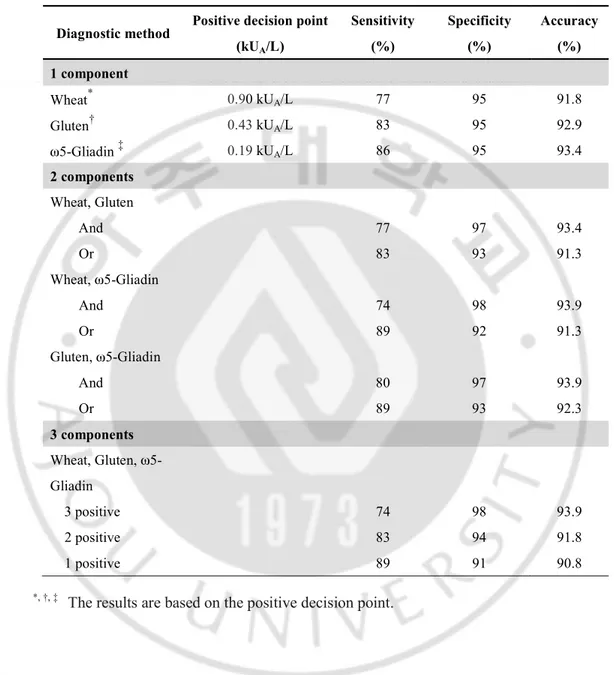
91.8%, 92.9%, 93.4% . IgE IgE 93.4% , 91.3% . IgE -5 IgE IgE -5 IgE 93.9% , 91.3%, 92.3% . IgE , , ,
93.9%, 91.8%, 90.8% (Table 4). WAAna WANon-Ana -5
IgE .
Table 4. Comparison of 3 diagnostic methods for clinical prediction of wheat allergy Diagnostic method Positive decision point
(kUA/L) Sensitivity (%) Specificity (%) Accuracy (%) 1 component Wheat* 0.90 kUA/L 77 95 91.8 Gluten† 0.43kUA/L 83 95 92.9 -Gliadin ‡ 0.19 kUA/L 86 95 93.4 2 components Wheat, Gluten And 77 97 93.4 Or 83 93 91.3 Wheat, -Gliadin And 74 98 93.9 Or 89 92 91.3 Gluten, -Gliadin And 80 97 93.9 Or 89 93 92.3 3 components Wheat, Gluten, -Gliadin 3 positive 74 98 93.9 2 positive 83 94 91.8 1 positive 89 91 90.8
IV.
, IgE .(Boyce et al., 2010; Canonica et al., 2013) IgE (ImmunoCAP) , , IgE.(Sampson, 2001; Perry et al., 2004; Pourpak et al., 2004; Keet et al., 2009; Canonica et al., 2013) IgE ,
IgE , -5 IgE
.
IgE ROC curve WA
Non-WA IgE , IgE , -5
IgE AUC 0.969, 0.976, 0.925 ,
(P<0.001). assay cutoff point (0.35
kUA/L) IgE , IgE
52% 60% , -5
al., 2015) IgE 52%, -5 IgE 80% . Sampson (Sampson, 2001) IgE 26 kUA/L, 74% , 26 kUA/L 91% . , , , , .
optimal cutoff point
IgE IgE cutoff point
0.9 kUA/L 0.43 kUA/L , -5 IgE 0.19
kUA/L assay cutoff point 0.35 kUA/L .
-5 IgE IgE , IgE
(78%) , (94%) . 95% IgE , IgE , -5 IgE 77%, 78%, 79% , 97% IgE IgE 99% . -5 IgE 95% . IgE cutoff point
.(Palosuo et al., 2001; Shibata et al., 2011; Makela et al., 2014; Nilsson et al., 2015) IgE , IgE , IgE 0.9 - 3.12 kUA/L, 0.54 - 2.61 kUA/L . Non-WA 161 3 IgE 20.5 kUA/L, 27.1 kUA/L, 46.2 kUA/L . IgE . -5 IgE 95% .
Sampson (Sampson and Ho, 1997) , ,
IgE IgE
.
IgE -5 IgE WAAna WANon-Ana
,
.(Beyer et al., 2008; Ito et al., 2008; Ebisawa et al., 2012; Makela et al.,
2014; Nilsson et al., 2015) -5
IgE optimal cutoff point 1.56 kUA/L ( 77%, 78%)
, -5
. IgE . (accuracy) , IgE 91% -5 IgE , . , -5 IgE . , IgE , IgE -5 IgE , optimal cutoff point IgE , -5 IgE .
V.
, , -5 IgE
,
-5 IgE
1. , , , , , , , , , :
. 32: 169-175, 2012
2. Ahn K, Kim J, Hahm MI, Lee SY, Kim WK, Chae Y, Park YM, Han MY, Lee KJ, Kim JK, Yang ES, Kwon HJ: Prevalence of immediate-type food allergy in Korean schoolchildren: a population-based study. Allergy Asthma Proc 33: 481-487, 2012
3. Beyer K, Chung D, Schulza G, Mishoeb M, Niggemann B, Wahn U, Sam -5 gliadin IgE antibodies as a diagnostic to ol for wheat allergy in childhood J Allergy Clin Immunol 122: 419-421, 2 008
4. Boyce JA, Assa'ad A, Burks AW, Jones SM, Sampson HA, Wood RA, Pl aut M, Cooper SF, Fenton MJ, Arshad SH, Bahna SL, Beck LA, Byrd-Bre dbenner C, Camargo CA, Jr., Eichenfield L, Furuta GT, Hanifin JM, Jones C, Kraft M, Levy BD, Lieberman P, Luccioli S, McCall KM, Schneider LC, Simon RA, Simons FE, Teach SJ, Yawn BP, Schwaninger JM, Panel NI-SE: Guidelines for the Diagnosis and Management of Food Allergy in t he United States: Summary of the NIAID-Sponsored Expert Panel Report.
5. Burks AW, Tang M, Sicherer S, Muraro A, Eigenmann PA, Ebisawa M, F iocchi A, Chiang W, Beyer K, Wood R, Hourihane J, Jones SM, Lack G,
Sampson HA: ICON: food allergy. J Allergy Clin Immunol 129: 906-920, 2012
6. Canonica GW, Ansotegui IJ, Pawankar R, Schmid-Grendelmeier P, van Ha ge M, Baena-Cagnani CE, Melioli G, Nunes C, Passalacqua G, Rosenwass er L, Sampson H, Sastre J, Bousquet J, Zuberbier T, Wao-Aria-Ga2Len Ta sk Force: Katrina Allen RABBLCFdBMERMGSGDTHSHTJ: A WAO -ARIA - GA(2)LEN consensus document on molecular-based allergy diagno stics. World Allergy Organ J 6: 17, 2013
7. Ebisawa M, Shibata R, Sato S, Borres MP, Ito K: Clinical utility of IgE a ntibodies to omega-5 gliadin in the diagnosis of wheat allergy: a pediatric multicenter challenge study. Int Arch Allergy Immunol 158: 71-76, 2012 8. http://www.kofmia.org
9. Inomata N: Wheat allergy. Curr Opin Allergy Clin Immunol 9: 238-243, 2 009
10. Ito K, Futamura M, Borres MP, Takaoka Y, Dahlstrom J, Sakamoto T, Ta naka A, Kohno K, Matsuo H, Morita E: IgE antibodies to omega-5 gliadin associate with immediate symptoms on oral wheat challenge in Japanese c hildren. Allergy 63: 1536-1542, 2008
11. Keet CA, Matsui EC, Dhillon G, Lenehan P, Paterakis M, Wood RA: The natural history of wheat allergy. Ann Allergy Asthma Immunol 102: 410-4
15, 2009
12. Kim J, Chang E, Han Y, Ahn K, Lee SI: The incidence and risk factors of immediate type food allergy during the first year of life in Korean infa nts: a birth cohort study. Pediatr Allergy Immunol 22: 715-719, 2011 13. Lee AJ, Thalayasingam M, Lee BW: Food allergy in Asia: how does it co
mpare? Asia Pac Allergy 3: 3-14, 2013a
14. Lee SE, Lee SY, Jo EJ, Kim MY, Kim SH, Chang YS: Wheat-Induced A naphylaxis in Korean Adults: A Report of 6 Cases Clin Nutr Res 2: 76-79, 2013b
15. Makela MJ, Eriksson C, Kotaniemi-Syrjanen A, Palosuo K, Marsh J, Borre s M, Kuitunen M, Pelkonen AS: Wheat allergy in children - new tools for
diagnostics. Clin Exp Allergy 44: 1420-1430, 2014
16. Morita E, Matsuo H, Chinuki Y, Takahashi H, Dahlstrom J, Tanaka A: Fo od-dependent exercise-induced anaphylaxis -importance of omega-5 gliadin and HMW-glutenin as causative antigens for wheat-dependent exercise-indu ced anaphylaxis. Allergol Int 58: 493-498, 2009
17. Nilsson N, Sjolander S, Baar A, Berthold M, Pahr S, Vrtala S, Valenta R, Morita E, Hedlin G, Borres MP, Nilsson C: Wheat allergy in children ev aluated with challenge and IgE antibodies to wheat components. Pediatr Al
lergy Immunol 26: 119-125, 2015
18. Palosuo K, Varjonen E, Kekki OM, Klemola T, Kalkkinen N, Alenius H, Reunala T: Wheat omega-5 gliadin is a major allergen in children with im
mediate allergy to ingested wheat. J Allergy Clin Immunol 108: 634-638, 2 001
19. Perry TT, Matsui EC, Kay Conover-Walker M, Wood RA: The relationshi p of allergen-specific IgE levels and oral food challenge outcome. J Allerg
y Clin Immunol 114: 144-149, 2004
20. Pourpak Z, Mansouri M, Mesdaghi M, Kazemnejad A, Farhoudi A: Wheat allergy: clinical and laboratory findings. Int Arch Allergy Immunol 133: 1 68-173, 2004
21. Sampson HA: Utility of food-specific IgE concentrations in predicting sym ptomatic food allergy. J Allergy Clin Immunol 107: 891-896, 2001
22. Sampson HA, Ho DG: Relationship between food-specific IgE concentratio ns and the risk of positive food challenges in children and adolescents. J
Allergy Clin Immunol 100: 444-451, 1997
23. Sampson HA, Munoz-Furlong A, Campbell RL, Adkinson NF, Jr., Bock S A, Branum A, Brown SG, Camargo CA, Jr., Cydulka R, Galli SJ, Gidudu J, Gruchalla RS, Harlor AD, Jr., Hepner DL, Lewis LM, Lieberman PL, Metcalfe DD, O'Connor R, Muraro A, Rudman A, Schmitt C, Scherrer D, Simons FE, Thomas S, Wood JP, Decker WW: Second symposium on the definition and management of anaphylaxis: summary report--Second Nation al Institute of Allergy and Infectious Disease/Food Allergy and Anaphylaxi s Network symposium. J Allergy Clin Immunol 117: 391-397, 2006
cific IgE antibodies to omega-5 gliadin in the diagnosis and follow-up of J apanese children with wheat allergy. Ann Allergy Asthma Immunol 107: 33 7-343, 2011
25. Zuidmeer L, Goldhahn K, Rona RJ, Gislason D, Madsen C, Summers C, Sodergren E, Dahlstrom J, Lindner T, Sigurdardottir ST, McBride D, Keil T: The prevalence of plant food allergies: a systematic review. J Allergy C
Abstract
-Usefulness of specific IgE antibody levels to wheat, gluten and -5
gliadin for wheat allergy in Korean children
Jongseo Yoon
Department of Medical Science The Graduate School, Ajou University
(Supervised by Associate Professor Sooyoung Lee)
Purpose: The aim of this study was to assess the clinical usefulness and added diagnostic
value of specific IgE antibodies to wheat, gluten and -5 gliadin in diagnosing wheat allergy and distinguishing wheat anaphylaxis.
Methods: This study included 196 children who visited Ajou University Hospital for suspicious food allergy. The subjects were divided into two groups; wheat allergy (WA) group and non-wheat allergy (Non-WA) group. The patients with wheat allergy were further divided into two groups according to their symptoms: wheat allergy with anaphylaxis (WAAna) group and wheat allergy without anaphylaxis (WANon-Ana) group. The
serum concentrations of total IgE and specific IgE antibodies to wheat, gluten and -5 gliadin were measured.
were significantly higher in WA group compared to those in Non-WA group and the positive decision points (specificity of 95%) were 3.12 kUA/L, 2.61 kUA/L, and 0.21
kUA/L respectively. The combination of specific IgE antibodies to wheat and -5 gliadin
resulted in the highest accuracy of 93.9% in diagnosing wheat allergy. In differentiating WAAna group from WANon-Ana group, only the specific IgE antibodies to -5 gliadin
showed significant difference at the optimal cutoff point of 1.56 kUA/L.
Conclusion: Our results show that the individual levels of specific IgE antibodies to
wheat, gluten or -5 gliadin had considerably high accuracies in diagnosing wheat allergy, and specific IgE antibody to -5 gliadin was particularly useful in predicting wheat anaphylaxis.