http://osj.kr
Prediction of Surface Ocean pCO
2from Observations of Salinity,
Temperature and Nitrate: the Empirical Model Perspective
Hyun-Woo Lee
1, Kitack Lee
1*, and Bang-Yong Lee
21School of Environmental Science and Engineering, Pohang University of Science and Technology, Pohang 790-784, Korea 2Korea Polar Research Institute, KORDI, Songdo Techno Park, Incheon 406-840, Korea
Received 12 August 2008; Revised 2 December 2008; Accepted 11 December 2008
Abstract − This paper evaluates whether a thermodynamic ocean-carbon model can be used to predict the monthly mean global fields of the surface-water partial pressure of CO2
(pCO2SEA) from sea surface salinity (SSS), temperature (SST),
and/or nitrate (NO3) concentration using previously published
regional total inorganic carbon (CT) and total alkalinity (AT)
algorithms. The obtained pCO2SEA values and their amplitudes of
seasonal variability are in good agreement with multi-year observations undertaken at the sites of the Bermuda Atlantic Time-series Study (BATS) (31°50'N, 60°10'W) and the Hawaiian Ocean Time-series (HOT) (22°45'N, 158°00'W). By contrast, the empirical models predicted CT less accurately at the Kyodo western North
Pacific Ocean Time-series (KNOT) site (44°N, 155°E) than at the BATS and HOT sites, resulting in greater uncertainties in pCO2SEA predictions. Our analysis indicates that the previously
published empirical CT and AT models provide reasonable predictions
of seasonal variations in surface-water pCO2SEA within the (sub)
tropical oceans based on changes in SSS and SST; however, in high-latitude oceans where ocean biology affects CT to a significant
degree, improved CT algorithms are required to capture the full
biological effect on CT with greater accuracy and in turn improve
the accuracy of predictions of pCO2SEA.
Key words − global carbon cycle, pCO2, total inorganic carbon,
total alkalinity, remote sensing
1. Introduction
Varying rates of CO2 exchange between the atmosphere
and ocean are one of the key factors in regulating the rate of increase in atmospheric CO2 concentrations (e.g. Tans et al.
1990; Quay et al. 1992; Keeling et al. 1996; Takahashi et al.
1997, 2002; Sabine et al. 2004). Our understanding of CO2
fluxes at the air–sea interface is derived mainly from conventional shipboard measurements of the partial pressure difference in CO2 (ΔpCO2= pCO2AIR− pCO2SEA) between
surface-water pCO2 (pCO2SEA) and marine atmospheric pCO2
(pCO2AIR) (e.g. Poisson et al. 1993; Inoue et al. 1995;
Takahashi et al. 1997, 2002, 2006; Feely et al. 1999, 2006; Zeng et al. 2002; Metzl et al. 2006); however, in situ shipboard pCO2SEA measurements fall far short of the spatial
and temporal resolution required to determine monthly, seasonal, or interannual variability in pCO2 for the global
ocean.
To overcome this lack of in situ pCO2SEA data, many previous
studies have deduced pCO2SEA from changes in sea surface
temperature (SST) via algorithms that relate regionally and seasonally variable values of pCO2SEA to SST (e.g. Tans et al.
1990; Stephens et al. 1995; Landrum et al. 1996; Bates et al. 1998; Lee et al. 1998; Lefèvre and Taylor 2002; Cosca et al. 2003; Olsen et al. 2003; Park et al. 2006). This approach is founded on the assumption that variations in SST capture much of the variability of surface-water pCO2SEA associated
with the influence of thermodynamic, transport, and biological effects.
Surface-water pCO2SEA values are also predicted from
total dissolved inorganic carbon (CT) and total alkalinity
(AT) using a thermodynamic ocean-carbon model (e.g.
Loukos et al. 2000; Gruber et al. 2002; Dore et al. 2003; Bates, 2006; Sarma et al. 2006; McNeil et al. 2007).
Such studies have documented strong region-specific relationships between marine inorganic CO2 parameters (e.g.
CT and AT) and hydrographic (e.g. salinity and temperature)
and/or biological (e.g. nutrients or chlorophyll a) parameters.
*Corresponding author. E-mail: [email protected]
Of the predictor variables that are directly or indirectly related to variations in CT and AT, variations in sea surface salinity (SSS) are known to be the key factor that affects variations in both CT and AT concentrations. In addition to the effects of variations in SSS, seasonal changes in the intensity of higher-latitude convective mixing of deep CT -and AT-rich water commonly make a significant contribution to variations in CT and AT concentrations. Accordingly, many previous studies have used variations in SST as a proxy for changes in surface-water AT and CT related to convective mixing.
An important factor that affects only surface-water CT to a significant degree is biological activity. As part of the variation in CT in high-latitude regions is attributed to biological activity, the values of CT in many previous studies were generally parameterized using both physical (SSS and SST) and biological parameters (nutrients or chlorophyll a) (e.g. Baker et al. 1999; Lee et al. 2000a; Ishii et al. 2004; Bates 2006; Sarma et al. 2006; McNeil et al. 2007). The derived region-specific CT and AT relationships, along with SSS, SST, and/or chlorophyll a (or nitrate) concentrations, yield basin-scale CT and AT fields that in turn yield pCO2SEA fields when combined with a reliable thermodynamic model (e.g. Loukos et al.2000; Ishii et al. 2004; Sarma et al. 2006).
In the present paper, we evaluate the abilities of the empirical CT (Lee et al. 2000a) and AT (Lee et al. 2006) models in predicting surface-water pCO2SEA by comparing our modeled CT, AT, and pCO2SEA values with multi-year observations from three time-series locations, with measurement-based pCO2SEA
climatology (Takahashi et al. 2002), and with pCO2SEA
values predicted from changes in SST via regionally and seasonally varying pCO2SEA/SST algorithms (Lee et al. 1998; Park et al. 2006). Predicted pCO2 values using our regional
CT and AT algorithms are also compared against those
derived from other empirical algorithms for the equatorial Pacific (Loukos et al. 2000; Ishii et al. 2004), Indian (Bates et al. 2006), and Southern Oceans (McNeil et al. 2007).
Finally, we estimate the degree to which pCO2SEA values
calculated from CT and AT via a thermodynamic
ocean-carbon model are sensitive to seasonal variations in CT and AT predicted for different parts of the global ocean.
2. Calculation Methods
Monthly mean global CT and AT fields on 4° latitude × 5°
longitude grid cells for the reference year 1995 were estimated from 24 equations relating NCT to SST and NO3− (Lee et al. 2000a) and 5 equations relating AT to SSS and SST, along with monthly mean SSS (Antonov et al. 2006) and NO3–(Garcia et al. 2006) fields from the World Ocean Atlas 2005 (hereafter referred to as WOA05) and monthly mean SST fields for 1995 sourced from the National Centers for Environmental Prediction/Atmospheric Model Intercomparison Project II (NCEP/DOE AMIP-II Reanalysis, hereafter referred to as NCEP, available at http://www.cpc.ncep.noaa. gov/products/wesley/reanalysis.html). Simple two-parameter
functions with SST and NO3– for NCT and with SSS and
SST fit surface NCT and AT data within an area-weighted uncertainty of approximately 8 μmol kg-1 (Lee et al. 2000a; 2006).
The resulting NCT fields were then converted to CT using monthly mean SSS fields from the World Ocean Atlas 2005. The annual cycles of global surface-water CT and AT for 1995 used in this paper were previously published in Lee et al. (2000a) and Lee et al. (2006), respectively. The
companion fields of pCO2SEA fields for 1995 were then
constructed from the resulting CT and AT fields using the carbonic acid dissociation constants of Mehrbach et al. (1973) that were refitted in different functional forms by Dickson and Millero (1987).
3. Results and Discussion
Global distributions of modeled pCO2SEA and seasonal
pCO2SEA variability
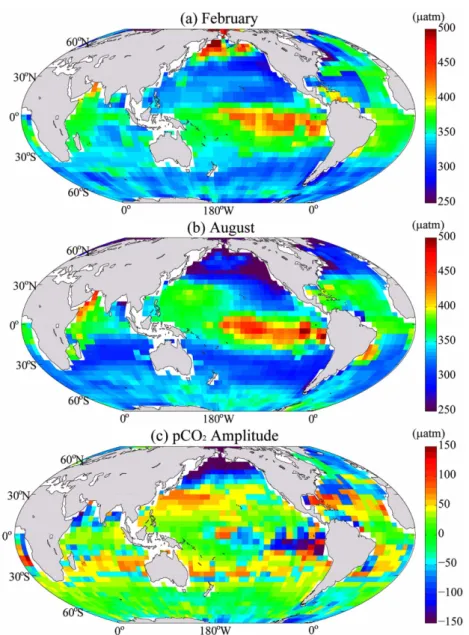
Surface-water pCO2SEA values predicted for February and August in the global ocean are shown in Figures 1(a) and 1(b) as examples of the monthly mean distributions. In the eastern equatorial Pacific, high pCO2SEA values (yellow to red areas) reflect the upwelling of subsurface water with high pCO2SEA values and its subsequent advection from the
site of upwelling. Low pCO2SEA values (blue areas) are
generally found in the Southern Ocean (> 60°S) during the austral summer and in the North Atlantic and North Pacific (>40°N) during the boreal summer; in contrast, relatively high pCO2SEA values are found in these regions during winter. In these high-latitude regions, CT at the surface increases during seasonal cooling due to the convective mixing of subsurface waters rich in CT. In this case, the convective mixing and thermodynamic effects are out of phase, and reductions in pCO2SEA associated with cooling are usually
overtaken by increases due to vertical mixing. In contrast, a combination of phytoplankton blooms and reduction in convective mixing during the warming period leads to a rapid decrease in pCO2SEA at high latitudes. The pCO2SEA values found in temperate and tropical oceans are nearly in equilibrium or slightly undersaturated with respect to
atmospheric pCO2SEA (green areas). In these warm waters,
limited photosynthesis and longer periods of exposure of surface water to the atmosphere due to strong stratification collectively act to bring surface pCO2SEA close to atmospheric
values.
The magnitude of predicted seasonal pCO2SEA variability largely falls within the range from −200 to +150 μmol kg–1 (Figure 1c). Positive amplitudes (yellow to red areas),
which indicate that maximum pCO2SEA values occur during
summer, are generally found in the temperate and tropical oceans where temperature changes account for more than 50% of the seasonal pCO2 changes (Takahashi et al. 2002). In these oceans, seasonal warming leads to an increase in
pCO2SEA, meaning that summer pCO2SEA values are higher
Fig. 1. Climatological surface-water pCO2SEA fields for (a) February and (b) August estimated from the NCT/SST/NO3– (Lee et al. 2000a)
and AT/SSS/SST algorithms (Lee et al. 2006), as well as monthly mean SST fields for 1995 sourced from the National Centers
for Environmental Prediction/Atmospheric Model Intercomparison Project II and SSS (Antonov et al. 2006) and NO3– fields
(Garcia et al. 2006) from the World Ocean Atlas 2005. (c) Distribution of the seasonal amplitude (maximum pCO2SEA– minimum
pCO2SEA) of surface-water pCO2SEA. Positive amplitudes (yellow to red areas) indicate that maximum pCO2SEA values occur during
than those in winter. Negative amplitudes (blue areas),
which indicate that maximum pCO2SEA values occur during
winter, are usually found in high-latitude areas and regions of equatorial upwelling. Negative seasonal amplitudes arise from the biological reduction of pCO2SEA in summer and the
increase of pCO2SEA in winter associated with convective
mixing of subsurface water that is rich in pCO2SEA (Takahashi et al. 2002).
Comparison with multi-year time-series observations
The accuracy of the predicted pCO2SEA fields and their
seasonal variability presented in the preceding section depend on the accuracy of published CT (Lee et al. 2000a) and AT (Lee et al. 2006) algorithms in terms of describing seasonal trends. Therefore, in the present paper we assess the abilities of the published CT (Lee et al. 2000a) and AT (Lee et al. 2006) algorithms in predicting surface-water pCO2SEA by comparing our modeled CT, AT, and pCO2SEA values against time-series measurements obtained from the sites of
the Bermuda Atlantic Time-series Study (BATS) (31°50'N,
60°10'W), the Hawaiian Ocean Time-series (HOT) (22°45'N,
158°00'W), and the Kyodo western North Pacific Ocean
Time-series (KNOT) (44°N, 155°E).
The BATS and HOT sites, which represent subtropical conditions, have near-monthly records of SSS, SST, CT, and AT for the period 1988-2003 (Bates, 2001, 2002; Gruber et al. 2002; Dore et al. 2003; Keeling et al. 2004), whereas the KNOT site, which represents subarctic conditions, has only seasonal records of SSS, SST, CT, and AT for the shorter period of 1998-2000 (Tsurushima et al. 2002). Over the observational periods for the three time-series locations, we
first compared measured CT and AT values with those
predicting the published CT and AT algorithms that are
applicable to these time-series locations in conjunction with SSS and SST data collected from the three time-series locations and then compared pCO2SEA values predicted from
measurements of CT and AT with predictions of the same
parameters made using the CT and AT algorithms and the
optimal thermodynamic model. In addition, we evaluated the reliability of climatological SSS (WOA05) and SST
(NCEP) data in predicting CT, AT, and pCO2SEA when
combined with the published CT (Lee et al. 2000a) and AT (Lee et al. 2006) algorithms.
Prior to the comparisons with time-series observations, we applied one adjustment factor to the predicted CT values to account for CT increases due to the influx of CO2 from the
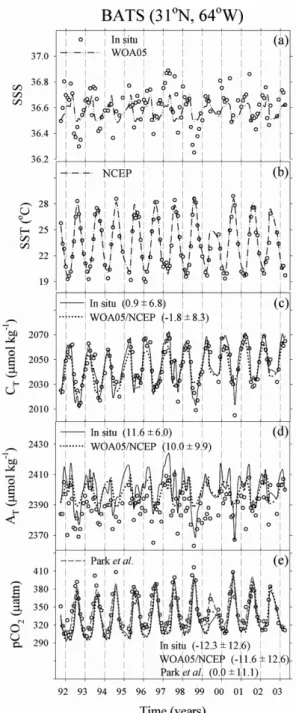
Fig. 2. Comparisons of (a) WOA05 sea surface salinity (SSS) and (b) NCEP sea surface temperature (SST), and modeled CT, AT and pCO2SEA values with observations undertaken at
the Bermuda Atlantic Time-series (BATS) site (31°50'N, 64°10'W). CT and AT values were predicted using in situ
SSS and SST values (solid lines, This study) and using WOA05 SSS and NCEP SST values (dotted lines, This study). WOA05 SSS and NCEP SST values are averages of four values from the four grid boxes (4° latitude × 5° longitude) surrounding the BATS site. Means and standard deviations (1σ) of the differences between measured values and those calculated are shown. Calculated pCO2SEA
values using pCO2-SST algorithms of Park et al. (2006)
along with in situ SST data and their deviations from observations are presented in (e).
atmosphere. This adjustment was applied to the CT values predicted for the BATS and HOT where surface CT increases with a rate similar to the atmospheric CO2 increase; however, it
was not applied to the CT values predicted for the KNOT
site where outcropping of deep isopycnal surfaces dilutes the small signals of anthropogenic CO2 component throughout the entire water column.
At the BATS and HOT sites, the empirical CT models
predict seasonal and interannual trends within ±7 to ±9 μmol kg-1
for CT without any significant biases and within ±5 to ±7 μmol kg-1 for AT with the overestimations of 4 to 12 μmol kg-1 (close to fit uncertainties) (Figure 2 and 3). Overall, the magnitudes of the differences between measur-ements and predictions are comparable to the uncertainties of the derived CT (Lee et al. 2000a) and AT relationships (Lee et al. 2006). This indicates that in situ SSS and SST are reliable proxies for variations in surface-water CT and AT in (sub)tropical oceans, with the exception of the equatorial upwelling Pacific. A further implication of this good agreement is that the effects of phytoplankton activity on
CT in these warm waters are relatively weak due to low
concentrations of nutrients throughout the year; however, there is an exception to this generalization. At the BATS site, deep wintertime mixing of nutrients supports a springtime phytoplankton bloom, implying that phytoplankton activity becomes an important factor in determining springtime surface CT and AT in the tropical and subtropical
North Atlantic (Bates, 2001); its effect on CT is more
pronounced than that on AT. As one can predict from the
good agreement between the measured and predicted CT
and AT trends, the pCO2SEA values predicted from the CT and
AT algorithms using the thermodynamic ocean-carbon model
are in good agreement with measured values; the mean
pCO2SEA differences are −12.3 ± 12.6 μatm at BATS and
−0.6 ± 14.9 μatm at HOT. The overestimation at the BATS site is due to AT overestimation.
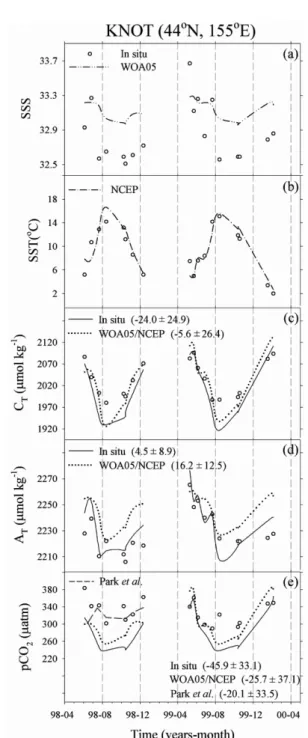
In the western subarctic North Pacific (KNOT), the AT
model accurately predicts seasonal and interannual trends
whereas the CT model predicts less accurately; the mean
differences between measurements and predictions are −24.0 ± 24.9 μmol kg–1
for CT and −4.5 ± 8.9 μmol kg–1 for AT. The resulting pCO2SEA predicted from these CT and AT algorithms using the thermodynamic model reasonably predicts seasonal variations, but differs from measurements
by −45.9 ± 33.1 μatm, with larger discrepancies recorded
for the springtime and wintertime comparisons for 1999
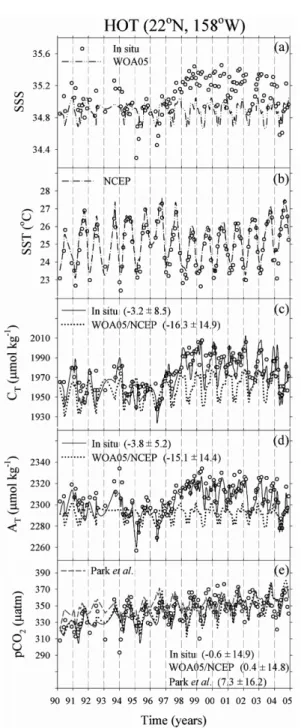
Fig. 3. Comparisons of (a) WOA05 sea surface salinity (SSS) and (b) NCEP sea surface temperature (SST), and modeled CT, AT and pCO2SEA values with observations undertaken at
the Hawaiian Ocean Time-series (HOT) site (22°45'N, 158°00'W). CT and AT values were predicted using in situ
SSS and SST values (solid lines, This study) and using WOA05 SSS and NCEP SST values (dotted lines, This study). WOA05 SSS and NCEP SST values were averages of values from 4 grid boxes (4° latitude × 5° longitude) surrounding the HOT site. Means and standard deviations (1σ) of the differences between measured values and those calculated are shown. Calculated pCO2SEA values using
pCO2-SST algorithms of Park et al. (2006) along with in
situ SST data and their deviations from observations are presented in (e).
(Figure 4).
In addition, when the empirical CT and AT algorithms
were combined with climatological SSS, SST, and NO3−,
we found good agreement between the predicted and measured values at BATS, but we found poor agreement at HOT. At all thee locations, the NCEP SST data accurately represent interannual variations in SST. Therefore, the poor agreement at the HOT site is largely due to the inaccurate representation of interannual and seasonal variations in SSS. Although climatological SSS data were found to underestimate CT and AT values at the HOT site, the calculated pCO2SEA values are in good agreement with measured values
to within ±15 μatm, with no systematic biases. Such good
agreement at BAT is fortuitous. The overestimation of CT would lead to pCO2SEA overestimation whereas AT overestimation leads to pCO2SEA underestimation. As a result, they compensate each other. At the KNOT site, we only tested the accuracy of climatological data by comparing AT predictions against measurements, because the CT algorithms applicable to this site resulted in a mean bias of −24.0 μmol kg–1. Our analysis indicates that climatological data less accurately predict AT values than do in situ measurements; however, they capture seasonal AT trends.
Overall, the empirical models predict CT less accurately at the KNOT site than at the BATS and HOT sites, suggesting that our CT prediction models, which are applicable to the western subarctic North Pacific, may not account for the full extent of biological effects on CT variations, thereby limiting the accuracy of pCO2SEA predictions. Sarma et al. (2006) also showed that the “chlorophyll a” rather than
“NO3−” is probably more adequate to account for the
biological effect on CT, giving rise to smaller random errors.
Comparison with the modeled pCO2SEA data using the
method Park et al. (2006)
For the periods over which direct measurements are available from the BATS, HOT, and KNOT sites, we compared
our modeled pCO2SEA with those predicted independently
from SST variations via seasonal pCO2SEA/SST relationships derived for 4° latitude × 5° longitude pixels, including the time-series locations (Park et al. 2006) (Figures 2c-4c). In contrast, for the equatorial upwelling Pacific (10°N-10°S,
75°W-160°W), net annual CO2 efflux estimates obtained
using direct observations are subject to large uncertainties because they were derived from biannual observations from 1992 to 1998; therefore, we only compared those efflux
Fig. 4. Comparisons of (a) WOA05 sea surface salinity (SSS) and (b) NCEP sea surface temperature (SST), and modeled CT, AT and pCO2SEA values with observations undertaken at
the at the Kyodo western North Pacific Ocean Time-series (KNOT) site (44°N, 155°E). CT and AT values were
predicted using in situ SSS and SST values (solid lines, This study) and using WOA05 SSS and NCEP SST values (dotted lines, This study). WOA05 SSS and NCEP SST values were averages of values from 4 grid boxes (4° latitude × 5° longitude) surrounding the KNOT site. Means and standard deviations (1σ) of the differences between measured values and those calculated are shown. Calculated pCO2SEA values using pCO2-SST algorithms of
Park et al. (2006) along with in situ SST data and their deviations from observations are presented in (e).
estimates modeled using the present approach with the pCO2SEA/SST relationships (Cosca et al. 2003; Park et al. 2006) derived from the biannual observations (Figure 5). Overall, the comparison of two independently modeled values with time-series measurements at the BATS, HOT, equatorial upwelling Pacific, and KNOT sites indicates that regardless of location, the empirical CT/AT-based approach appears to predict surface-water pCO2SEA variations as accurately as the pCO2SEA/SST-based approach (Figures 2c-4c, 5). More precisely, the pCO2SEA/SST-based approach yields predictions of surface-water pCO2SEA variations at the HOT site that are less accurate than those of the empirical CT/AT-based approach; the opposite is true at the KNOT site. Overall, both methods predicted surface pCO2SEA values less accurately in high-latitude regions (e.g. the KNOT site) than in subtropical oceans (e.g. the BATS and HOT sites). These limited
comparisons of observations with predicted pCO2 values
obtained using the two empirical methods make it difficult to determine the superior empirical method.
Comparison with pCO2SEA predictions using other published algorithms
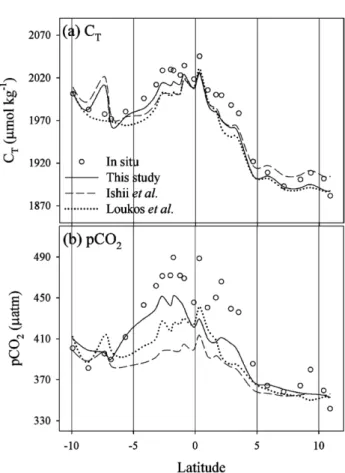
To further validate the accuracy of pCO2SEA predictions using CT (Lee et al. 2000a) and AT (Lee et al. 2006) algorithms, we compared our predictions of pCO2SEA with those modeled using other published algorithms for the Equatorial Pacific (Loukos et al. 2000; Ishii et al. 2004), the Indian Ocean (Bates et al. 2006), and the Southern Ocean (McNeill et al. 2007).
For the eastern equatorial Pacific along the line 110°W, all three CT algorithms reasonably captured CT variations measured in 1995 (Figure 5); however, they underestimated CT values to some extent near the equator (5°N-5°S). As a result, predictions of seawater pCO2SEA for this line using three algorithms were correspondingly underestimated. Although our algorithms predicted pCO2SEA more accurately, the differences in pCO2SEA predictions are not statistically significant.
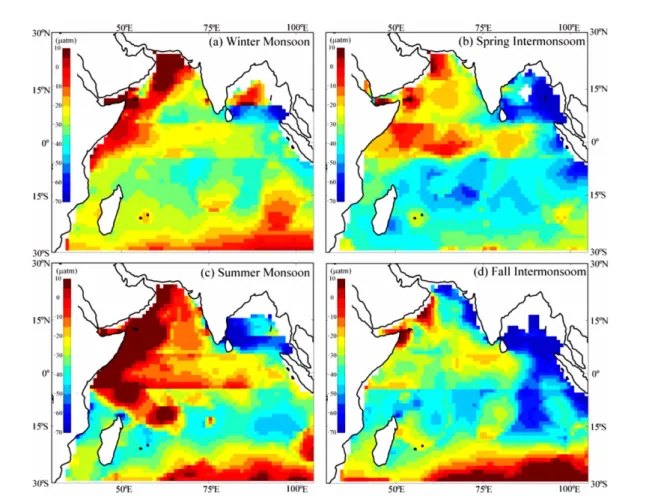
For the Indian Ocean, our modeled pCO2SEA fields were on
a basin-wide average −23 to −40 μatm consistently less
than those predicted using CT and AT algorithms of Bates et al. (2006) when the same SST (NCEP), and SSS and nitrate fields were used (Figure 6). The underestimation is largely due to inaccurate representation of the CT fields produced by Lee et al. (2000a). According to the analysis of Bates et
al. (2006), four separate CT algorithms for two monsoon
and two inter-monsoon periods yielded the smallest
interpolation errors in predicting the CT fields for the
respective monsoon and inter-monsoon seasons; the use of a single algorithm in our study yielded prediction errors considerably greater than the use of the four seasonal algorithms. The fact that the use of four algorithms resulted in the smallest errors indicates that the relative importance of the controlling factors for seawater CT (and pCO2SEA) differs by seasons.
For waters south of 40°S in the Southern Ocean, regardless of
seasons, our algorithms predicted pCO2SEA fields on an
average of 20 ± 10 μatm higher than those predicted from
the CT and AT algorithms derived by McNeill et al. (2007) (Figure 7). Such systematic difference is likely to be due to
inaccuracy in our CT algorithm for the Southern Ocean.
This inaccuracy is largely caused by two factors. One is the
number of CT data used to derive Lee et al.’s algorithm,
Fig. 5. Comparisons of (a) CT and (b) pCO2SEA observations with
those modeled using published CT (Lee et al. 2000a) and
AT algorithms (Lee et al. 2006), using CT and AT
algorithm of Ishii et al. (2004), and using CT algorithms of
Loukos et al. (2000) and AT algorithms of Lee et al.
(2006) for the equatorial Pacific (10°N-10°S) along 110°W.
which are about two-thirds of data points used in deriving McNeill et al.’s algorithm. Another is the difference in the choice of predictable parameters, which account for changes in CT due to biological activity. McNeill et al.’s analysis indicated that the parameter “nitrate only” cannot fully capture CT changes due to biology in the Southern Ocean. In
their analysis, therefore, they used the parameters “oxygen” and “silicate”.
Comparison with measurement-based pCO2SEA fields
(Takahashi et al. 2002)
The modeled surface-water pCO2SEA maps for 1995 are
Fig. 6. Comparison of our modeled pCO2 fields for (a) winter (December to February), (b) spring (March to May), (c) summer (June to
August), and (d) fall (September to November) with those obtained using CT and AT algorithms of Bates et al. (2006). Positive
values indicate our modeled values higher than Bates et al.’s estimations whereas negative values indicate the opposite case.
Fig. 7. Comparison of our modeled pCO2 fields for (a) summer (June to August) and (b) winter (December to February) with those
obtained suing CT and AT algorithms of McNeil et al. (2007). Positive values indicate our modeled values higher than McNeil et
compared with corresponding maps compiled from
940,000 shipboard measurements of pCO2SEA taken over the
past 40 years (Takahashi et al. 2002). In compiling the
pCO2SEA maps for 1995 using the CT algorithms derived
from data normalized to the year 1990, our empirical CT
models did not account for increases in CT due to oceanic
uptake of anthropogenic CO2 over a 5-year period between
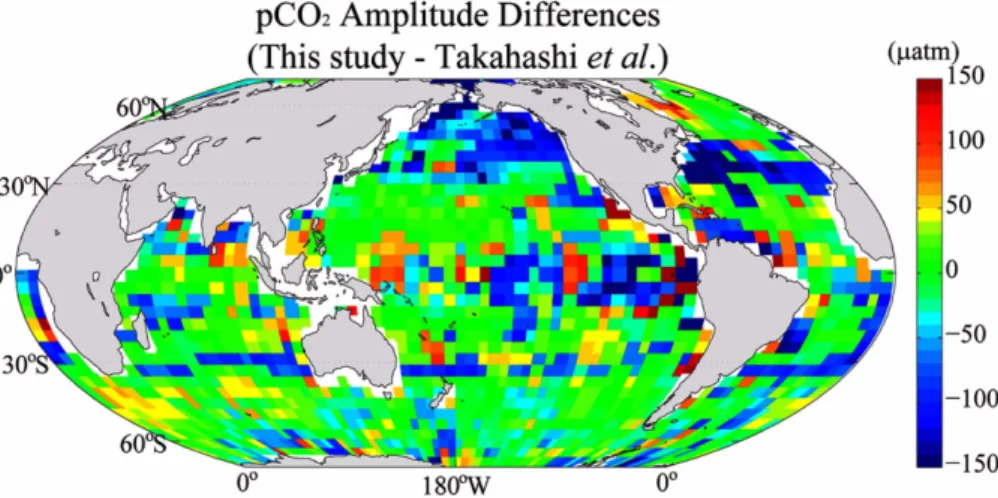
1990 and 1995. Therefore, we compared the magnitudes of modeled seasonal pCO2SEA variability with those of measurement-derived values (Takahashi et al. 2002) (Figure 8). Positive values indicate that our modeled seasonal pCO2SEA variations are greater than observed variations. Seasonal amplitudes
of pCO2SEA calculated in this way are in broad agreement
with those calculated from the monthly mean pCO2SEA maps
of Takahashi et al. (2002), with a mean difference in the
seasonal amplitude of approximately ±40 μatm (yellow to
light blue areas in Figure 6). Our estimates capture many of the key features that are present in Takahashi et al.’s map of seasonal pCO2SEA variability, although the degree of concordance between the two global maps varies regionally. The largest differences are found in the North Pacific (>45°N), where two contrasting trends are observed in the differences in the seasonal pCO2SEA amplitudes. In the northern North Pacific (>45°N), the modeled seasonal amplitudes of pCO2SEA were
underestimated by 100 to 150 μatm compared to observed
values. In contrast, in the temperate central North Pacific (30°N-45°N) the predicted seasonal amplitudes are close to or slightly lower than the observed amplitudes. The observed seasonal trends for the northern North Pacific are probably robust, as the measurements have a dense coverage for all
seasons (Takahashi et al. 2002). Hence, our modeled seasonal amplitudes are most likely to be underestimates in the northern North Pacific (>45°N).
Estimation of errors in predicted pCO2SEA
The systematic errors in estimated pCO2SEA values are
largely due to possible biases in climatological data of SSS,
SST and NO3−(obtained from WOA05 and NCEP) and in
the selected thermodynamic model. Of these factors, uncertainties in SSS make the largest contribution to the overall systematic errors in CT, AT, and pCO2SEA predictions. In particular, the analysis of data at the three time-series locations indicate that the lack of interannual variations in SSS led to errors in predicted CT, AT, and pCO2SEA values that
are comparable or greater than fit errors in CT and AT
equations. Another less significant contributor is uncertainty in the carbonic acid dissociation constants. This set of thermodynamic constants has proved to be the most consistent with laboratory (Lee et al. 1996; Lueker et al. 2000; Mojica Prieto and Millero, 2002; Millero et al. 2006) and field (Lee et al. 1997; Wanninkhof et al. 1999; Lee et al. 2000b; Millero et al. 2002) measurements of carbon parameters over oceanic ranges of temperature and salinity. Therefore, the uncertainty in the thermodynamic model leads to biases in calculated carbon parameters that are smaller than mean fit errors in CT and AT equations.
The random errors associated with the estimated values of pCO2SEA mostly come from uncertainties in the published CT and AT algorithms. The uncertainties (approximately ±8 μmol kg–1
) in the published CT and AT algorithms taken from
Fig. 8. Comparison of model predictions with measurement-derived pCO2SEA fields (Takahashi et al. 2002) for seasonal amplitudes of
pCO2SEA variability. Positive values indicate modeled amplitudes are overestimated, whereas negative values indicate
Lee et al. (2000a) and Lee et al. (2006) result in an overall
uncertainty in pCO2SEA of approximately ±5%.
Effects of predicted seasonal variations in AT and CT on
calculations of pCO2SEA
Predictions of seasonal changes in surface-water pCO2SEA
values made from CT and AT via a thermodynamic model
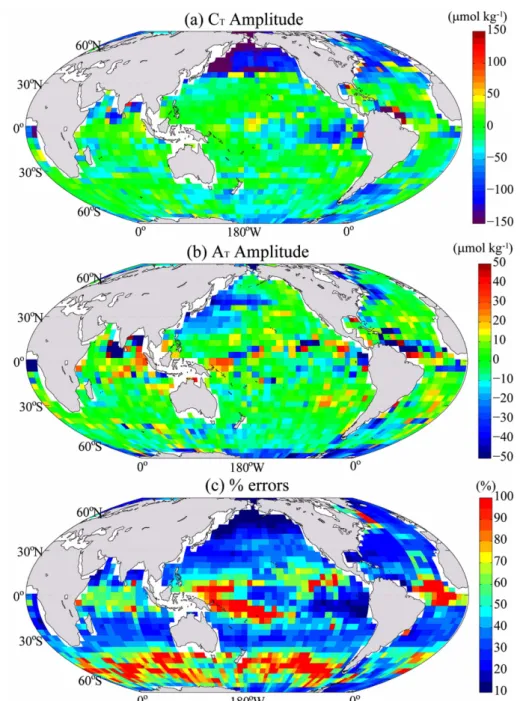
are sensitive to seasonal changes in CT (ΔCT) and AT (ΔAT). In the (sub)tropical ocean, except for the equatorial upwelling Pacific, both CT and AT change to a similar degree and in the same direction (yellow area in Figures 9a and 9b). In this case, a seasonal increase in AT acts to lower surface-water pCO2SEA, whereas an increase in CT acts to increase pCO2SEA. The net effect is a suppression of the variability in predicted
Fig. 9. (a) Distribution of the seasonal amplitudes (maximum –minimum) of surface-water CT, AT, and pCO2SEA. Positive amplitudes
(yellow to red areas) indicate that maximum pCO2SEA values occur during summer; whereas negative amplitudes (light blue to
blue areas) indicate that maximum pCO2SEA values occur during winter.(c) Percentage errors (%) of ±5% in calculated pCO2SEA
values of pCO2SEA (yellow area in Figure 1c), as the effects of these two competing factors approximately cancel each other out. As a result, an estimated error of ±5% in predicted pCO2SEA associated with errors in the CT and AT algorithms generally contributes to 50-100% of the seasonal amplitudes of pCO2SEA found in these regions (yellow to red areas in
Figure 9c). In particular, the error in pCO2SEA can be
substantial in the western equatorial Pacific and the central
equatorial Atlantic where measured magnitudes of pCO2SEA
seasonality slightly exceed the estimated pCO2SEA error. In
these regions, direct pCO2SEA measurements are strongly
recommended.
Contrary to the prevailing trend in ΔCT and ΔAT for the (sub)tropics, in the equatorial upwelling area the magnitudes of ΔCT are much greater than those of ΔAT, and CT and AT
occasionally vary in opposite directions. The net effect of variations in CT and AT on predictions of pCO2SEA is an increase in the variability of predicted pCO2SEA (blue or orange to red areas in Figure 1c), as the effect of ΔCT on pCO2SEA is pronounced and the counteracting effect of ΔAT on pCO2SEA is relatively small; consequently, the estimated pCO2SEA error of ±5% accounts for less than 20% of the total variability of pCO2SEA found in this region (blue area in Figure 9c).
In most high-latitude regions, the magnitudes of seasonal ΔCT (blue to purple areas in Figure 9a) are significantly
greater than those of seasonal ΔAT; hence, the effect of ΔCT on pCO2SEA is dominant. There are two major trends in ΔCT within high-latitude oceans. The first trend is more general and thus found across large areas of high-latitude oceans (blue to purple area in Figure 9a), particularly in the North Pacific and North Atlantic. In these areas, the magnitudes of seasonal ΔAT are generally one-fifth of those of ΔCT. Hence, the effect of ΔCT on ΔpCO2SEA is significantly greater than that of ΔAT on pCO2SEA. As with the case in the equatorial upwelling area, changes in CT make a dominant contribution to seasonal changes in pCO2SEA in these high-latitude regions. In this case, the estimated pCO2SEA error of ±5% is considerably
smaller in magnitude than the total seasonal pCO2SEA
variability (blue area in Figure 9c).
The second trend is found in the Southern Ocean. For waters at 30°S-60°S, the magnitudes of ΔCT are only one-fifth of those found in the North Pacific and North Atlantic; in contrast, ΔAT in these contrasting regions are similar in magnitude. The resulting smaller magnitudes of seasonal
variability in CT act to depress the degree of seasonal
variability in pCO2SEA in the Southern Ocean; this effect is enhanced by locally opposite trends in ΔCT and ΔAT. As a result, the magnitudes of seasonal variability in pCO2SEA in the Southern Ocean are minor compared to those observed in the northwestern North Atlantic and North Pacific (see Figure 1c). In this case, the magnitudes of the errors in
predicted pCO2SEA are comparable to those of seasonal
variability in pCO2SEA; thus, substantial errors are found in the Southern Ocean (yellow to red areas in Figure 9c).
Although the smaller magnitudes of seasonal pCO2SEA
variability for the Southern Ocean inferred from our empirical model are broadly consistent with those found in Takahashi et al.’s map, a firm conclusion can only be drawn
once additional pCO2SEA measurements become available in
the future.
4. Conclusion
The principal benefit of using the empirical model described in the present study is the interpolation or extrapolation of surface-water CT and AT, which in turn leads to predictions
of surface-water pCO2SEA. The broad concordance between
modeled values and those observed at the time-series locations suggests that the published CT and AT algorithms, when combined with SSS, SST, and nitrate concentration data, are able to predict the corresponding global fields and
thereby pCO2SEA fields using the thermodynamic model.
Within the (sub)tropical oceans (i.e. 30°N-30°S), seasonal variations in CT and AT collectively act to suppress variations in surface-water pCO2SEA. In contrast, the effect of seasonal variations in CT on pCO2SEA within the equatorial upwelling
Pacific and high-latitude oceans (i.e. north of ~30°N and
south of ~30°S) is generally strong, as the counteracting
effect of seasonal variations in AT on pCO2SEA is relatively small.
The results presented in this paper provide guidelines for the prediction of surface-water pCO2SEA using the CT and AT empirical models. Because the real-time observations of SSS, SST, and biological parameters using various tools including Argo float or satellite are increasing (e.g. Kilpatrick et al. 2001; Koblinsky et al. 2003; Gabarró et al. 2004; Gould et al. 2004), those observations will provide a potentially powerful tool in constraining monthly to interannual variability in the oceanic uptake of CO2 when they are jointly used with empirical algorithms that relate CT to SSS, SST, and nitrate (or other biological parameters)
concentration and that relate AT to SSS and SST.
Acknowledgements
We also thank Dr. Rik Wanninkhof of the Atlantic Oceanographic and Meteorological Laboratory for providing valuable comments on an earlier version of this paper. This work was financially supported by the National Research Laboratory Program of the Korea Science and Engineering Foundation. Partial support was also provided by AEBRC at POSTECH, the Korea Aerospace Research Institute, and the Korea Polar Research Institute (PE08030).
References
Antonov, J.I., R.A. Locarnini, T.P. Boyer, A.V. Mishonov, and H.E. Garcia. 2006. World Ocean Atlas 2005, Volume 2: Salinity. S. Levitus, Ed. NOAA Atlas NESDIS 62, U.S. Government Printing Office, Washington, D.C. 182 p.
Bakker, D.C.E., H.J.W. De Baar, and E. De Jong. 1999. The dependence on temperature and salinity of dissolved inorganic carbon in East Atlantic surface waters. Mar. Chem., 65, 263-280.
Bates, N.R. 2001. Interannual changes of oceanic CO2 and
biogeochemical properties in the Western North Atlantic subtropical gyre. Deep-Sea Res. II, 48, 1507-1528.
Bates, N.R. 2002. Interannual variability in the global uptake of CO2.
Geophys. Res. Lett., 29(5), 1059, doi: 10.1029/2001GL013571. Bates, N.R., A.C. Prequignet, and C.L. Sabine. 2006. Ocean carbon
cycling in the Indian Ocean: 1. Spatiotemporal variability of inorganic carbon and air-sea CO2 gas exchange, Global
Biogeochem. Cycles, 20, GB3020, doi:10.1029/2005GB002491. Bates, N.R., T. Takahashi, D.W. Chipman, and A.H. Knap. 1998.
Variability of pCO2 on diel to seasonal timescales in the
Sargasso Sea near Bermuda. J. Geophys. Res., 103, 15567-15585.
Cosca, C.E., R.A. Feely, J. Boutin, J. Etcheto, M.J. McPhaden, F.P. Chavez, and P.G. Strutton. 2003. Seasonal and interannual CO2 fluxes for the central and eastern equatorial Pacific
Ocean as determined from fCO2-SST relationships. J. Geophys.
Res., 108(C8), 3278, doi:10.1029/2000JC000677.
Dickson, A.G. and F.J. Millero. 1987. A comparison of the equilibrium constants for the dissociation of carbonic acid in seawater media. Deep-Sea Res. I, 34, 1733-1743.
Dore, J.E., R. Lukas, D.W. Sadler, and D.M. Karl. 2003. Climate-driven changes to the atmospheric CO2 sink in the
subtropical North Pacific Ocean. Nature, 424, 754-757. Feely, R.A., R. Wanninkhof, T. Takahashi, and P.P. Tans. 1999.
Influence of El Niño on the equatorial Pacific contribution to atmospheric CO2 accumulation. Nature, 398, 597-601.
Feely, R.A., T. Takahashi, R. Wanninkhof, M.J. McPhaden, C.E. Cosca, S.C. Sutherland, and M.-E. Carr. 2006 Decadal variability of the air-sea CO2 fluxes in the equatorial Pacific Ocean. J.
Geophys. Res., 111, C08S90, doi:10.1029/2005JC003129. Gabarró, C., J. Font, A. Camps, M. Vall-llossera, and A. Julia.
2004. A new empirical model of sea surface microwave emissivity for salinity remote sensing. Geophys. Res. Lett., 31, L01309, doi:10.1029/2003GL018964.
Garcia, H.E., R.A. Locarnini, T.P. Boyer, and J.I. Antonov. 2006. World Ocean Atlas 2005, Volume 4: Nutrients (phosphate, nitrate, silicate). S. Levitus, Ed. NOAA Atlas NESDIS 64, U.S. Government Printing Office, Washington, D.C. 396 p. Gould, J. and the Argo Science Team. 2004. Argo profiling floats
bring new era of in situ ocean observations. EOS, 85, 179, 190-191.
Gruber, N., C.D. Keeling, and N.R. Bates. 2002. Interannual variability in the North Atlantic Ocean carbon sink. Science, 298, 2374-2378.
Inoue, H.Y., H. Matsueda, M. Ishii, K. Fushimi, M. Hirota, I. Asanuma, and Y. Takasugi. 1995. Long-term trend of the partial pressure of carbon dioxide (pCO2) in surface waters
of the western North Pacific, 1984-1993. Tellus, Ser. B, 47, 391-413.
Ishii, M., S. Saito, T. Tokieda, T. Kawano, K. Matsumoto, and H.Y. Inoue. 2004. Variability of Surface Layer CO2 Parameters in
the Western and Central Equatorial Pacific. p. 59-94. In: Global Environmental Change in the Ocean and on Land. ed. by M. Shiyomi, H. Kawahata, H. Koizumi, A. Tsuda, and Y. Awaya, TERRAPUB, Tokyo.
Keeling, C.D., H. Brix, and N. Gruber. 2004. Seasonal and long-term dynamics of the upper ocean carbon cycle at Station ALOHA near Hawaii, Global Biogeochem. Cycles, 18, GB4006, doi:10.1029/2004GB002227.
Keeling, R.F., S.C. Piper, and M. Heimann. 1996. Global and hemispheric CO2 sinks deduced from changes in atmospheric
O2 concentration. Nature, 281, 218-221.
Kilpatrick, K.A., G.P. Podestá, and R. Evans. 2001. Overview of the NOAA/NASA advanced very high resolution radiometer Pathfinder algorithm for sea surface temperature and associated matchup database. J. Geophys. Res., 106, 9179-9198. Koblinksky, C.J., P. Hildebrand, D. LeVine, F. Pellerano, Y. Chao,
W. Willson, S. Yueh, and G. Lagerloef. 2003. Sea surface salinity from space: Science goals and measurement approach. Radio Sci., 38(4), 8064, doi: 10.1029/2001RS002584. Landrum, L.L., R.H. Gammon, R.A. Feely, P.P. Murphy, K.C.
Kelly, C.E. Cosca, and R.F. Weiss. 1996. North Pacific Ocean CO2 disequilibrium for spring through summer,
1985-1989. J. Geophys. Res., 101, 28539-28555.
Lee, K., F.J. Millero, and D.M. Campbell 1996. The reliability of the thermodynamic constants for the dissociation of carbonic acid in seawater. Mar. Chem., 55, 233-245.
Lee, K., F.J. Millero, and R. Wanninkhof. 1997. The carbon dioxide system in the Atlantic Ocean. J. Geophys. Res. 102, 15693-15707.
Lee, K., R. Wanninkhof, T. Takahashi, S.C. Doney, and R.A. Feely. 1998. Low interannual variability in recent oceanic uptake of atmospheric carbon dioxide. Nature, 396, 155-159. Lee, K., R. Wanninkhof, R.A. Feely, F.J. Millero, and T.-H. Peng. 2000a. Global relationships of total inorganic carbon with temperature and nitrate in surface seawater. Global Biogeochem. Cycles, 14(3), 979-994.
Lee, K., F.J. Millero, R.H. Byrne, R.A. Feely, and R. Wanninkhof. 2000b. The recommended dissociation constants for carbonic acid in seawater. Geophys. Res. Lett., 27(2), 229-232. Lee, K., L. Tong, F.J. Millero, C.L. Sabine, A.G. Dickson, C.
Goyet, G.-H. Park, R. Wanninkhof, R.A. Feely, and R.M. Key. 2006. Global relationships of total alkalinity with salinity and temperature in surface waters of the world’s oceans. Geophys. Res. Lett., 33, L19605, doi: 10.1029/2006GL026994. Lefèvre, N. and A. Taylor. 2002. Estimating pCO2 from sea
surface temperatures in the Atlantic gyres. Deep-Sea Res. I, 49, 539-554.
Loukos, H., F. Vivier, P.P. Murphy, D.E. Harrison, and C. Le Quéré. 2000. Interannual variability of equatorial Pacific CO2 fluxes estimated from temperature and salinity data.
Geophys. Res. Lett., 27(12), 1735-1738.
Lueker, T.J., A.G. Dickson, and C.D. Keeling. 2000. Ocean pCO2
calculated from dissolved inorganic carbon, alkalinity, and equations for K-1 and K-2: Validation based on laboratory measurements of CO2 in gas and seawater at equilibrium.
Mar. Chem, 70, 105-119.
McNeil, B.I., N. Metzl, R.M. Key, R.J. Matear, and A. Corbiere. 2007. An empirical estimate of the Southern Ocean air-sea CO2 flux. Global Biogeochem. Cycles, 21, GB3011, doi:10.1029/ 2007GB002991.
Mehrbach, C., C.H. Culberson, J.E. Hawley, and R.M. Pytkowicz. 1973. Measurement of the apparent dissociation constants of carbonic acid in seawater at an atmospheric pressure. Limnol. Oceanogr., 18, 897-907.
Metzl, N., C. Brunet, A. Jabaud-Jan, A. Poisson, and B. Schauer. 2006. Summer and winter air-sea CO2 fluxes in the Southern
Ocean. Deep-Sea Res. I, 53, 1548-1563.
Millero, F.J., D. Pierrot, K. Lee, R. Wanninkhof, R. Feely, C.L. Sabine, R.M. Key, and T. Takahashi. 2002. Dissociation constants for carbonic acid determined from field measurements. Deep-Sea Res. I, 49, 1705-1723.
Millero, F.J., T.B. Graham, F. Huang, H. Bustos-Serrano, and D. Pierrot. 2006. Dissociation constants of carbonic acid in seawater as a function of salinity and temperature. Mar. Chem, 100, 80-94.
Mojica, P. and F.J. Millero. 2002. The values of pK1 + pK2 for the
dissociation of carbonic acid in seawater. Geochim.
Cosmochim. Acta, 66, 2529-2540.
Olsen, A., R.G.J. Bellerby, T. Johannessen, A.M. Omar, and I. Skjelvan. 2003. Interannual variability in the wintertime air-sea flux of carbon dioxide in the northern North Atlantic. 1981-2001, Deep-Sea Res. I, 50, 1323-1338.
Park, G.-H., K. Lee, R. Wanninkhof, and R.A. Feely. 2006. Empirical temperature-based estimates of variability in the oceanic uptake of CO2 over the past 2 decades. J. Geophys.
Res., 111, C07S07, doi:10.1029/2005JC003090.
Poisson, A., N. Metzl, C. Brunet, B. Schauer, B. Brès, D. Ruiz-Pino, and F. Louanchi. 1993. Variability of sources and sinks of CO2 and in the western Indian and Southern Oceans
during the year 1991. J. Geophys. Res., 98, 22759-22778. Quay, P.D., B. Tillbrook, and C.S. Wong. 1992. Oceanic uptake
of fossil fuel CO2: Carbon-13 evidence. Science, 256, 74-79.
Sabine, C.L., R.A. Feely, N. Gruber, R.M. Key, K. Lee, J.L. Bullister, R. Wanninkhof, C.S. Wong, D.W.R. Wallace, B. Tilbrook, F.J. Millero, T.-H. Peng, A. Kozyr, T. Ono, and A.F. Rois. 2004. The oceanic sink for anthropogenic CO2.
Science, 305, 367-371.
Sarma, V.V.S.S., T. Saino, K. Sasaoka, Y. Nojiri, T. Ono, M. Ishii, H.Y. Inoue, and K. Matsumoto. 2006. Basin-scale pCO2 distribution using satellite sea surface temperature, Chl
a, and climatological salinity in the North Pacific in spring and summer. Global Biogeochem. Cycles, 20, GB3005, doi:10.1029/2005GB002594.
Stephens, M.P., G. Samuels, D.B. Olson, R.A. Fine, and T. Takahashi. 1995. Sea-air flux of CO2 in the North Pacific
using shipboard and satellite data. J. Geophys. Res., 100, 13571-13583.
Takahashi, T., R.A. Feely, R. Weiss, R. Wanninkhof, D.W. Chipman, S.C. Sutherland, and T.T. Takahashi. 1997. Global air-sea flux of CO2: An estimate based on measurements of
sea-air pCO2 difference. Proc. Natl. Acad. Sci., 94,
8292-8299.
Takahashi, T., S.C. Sutherland, C. Sweeney, A. Poisson, N. Metzl, B. Tillbrook, N. Bates, R. Wanninkhof, R.A. Feely, C. Sabine, J. Olafsson, and Y. Nojiri. 2002. Global sea-air CO2
flux based on climatological surface ocean pCO2, and
seasonal biological and temperature effects. Deep-Sea Res. II, 49, 1601-1622.
Takahashi, T., S.C. Sutherland, R.A. Feely, and R. Wanninkhof. 2006. Decadal change of the surface water pCO2 in the North
Pacific: A synthesis of 35 years of observations. J. Geophys. Res., 111, C07S05, doi:10.1029/2005JC003074.
Tans, P.P., I.Y. Fung, and T. Takahashi. 1990. Observational constraints on the global atmospheric CO2 budget. Science,
247, 1431-1438.
Tsurushima, N., Y. Nojiri, K. Imai, and S. Watanabe. 2002. Seasonal variations of carbon dioxide system and nutrients in the surface mixed layer at station KNOT (44oN, 155oE) in the
subarctic western North Pacific. Deep-Sea Res. II, 49, 5377-5394.
Wanninkhof, R., E. Lewis, R.A. Feely, and F.J. Millero. 1999. The optimal carbonate dissociation constants for determining surface water pCO2 from alkalinity and total inorganic carbon.
Mar. Chem., 65, 291-301.
Zeng, J.Y., Y. Nojiri, P.P. Murphy, C.S. Wong, and Y. Fujinuma. 2002. A comparison of ΔpCO2 distributions in the northern
North Pacific using results from a commercial vessel in 1995-1999. Deep-Sea Res. II, 49, 5303-5315.