ICCAS2005 June 2-5, KINTEX, Gyeonggi-Do, Korea
1. INTRODUCTION
We can get someone’s DNA Information using DNA Chip Image data. It includes Information of diseases and mutations. In details, DNA chips are designed to identify hybridization products in the same format as with traditional sequencers. Once hybridization has been completed, phosphorescent chemicals that bind to the hybridized sequences are scanned with a light source by laser scanner or CCD cameras, making it easy to detect their revelation with automated colorimetric or fluorimetric equipment [4], [8].
Namely, the concept behind DNA chips is simply that of miniaturizing the gene sequencing technologies already being developed, so that many assays and their related procedures can be performed together. DNA chips will give researchers the ability to analyze thousands of genes at once, and may also make it possible to conduct very elaborate diagnostic procedures in such small settings as a physician's office or even with mobile equipment used at the point of care. We perform the procedures in normal user pc. So, This Paper is about DNA chip Image data analyzing system. We use Neural Network and some Image Processing Algorithms on analysis of DNA Chip Image data.
In Chapter 2, we explain DNA Chip and its analysis system that we performed experiment. In Chapter 3, we show the current research issues, especially, Segregation spot from background, Shrinking Noise and method to solve them. Also in chapter 4, we will show the process of experimental.
In this paper, we perform the experiment processing that includes shrinking noise, edge detection and subtract perimeter background intensity from spot’s intensity. Setting up some regional spots and grids, summation their pixel values if they are under threshold. Then we are able to deal with the Image as lattice which has binary values 1 or 0. Also the binary values demonstrate the whole the image as binary code in its rows or columns. Therefore we can put the data in the ANN (Artificial Neural Network) that has multi layer (more than 2 layers). The ANN is trained by Back Propagation Algorism.
Former all processing is performed on the gray level image and color image. When we use gray level image, we are able to classify for the shape with revelation spots. Also when we
use color element of the image, we can get pattern data more precisely. It makes the result more exactly. Moreover we saw special revelation characteristics by using color image data.
This research is for the performance in user pc circumstances. So the hardware specification is important factor. But we are focus on the analysis algorithm and processing method. It will be our future work.
2. DNA CHIP ANALYSIS
2.1 DNA ChipThe DNA chip (especially we call it another name, cDNA Array Chip) is a revolutionary new tool used to identify mutations and diseases in gene. The chip, which consists of a small glass plate encased in plastic, is manufactured somewhat like a computer microchip. On the surface, each chip contains thousands of short, synthetic, single-stranded DNA sequences, which together, add up to the normal gene in question.
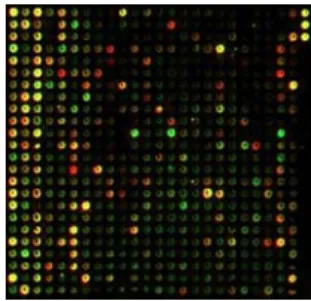
Fig. 1 cDNA Image data that is used in experiment 2.2 Concept of Revelation on DNA chip
We can use purified single-stranded cDNA (complementary DNA) from an individual with a known genetic disease, requiring the use of touch or fine micropipetting, to spot the cDNA onto the surface of the chip. The cDNA immobilizes on the chip through covalent bonds, due to the positively charged surface, produced by amino silane or polylysine. For all types of chips, a potential DNA target sequence, from on to interact with the probes. Hybridization will occur at complementary
Development of Pattern Classifying System for cDNA-Chip Image Data Analysis
Dae-Wook Kim*, Chang-Hyun Park**, and Kwee-Bo Sim***
*Department of Electrical Engineering, Chun-Ang University, Seoul, Korea(Tel : +82-2-820-5319; E-mail: [email protected])
**Department of Electrical Engineering, Chun-Ang University, Seoul, Korea (Tel : +82-2-820-5319; E-mail: [email protected])
***Department of Electrical Engineering, Chun-Ang University, Seoul, Korea (Tel : +82-2-820-5319; E-mail: [email protected])
Abstract: DNA Chip is able to show DNA-Data that includes diseases of sample to User by using complementary characters of DNA. So this paper studied Neural Network algorithm for Image data processing of DNA-chip. DNA chip outputs image data of colors and intensities of lights when some sample DNA is putted on DNA-chip, and we can classify pattern of these image data on user pc environment through artificial neural network and some of image processing algorithms. Ultimate aim is developing of pattern classifying algorithm, simulating this algorithm and so getting information of one's diseases through applying this algorithm. Namely, this paper study artificial neural network algorithm for classifying pattern of image data that is obtained from DNA-chip. And, by using histogram, gradient edge, ANN and learning algorithm, we can analyze and classifying pattern of this DNA-chip image data. so we are able to monitor, and simulating this algorithm.
Keywords: DNA Chip, Neural Network, Image Processing, Pattern Classifying
ICCAS2005 June 2-5, KINTEX, Gyeonggi-Do, Korea
sequences between the two samples resulting in a fluorescent
image, which is then scanned by a laser beam or CCD Camera, and analyzed by a computer. The intensity of fluorescent light varies with the strength of the hybridization, thus providing a quantitative 'snapshot' of gene expression.
2.3 DNA Chip Image data Analysis System
1. DNA
3. DNA - Image data 2. DNA -Chip
Fig. 2 cDNA Image Analysis System
First of all, we have to get cDNA Image data through CCD, CMOS camera or Laser scanner. we can perform some preprocessing and classification of Image Pattern. So we are able to know the information of sample DNA’s mutation or disease on user computer environment. The cDNA chip has 24 x 24 Grids and we will do image processing for its shape and individual colors.
3. RESEARCH ISSUE
The cDNA micro array experiment shows a change between control group and standard group. Precisely, we put a mutated cell as A group, and Its former and post one as B Group. Next, abstracting mRNA from both groups, we can evaluate degree of relative revelation innumerable genes through comparing each quantity that is mapped from individual genes cDNA clone set is made by printing shaped spot which has diameter 100-300um on glass or nylon plate, and a chip has 40,000 spots maximum.
Glass and Nylon is most used as Base material of cDNA. Specially, Glass is more adaptive and useful because it creates fewer singular fluorescent lights than other material
3.1 Segregation spot from background
Currently, there are some methods. ‘Imagene’ and ‘Genepix in Axon Instruments’, ‘ScanAnalyze developed by Stanford Univ.’ and they separate spot from background by circle shape. Also ArraySuit developed by Dr. Yi dong Chen in NIH separate spot from background by recognition pattern of whole spot [5].
At this time, we are able to separate spot from background by edge detection and partition of grids which we already know. So we can make template spot Image.
3.2 Shrinking Noise
Currently, general methods delete noise by cutting upper 15% and lower 15% pixels. But it is not enough because it cuts normal Image pixels. So, in this paper we use preprocessing method that includes binary and morphology. And we cluster Image data to some parts by Using ANN which is robust for noise. So we estimate revelation of special
DNA from Image data which has ANN output values in acceptable range of error. Therefore, it is possible that gaining information from cDNA Image data which includes some noises. Also, to delete fluorescent light that is not wanted, we subtract perimeter pixel values from target spot pixel values. So we can shrink noise which is caused by polluted materials.
When distribution of brightness is accordance with normal distribution, typical summation value of whole individual brightness is similar to typical summation value of two pixel’s brightness. So, to subtract perimeter background pixel values from target spot values, we have to prove that distribution of brightness is normal distribution. To prove this, assuming that cDNA chip is using glass as plate (glass is known base material that rarely creates normal (not wanted) fluorescent light). Major factor of not-wanted fluorescent light is some polluted material which attached on the plate.
In the process of hybridization, it is possible that surface of chip is polluted with some not-wanted material. So there are van der waals forces between base glass and not-wanted material. But the washing process that is after hybridization process omits the not-wanted material in the high dense region more than in the low dense region. Eventually, regional variation of not-wanted material will decrease. So, it proves that not-wanted material distribution of brightness is approximate to normal distribution [5].
So to speak, first of all, we subtract perimeter background pixel values from target spot values to shrink noise. Second, we use ANN algorithm which is robust noise.
Typical value of spot brightness is known (1) ′
+ = i j ij ij ij ad e b
t θ εij (1)
where i is a sample comparison group or standard group,
a
i is total summation value of mRNA extracted from individual groups,j
d is revelation quantity of cDNA on j-th spot, θ ij
is proportion of mRNA quantity created by j-th gene for total mRNA quantity of all group, ′
ij
b is background brightness that
is included in spot brightness. According to former intuitive proof, we can regard that ′
ij
b is the perimeter background
brightness [5].
4. PROCESS OF EXPERIMENT
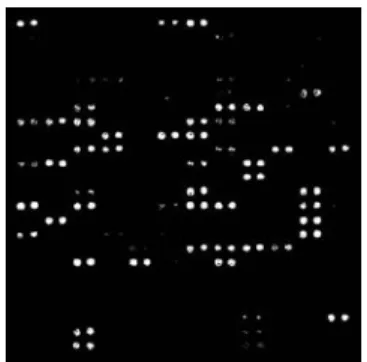
4.1 PreprocessingTwo ways process are performed. First, we can handle the image data in its shape. We make the color image to gray level image. And we can make binary image. Then we manipulate the image for its shape pattern classifying and noise cutting.
Fig. 3 Binary Image of cDNA that is used in experiment
ICCAS2005 June 2-5, KINTEX, Gyeonggi-Do, Korea
Second, we abstract its color element of image data. It’s to
classify the pattern in its colors. All the way is on the pixel based. We can input the data in R G and B format Because we know target pixel’s R, G and B values.
Processing of RGB values in Pattern Classifying will make the result more precisely, and it’s a valid method Because It’s on the basis of color space and the revelation is in color and shape space. Also special color will indicate special revelation. So we can get more information of cDNA
4.2 Process of Experiment
[Step 1]: Edge detection and shrinking Noise
We use nonlinear spatial filter to detect spot’s edge, and subtract perimeter background pixel values from target spot values. It’s related with not-wanted fluorescent light problem. [Step 2]: Setting up uniform boundaries on cDNA Image
Assuming only one type cDNA Image data is used in experiment. There are so many DNA Image types but, actually we use only one type cDNA Image data. Also we summate all of pixel values in the uniform boundary. Setting up uniform boundary is a establishment of lattice on Image data. So, we cut pixels its summation values are under threshold value for obtaining special points of Image.
Fig. 4 Edge and boundary setting [Step 3]: Input special point value into ANN.
To learn the task, we exercise the net by Back Propagation algorithm. And we use MLNN. At this point, to reduce operation load, we except some region that is clear its not-revelation. In other words, there are losses of efficiency because of operation load on ANN pattern recognition. So we except some region that is clear its not-revelation. Also we can separate image into uniform region, and input its handled value into ANN. It is not able to cut the regional value that has over revelation for comparison image. But it has long odds that over revelation data are recognized as correct pattern, when we divide in block and input this data into ANN.
It is on two reasons. First, even if we get over revelation data, naturally, it has positive character because it has target characteristics. Second, it is not matter on the actual experiment because many other spot regional data that we are able to input ANN. So we can cut the data is not wanted.
Fig. 5 Input data into ANN and classifying [Step 4]: Comparison with Target revelation group
When one recognizes and compares some objects, one can scan the shape of target objects by eye watching, and he or she can inspect the object carefully if he needs to get precise information.
In this paper, we imitate the process of recognition and classifying in human system, and compare sample cDNA chip Image data pattern with standard comparison cDNA chip Image. We perform the process of pattern classifying, Using ANN that is robust for noise, so we input data that has noise which is not deleted in preprocessing. But it has risk of local minimum. It is future issue on this project.
After Gray Level shape comparison, we can analyze in color elements from the positive group in former process. Color element is R, G, and B. we perform the experiment former processes for individual elements. Even if revealed data pattern is similar to comparison data pattern for its brightness or intensity, it is possible that actual revealed characteristic is different. So color element processing is to analyze its revealed character in the color space. Therefore, we can analyze the cDNA Image pattern more precisely through color recognition after shape recognition.
5. CONCLUSION
In this paper, we suggest the method that classify pattern of cDNA chip Image data by using edge detection and ANN.
Finally we could get correct Image pattern from cDNA chip image data through the method spatial filter and ANN on gray and color space. And we could classify the image data. The method is for the user pc. So it’s simple and easy to realize.
If the system is not enough powerful that it process the ANN. The performance will be very low. So the future work is that we will improve the speed of processing ANN. It will include modifying the ANN algorithms to be desirable and shrinking Noise more efficiently.
ICCAS2005 June 2-5, KINTEX, Gyeonggi-Do, Korea
ACKNOWLEDGMENTS
This research was supported by the project of Developing SIC(Super Intelligent Chip) and its Applications under the program of Next generation technologies in 2000 of Ministry of Commerce, Industry and Energy.
REFERENCES
[1] Eng, Charis and Jan Viig, “Genetic Testing: The problems and the promise,” Nature Biotechnology, Vol. 15, pp. 422-426, 1997
.
[2] Arun D. Kulkarni, Artificial Neural Networks for Image Understanding, Van Nostrand Reinhold, New York, 1994.
[3] Rafael C. Gonzalez and Richard E. Woods, Digital Image Processing, Prentice Hall, 2002.
[4] Jang B. Rampal, DNA Arrays Methods and Protocols,
Humana Press, Totowa, New Jersey, 2001.
[5] Han-Yang Univ.,Research report about Development for DNA Image analysis software through Deconvolution method
,
Ministry of Science and Technology of Korea, 2004.[6] Tom M. Mitchell, Machine Learning, The McGraw-Hill Companies, Inc., Singapore, 1997.
[7] Abhijit S. Pandya and Robert B. Macy, Pattern
Recognition with Neural Networks in C++, CRC Press,
Florida, 1996.
[8] DNA-chip Technologies (Part 1): Research Fundamentals and Industry Catalysts (1998, Sep) [Online].
Available:http://www.devicelink.com/ivdt/archive/98/09. html.
![Fig. 4 Edge and boundary setting [Step 3]: Input special point value into ANN.](https://thumb-ap.123doks.com/thumbv2/123dokinfo/4891937.37153/3.892.490.808.120.518/edge-boundary-setting-step-input-special-point-value.webp)
