저작자표시-비영리-변경금지 2.0 대한민국 이용자는 아래의 조건을 따르는 경우에 한하여 자유롭게 l 이 저작물을 복제, 배포, 전송, 전시, 공연 및 방송할 수 있습니다. 다음과 같은 조건을 따라야 합니다: l 귀하는, 이 저작물의 재이용이나 배포의 경우, 이 저작물에 적용된 이용허락조건 을 명확하게 나타내어야 합니다. l 저작권자로부터 별도의 허가를 받으면 이러한 조건들은 적용되지 않습니다. 저작권법에 따른 이용자의 권리는 위의 내용에 의하여 영향을 받지 않습니다. 이것은 이용허락규약(Legal Code)을 이해하기 쉽게 요약한 것입니다. Disclaimer 저작자표시. 귀하는 원저작자를 표시하여야 합니다. 비영리. 귀하는 이 저작물을 영리 목적으로 이용할 수 없습니다. 변경금지. 귀하는 이 저작물을 개작, 변형 또는 가공할 수 없습니다.
Radiomics on gadoxetic acid-enhanced
magnetic resonance imaging for
prediction of postoperative early and
late recurrence of single hepatocellular
carcinoma
Sungwon Kim
Department of Medicine
The Graduate School, Yonsei University
[UCI]I804:11046-000000522059
[UCI]I804:11046-000000522059
Radiomics on gadoxetic acid-enhanced
magnetic resonance imaging for
prediction of postoperative early and
late recurrence of single hepatocellular
carcinoma
Sungwon Kim
Department of Medicine
Radiomics on gadoxetic acid-enhanced
magnetic resonance imaging for
prediction of postoperative early and
late recurrence of single hepatocellular
carcinoma
Directed by Professor Jin-Young Choi
Doctoral Dissertation
submitted to the Department of Medicine,
the Graduate School of Yonsei University
in partial fulfillment of the requirements for the degree
of Doctor of Philosophy
Sungwon Kim
This certifies that the Doctoral
Dissertation of Sungwon Kim is
approved.
---
Thesis Supervisor : Jin-Young Choi
---
Thesis Committee Member#1 : Do-Young Kim
---
Thesis Committee Member#2 : Gi Hong Choi
---
Thesis Committee Member#3: Sun Kook Yoo
---
Thesis Committee Member#4: Seung Soo Lee
The Graduate School
Yonsei University
ACKNOWLEDGEMENTS
I would like to express my gratitude towards my supervisor,
professor Jin-Young Choi for all the guidance, constant
supervision and the encouragement which helped me in
completion of this paper.
I also wish to express my gratitude to the committee members,
professor Do-Young Kim, Gi Hong Choi, Sun Kook Yoo and
Seung Soo Lee for sharing their precious time and comment
during the period of my paper work.
<TABLE OF CONTENTS>
ABSTRACT ··· 1
I. INTRODUCTION ··· 3
II. MATERIALS AND METHODS ··· 4
1. Study Population ··· 4
2. MR Imaging Protocol ··· 8
3. MR Radiomic Feature Analysis ··· 8
A. Image Segmentation and Preprocessing ··· 8
B. Radiomic Feature Extraction ··· 9
C. Feature Selection and Prediction Model Building ··· 10
4. Pathological Evaluation ··· 11
5. Evaluation of Outcome ··· 12
6. Statistical Analysis ··· 12
III. RESULTS ··· 13
1. Patient Characteristics ··· 13
2. Clinicopathologic Prognostic Factors ··· 13
3. MR Radiomic Analysis and Model Comparison ··· 16
IV. DISCUSSION ··· 27 V. CONCLUSION ··· 32 REFERENCES ··· 33 APPENDICES ··· 39 ABSTRACT(IN KOREAN) ··· 46 PUBLICATION LIST ··· 48
LIST OF FIGURES
Figure 1. Flow chart of the study population ··· 6
Figure 2. Framework for radiomic analysis ··· 10
Figure 3. Three prognostic models for predicting disease-free
survival in hepatocellular carcinoma ··· 11
Figure 4. A representative case for poor prognosis ··· 22
Figure 5. Combined clinicopathologic-radiomic model for
predicting disease-free survival in early postoperative period
(<2 years) in patients with 2-5 cm HCCs ··· 24
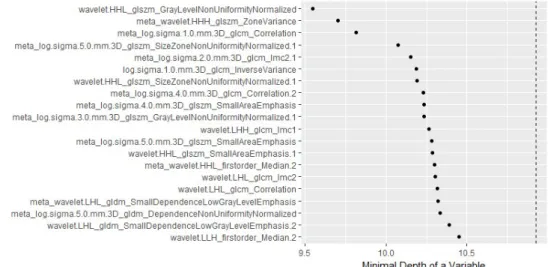
Figure 6. The order of importance of the selected features
according to the minimum depth order of the random survival
forest ··· 27
LIST OF TABLES
Table 1. Patient characteristics in the training and validation sets
··· 7
Table 2. Prognostic factors of early versus late recurrence in 2-5
cm hepatocellular carcinomas ··· 14
Table 3. Comparison of diagnostic performance of radiomic
model versus clinicopathologic model according to peritumoral
border extension (all three dynamic phases were used) ··· 17
Table 4. Comparison of diagnostic performance of radiomic
model versus clinicopathologic model according to dynamic
phases included in the radiomic analysis (in the condition of 3
mm peritumoral border extension) ··· 19
Table 5. Selected radiomic features for 2-5 cm HCCs with 3 mm
- 1 -
ABSTRACT
Radiomics on gadoxetic acid-enhanced magnetic resonance imaging for prediction of postoperative early and late recurrence of single
hepatocellular carcinoma Sungwon Kim Department of Medicine
The Graduate School, Yonsei University (Directed by Professor Jin-Young Choi)
Purpose: To evaluate the usefulness of the radiomic model in predicting early (≤2 years) and late (>2 years) recurrence after curative resection in cases involving a single hepatocellular carcinoma (HCC) 2-5 cm in diameter using preoperative gadoxetic acid-enhanced magnetic resonance imaging (MRI), in comparison to the clinicopathologic model.
Methods: This retrospective study included 167 patients with surgically resected and pathologically confirmed single HCC 2-5cm in diameter (n = 167, training set:validation set = 128:39) who underwent preoperative gadoxetic acid-enhanced MRI between January 2010 and December 2015. A radiomic model, a clinicopathologic model, and a combined clinicopathologic-radiomic (CCR) model were built using a random survival forest to predict disease-free survival (DFS) in the following conditions: early DFS vs. late DFS, dynamic phases, and the peritumoral area included in the segmentation.
Results: The radiomic model showed a prognostic performance comparable to the clinicopathologic model only with 3 mm peritumoral border extension (c-index difference [radiomic-clinicopathologic], -0.021, P = 0.758). The CCR model with the 3 mm border extension showed the highest c-index value but no statistically significant improvement over the clinicopathologic model (CCR, 0.716 [0.627-0.799]; clinicopathologic model, 0.696 [0.557-0.799]).
- 2 -
mm border extension showed comparable performance to that of the postoperative clinicopathologic model for predicting DFS of early recurrence of HCC using gadoxetic acid-enhanced MRI. This suggests the importance of including peritumoral changes in the radiomic analysis of HCC.
Key words : radiomics, texture analysis, hepatocellular carcinoma, tumor recurrence
- 3 -
Radiomics on gadoxetic acid-enhanced magnetic resonance imaging for prediction of postoperative early and late recurrence of single
hepatocellular carcinoma Sungwon Kim Department of Medicine
The Graduate School, Yonsei University (Directed by Professor Jin-Young Choi)
I. INTRODUCTION
Hepatocellular carcinoma (HCC) is one of the most common malignant tumors in the liver worldwide and is particularly prevalent in East Asia. Among the various therapeutic options, hepatic resection is considered one of the most efficient treatments in patients with HCC when liver function is preserved. Perioperative safety or long-term survival has recently increased
after surgery, but postoperative recurrence of HCC remains high 1,2.
The pathophysiology of intrahepatic recurrence may be intrahepatic
metastasis of the primary carcinoma or de novo multicentric tumor 3. The
distinction between these two types of recurrence is important for surveillance,
prevention, and management strategies of recurrence 4,5. A definitive method to
distinguish between the two is a genetic or molecular study, but it is technically
complex, making its application in clinical practice difficult 6,7. Several recent
studies have reported that aggressive pathological factors, such as high tumor grade, microvascular invasion (MVI), and microsatellite lesions, are associated with tumor recurrence within 2 years after surgery. However, late recurrence is associated with underlying liver conditions, such as liver cirrhosis 8-10. Since
imaging is closely correlated with histopathological examination, some imaging features may reasonably predict tumor recurrence.
- 4 -
Radiomics is an emerging field that converts medical imaging into
high-dimensional mineable features using a large number of
image-characterization algorithms 11. Prognostic prediction models may be built
from noninvasively extracted radiomic features in tumor images 12. Recently, a
few radiomic analyses of the early recurrence of HCC based on computed tomography (CT) images have been conducted, and the prediction accuracy was
high 13. However, to the best of our knowledge, few attempts have been made to
evaluate both early and late recurrence using radiomic approach. In addition, magnetic resonance imaging (MRI) is known to have a higher soft tissue contrast than CT image, and gadoxetic acid contrast-enhanced MRI can provide functional information such as hepatic uptake. Therefore, we hypothesized that radiomics analysis using gadoxetic acid-enhanced MRI would have comparable or incremental value in predicting early and late recurrence compared with clinicopathologic models.
In this study, we aimed to evaluate the usefulness of the radiomic model in predicting early and late recurrence after curative resection in a single HCC larger than 2 cm and smaller than or equal to 5 cm in diameter using
preoperative gadoxetic acid-enhanced MRI, compared with the
clinicopathologic model.
II. MATERIALS AND METHODS 1. Study Population
From January 2010 to December 2015, consecutive patients who underwent curative resection for HCC confirmed pathologically after surgery were included. The inclusion criteria for our study were as follows: (a) a single HCC larger than 2 cm and smaller than or equal to 5 cm, (b) no extrahepatic metastasis or major vascular invasion, (c) no infiltrative type HCC, satellite
- 5 -
nodule, serosal invasion, or adjacent organ invasion, (d) patients who underwent preoperative gadoxetic acid-enhanced magnetic resonance (MR) imaging within 2 months before surgery, and (e) HCC with hypointensity on hepatobiliary phase (HBP). HCC is known to have different prognosis and prognostic factors based on whether the diameter of the tumor is less than 2 cm or more than 5 cm. More specifically, HCCs larger than 5 cm in maximum diameter are known to
have a greater chance of spreading through MVI and poor prognosis 14-16, and
small HCCs less than 2 cm are known to be associated with an excellent
prognosis not being affected by MVI, histologic grade, or tumor marker level 16.
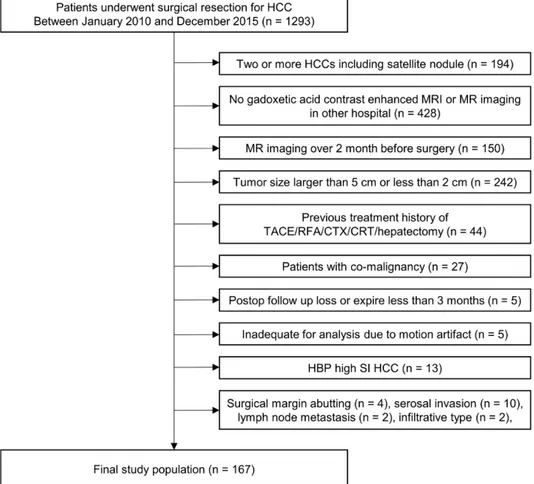
Therefore, we included only single HCC with a diameter larger than 2 cm and smaller than or equal to 5 cm for analysis. The exclusion criteria for our study were as follows: (a) pre-treatment history before hepatectomy (n =44), (b) patients with co-malignancy (n =27), (c) postop follow-up loss or expired less than 3 months (n =5), and inadequate for analysis due to motion artifact (n =5) (Figure 1).
The final study population consisted of 167 patients (mean age, 56 years; range, 30-77 years), including 131 men (mean age, 56 years; range, 30-77 years) and 36 women (mean age, 58 years; range 39-72; Table 1). The median time between MR imaging and surgery was 23 days (range, 8-59 days). For temporally independent validation, patients who underwent surgery prior to October 2013 were assigned to a training cohort (n = 128), and the subsequent patients were assigned to a validation cohort (n = 39).
The institutional review board approved this retrospective study, and the requirement for informed consent was waived because of the retrospective nature of the study. This study was conducted in accordance with the Declaration of Helsinki.
- 6 -
Figure 1. Flow chart of the study population.
Note. HCC, hepatocellular carcinoma; MRI, magnetic resonance imaging; TACE, transcatheter arterial chemoembolization; RFA, radiofrequency ablation; CTX, chemotherapy; CRT, chemoradiotherapy; HBP, hepatobiliary phase; SI, signal intensity
- 7 -
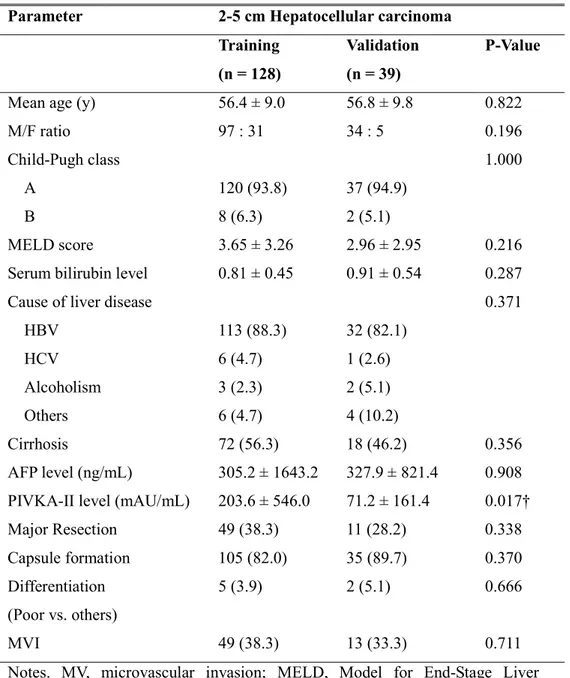
Table 1. Patient characteristics in the training and validation sets
Notes. MV, microvascular invasion; MELD, Model for End-Stage Liver Disease; HBV, hepatitis B virus; HCV, hepatitis C virus
†Statistically significant
Parameter 2-5 cm Hepatocellular carcinoma
Training (n = 128)
Validation (n = 39)
P-Value
Mean age (y) 56.4 ± 9.0 56.8 ± 9.8 0.822
M/F ratio 97 : 31 34 : 5 0.196
Child-Pugh class 1.000
A 120 (93.8) 37 (94.9)
B 8 (6.3) 2 (5.1)
MELD score 3.65 ± 3.26 2.96 ± 2.95 0.216
Serum bilirubin level 0.81 ± 0.45 0.91 ± 0.54 0.287
Cause of liver disease 0.371
HBV 113 (88.3) 32 (82.1) HCV 6 (4.7) 1 (2.6) Alcoholism 3 (2.3) 2 (5.1) Others 6 (4.7) 4 (10.2) Cirrhosis 72 (56.3) 18 (46.2) 0.356 AFP level (ng/mL) 305.2 ± 1643.2 327.9 ± 821.4 0.908
PIVKA-II level (mAU/mL) 203.6 ± 546.0 71.2 ± 161.4 0.017†
Major Resection 49 (38.3) 11 (28.2) 0.338 Capsule formation 105 (82.0) 35 (89.7) 0.370 Differentiation (Poor vs. others) 5 (3.9) 2 (5.1) 0.666 MVI 49 (38.3) 13 (33.3) 0.711
- 8 -
2. MR Imaging Protocol
MRI was performed using one of the three 3.0-T systems (Magnetom Trio a Tim, Siemens Medical Solutions, Erlangen, Germany; Achieva, Philips Medical Systems, Best, The Netherlands; Discovery, GE Medical Systems, Milwaukee, Wisconsin, USA) or a 1.5-T system (Achieva 1.5-T, Philips Medical Systems, Appendix 1).
All images were obtained in the transverse plane with a field of view of 44 × 33 cm or 40 × 30 cm. Two-dimensional dual-echo T1-weighted gradient-recalled-echo images were initially obtained (in-phase and opposed-phase). Dynamic images were obtained before and after contrast material administration in arterial, portal venous, hepatic venous, and final dynamic phases by using a T1-weighted three-dimensional gradient-echo sequence. To determine the imaging delay for arterial phase imaging, we used a bolus technique with 1 mL of gadoxetic acid disodium (Primovist; Bayer Schering Pharma, Berlin, Germany) and a 20 mL of 0.9% saline chaser at an injection rate of 1 or 2 mL/s to determine the peak enhancement of the abdominal aorta. For dynamic imaging, 0.1 mL/kg (0.025 mmol/kg) of gadoxetic acid disodium was injected, followed by a 20 mL of saline chaser at the same rate as that used for the bolus injection. T2-weighted images were obtained with multi-shot and single-shot turbo spin-echo sequences by using a navigator-triggered technique. Diffusion-weighted images were also obtained using a navigator-triggered technique at b values of 50, 400, and 800 s/mm2,
and the apparent diffusion coefficient was calculated by the MR units. 3. MR Radiomic Feature Analysis
A. Image Segmentation and Preprocessing
In the preoperative gadoxetic acid contrast-enhanced dynamic liver MRI, arterial phase (AP), portal phase (PP), and HBP images were downloaded
- 9 -
in a Digital Imaging and Communications in Medicine format. Registration was then performed on the three phases with resampling the image to a voxel size of 1×1×1 mm. One abdominal radiologist semi-automatically segmented the tumor lesion in HBP images 3 dimensionally using 3D slicer (www.slicer.org), and the
generated mask was commonly used for AP, PP, and HBP images 17. The drawn
mask expanded the 3 mm and 5 mm outwards, creating three kinds of 3D masks with border extensions (0 mm, 3 mm, and 5 mm) to capture the radiomic features of the peritumoral area as well as inside the tumor. Another radiology resident independently performed tumor segmentation on randomly chosen 30 lesions to evaluate interobserver reproducibility.
B. Radiomic Feature Extraction
Feature extraction and additional image preprocessing were performed using PyRadiomics (version 1.3.0; Computational Imaging and Bioinformatics
Lab, Harvard Medical School) 18. Before the feature extraction, normalization of
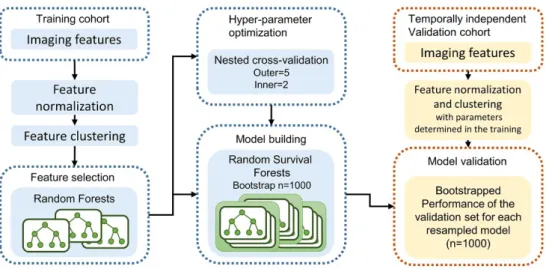
the MRI signal intensities (SI) was performed using PyRadiomics because MRI SI is usually relative with large differences between scanners and vendors. For 1301 radiomic features were extracted for each dynamic phase, a maximum of 3903 features were obtained when all three phases were used. Radiomic features were extracted for each phase combination (AP, PP, HBP, AP-PP, AP-HBP, PP-HBP, and AP-PP-HBP) to evaluate the most predictive combination of the phases, and for each border extension (0 mm, 3 mm, and 5 mm) to assess the effect of peritumoral change on prognosis. Subsequently, feature normalization was performed using z-score, and hierarchical feature clustering was performed using Spearman correlation coefficient (Figure 2). Z-score normalization was performed first in the training cohort and then we recorded the mean and standard deviation values for each radiomic feature. This process did not include a validation cohort. In the validation phase, the radiomic feature values of the validation cases were z-score normalized using the mean and standard
- 10 -
deviation values of each radiomic feature memorized in the training cohort. Therefore, validation cases can be predicted one at a time.
Figure 2. Framework for radiomic analysis.
C. Feature Selection and Prediction Model Building
We performed radiomic feature selection using a random forest minimal depth algorithm and built the prognostic model using random survival
forest 19,20, which is one of the methods for survival dataset. More specifically,
we used two splitting methods in the random survival forest, namely, logrank
method 21 and the maximally selected rank statistics (maxstat) method 22. These
methods have recently reported good results as model training methods for survival analysis 23. We presented both results of the two different splitting rules
to assess the consistency of the predictions. Hyperparameter optimization was performed to increase model generalizability before building the final prognostic model using the nested cross-validation with 5 outer iterations and 2 inner iterations 23.
In addition to the radiomic model, a clinicopathologic model and a combined clinicopathologic-radiomic (CCR) model were built to evaluate the prognostic performance of all three models and incremental value of the
- 11 -
radiomic model (Figure 3). Prognostic model training was performed n = 1000 times using bootstrap samples of the training cohort. The performances were evaluated in the temporally independent validation set using the Harrell’s
concordance index (c-index) 24. Diagnostic performances of the model were
compared via the 95% confidence interval (CI) for the difference of the c-index. The difference was considered to be significant if the 95% CI did not include 0. The 95% CI was estimated using the percentile bootstrap method with 1,000
resamples 25. A detailed description of the radiomic analysis is given in
Appendix 2.
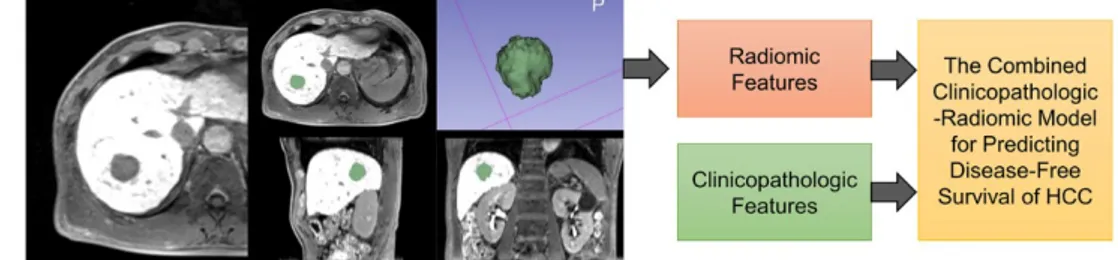
Figure 3. Three prognostic models for predicting disease-free survival in hepatocellular carcinoma.
4. Pathological Evaluation
The surgical specimens of all patients were subjected to histopathological analysis. Pathologic data analyzed in this study were histologic tumor grade, capsule formation, fibrous capsule invasion, presence of gross and/or microscopic vascular invasion, presence of satellite nodule, and surgical margin abutting. Histologic tumor grade was determined by the following predominant features: well differentiated, moderately differentiated, or poorly differentiated. Capsule formation was recorded as present or absent. Vascular invasion was classified as macroscopic and microscopic depending on the involvement level by the tumor. MVI was defined as a tumor within a vascular space lined by endothelium that was visible only on microscopy.
- 12 -
5. Evaluation of Outcome
All patients underwent contrast-enhanced CT or MRI at 3–6 months after surgery and were followed up. During the follow-up period, we retrospectively reviewed the medical records for tumor recurrence. Tumor recurrence was determined by radiologic evidence of new tumor in imaging studies. Early recurrence was defined as recurrence within 2 years after curative resection of HCC and late recurrence was defined as recurrence after 2 years after curative resection of HCC. For early recurrence, disease-free survival (DFS) was defined as the interval between the date of surgery and the first date of tumor recurrence on imaging (event) within 2 years or the last follow-up date without recurrence (censored) within 2 years. All cases that did not relapse by 2 years were censored. For late recurrence, DFS was defined as the interval between the date of surgery and the first date of tumor recurrence on imaging (event) after 2 years or the last follow-up date without recurrence (censored). The early recurrence cases that recurred within 2 years were censored.
6. Statistical Analysis
DFS was assessed by the Kaplan–Meier method, and differences in survival distributions between groups were compared using log-rank tests. Cox regression analysis was performed to identify the independent clinicopathologic prognostic factors for DFS. Multivariate Cox regression was performed for variables with a P-value of ≤0.2 in the univariate Cox regression analysis. The Harrell’s c-index was used to assess prognostic accuracy 24 and hazard ratios
and 95% confidence intervals were measured. The interobserver reproducibility of the radiomic features was evaluated in terms of the intraclass correlation coefficient (ICC). An ICC value greater than 0.75 was considered indicative of good reproducibility 26. All statistical and radiomic analyses were performed
using the R software (version 3.3.1; R Foundation for Statistical Computing, Vienna, Austria). A P-value of <0.05 was considered statistically significant.
- 13 -
III. RESULTS
1. Patient Characteristics
The characteristics of patients in the training and validation sets are summarized in Table 1. No significant differences were found in most clinicopathologic factors between the training and validation sets. Protein induced by vitamin K absence or antagonist-II showed a significant difference between the training and validation sets, but α-fetoprotein showed no significant difference.
In the final study population (n = 167), histological examination of non-cancerous liver parenchyma showed 90 patients with cirrhosis (53.9%). Underlying causes of HCC were hepatitis B infection (n = 145, 86.8%), hepatitis C infection (n = 7, 4.2%), alcoholic liver disease (n = 5, 3.0%), and other origin (n = 10, 6.0%). The surgical resection comprised 60 (35.9%) major resections (≥3 segments according to Couinaud classification) and 107 (64.1%) minor resections or wedge resections. Recurrences occurred in 61 patients (early recurrence, 32; late recurrence, 29) of the 167 patients with estimated 1-, 2-, and 5-year cumulative global DFS rates were 90.9% (95% CI: 86.6, 95.4), 80.4% (95% CI: 74.5, 86.7), and 61.5% (95% CI: 53.8-70.2), respectively.
2. Clinicopathologic Prognostic Factors
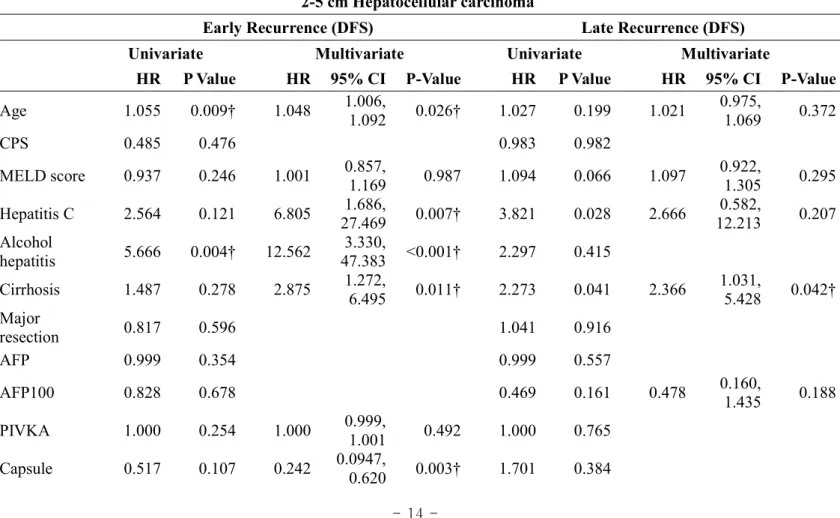
Survival analysis for DFS was performed for early and late recurrences. The identified independent factors for early recurrence were age, hepatitis C infection, alcohol hepatitis, cirrhosis, tumor capsule, and MVI. For late recurrence, cirrhosis was the only independent prognostic factor (Table 2).
- 14 -
Table 2. Prognostic factors of early versus late recurrence in 2-5 cm hepatocellular carcinomas 2-5 cm Hepatocellular carcinoma
Early Recurrence (DFS) Late Recurrence (DFS)
Univariate Multivariate Univariate Multivariate
HR P Value HR 95% CI P-Value HR P Value HR 95% CI P-Value
Age 1.055 0.009† 1.048 1.006, 1.092 0.026† 1.027 0.199 1.021 0.975, 1.069 0.372 CPS 0.485 0.476 0.983 0.982 MELD score 0.937 0.246 1.001 0.857, 1.169 0.987 1.094 0.066 1.097 0.922, 1.305 0.295 Hepatitis C 2.564 0.121 6.805 27.469 1.686, 0.007† 3.821 0.028 2.666 12.213 0.582, 0.207 Alcohol hepatitis 5.666 0.004† 12.562 3.330, 47.383 <0.001† 2.297 0.415 Cirrhosis 1.487 0.278 2.875 1.272, 6.495 0.011† 2.273 0.041 2.366 1.031, 5.428 0.042† Major resection 0.817 0.596 1.041 0.916 AFP 0.999 0.354 0.999 0.557 AFP100 0.828 0.678 0.469 0.161 0.478 0.160, 1.435 0.188 PIVKA 1.000 0.254 1.000 0.999, 1.001 0.492 1.000 0.765 Capsule 0.517 0.107 0.242 0.0947, 0.620 0.003† 1.701 0.384
- 15 - Differentiati on 1.494 0.583 1.000 0.997 MVI 2.075 0.039† 2.711 1.220, 6.027 0.014† 1.031 0.936 Serum bilirubin 0.495 0.174 0.337 0.0715, 1.585 0.168 1.524 0.138 0.698 0.236, 2.068 0.517
Notes. DFS, disease free survival; CI, confidence interval; CPS, Child-Pugh score A versus B; MELD, Model for End-Stage Liver Disease; AFP100, AFP level over 100; MVI, microvascular invasion
- 16 -
3. MR Radiomic Analysis and Model Comparison
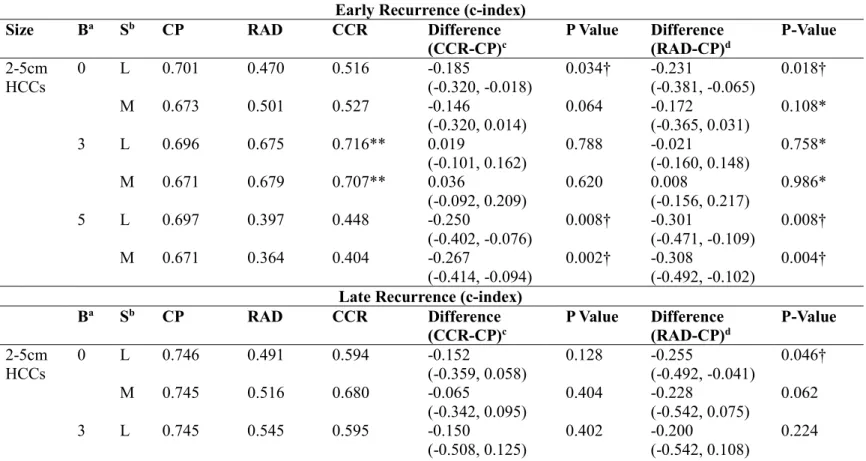
We evaluated the performance of the clinicopathologic, radiomic, and CCR models for three tumor border extensions (0 mm, 3 mm, 5 mm).
For the prediction of DFS in early recurrence, the radiomic model showed a prognostic performance comparable to the clinicopathologic model without statistically significant difference, only with 3 mm border extension (c-index difference [radiomic-clinicopathologic], logrank -0.021, P = 0.758; maxstat, 0.008, P = 0.986) (Table 3). When the 3 mm border extension was used, the highest radiomic prognostic performance was observed (c-index, logrank 0.675; maxstat 0.679) and the highest prognostic performance of the CCR model was observed (logrank 0.716, maxstat 0.707) (Table 3, Figure 4).
The CCR model showed no statistically significant improvement over the clinicopathologic model in all cases (Table 3). Except for 3mm border extension, most of the CCR models were less predictive than the clinicopathologic models with or without statistical significance.
For late recurrence DFS prediction, the radiomic model did not show statistically significant different c-index values to those of the clinicopathologic model, but numerically the radiomic model showed lower c-index values than the clinicopathologic model in all cases. The highest c-index value was observed in the clinicopathologic model (c-index, 0.746; Table 3).
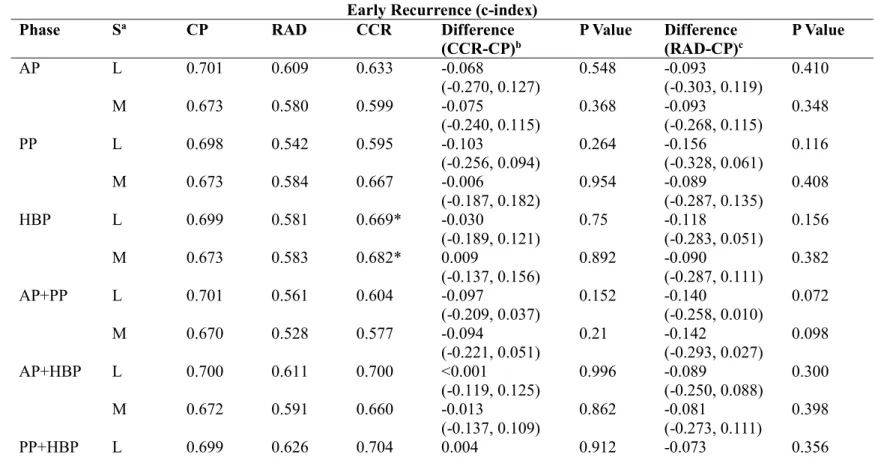
For the analysis of combination of different phases of gadoxetic acid-enhanced MRI, the highest c-index was achieved when all three phases were used to predict early recurrence (c-index, logrank 0.716; maxstat 0.707; Table 4). Among the single phases, HBP showed the highest c-index value (c-index, logrank 0.669; maxstat 0.682; Table 4).
- 17 -
Table 3. Comparison of diagnostic performance of radiomic model versus clinicopathologic model according to peritumoral border extension (all three dynamic phases were used)
Early Recurrence (c-index)
Size Ba Sb CP RAD CCR Difference
(CCR-CP)c P Value Difference (RAD-CP)d P-Value
2-5cm HCCs 0 L 0.701 0.470 0.516 -0.185 (-0.320, -0.018) 0.034† -0.231 (-0.381, -0.065) 0.018† M 0.673 0.501 0.527 -0.146 (-0.320, 0.014) 0.064 -0.172 (-0.365, 0.031) 0.108* 3 L 0.696 0.675 0.716** 0.019 (-0.101, 0.162) 0.788 -0.021 (-0.160, 0.148) 0.758* M 0.671 0.679 0.707** 0.036 (-0.092, 0.209) 0.620 0.008 (-0.156, 0.217) 0.986* 5 L 0.697 0.397 0.448 -0.250 (-0.402, -0.076) 0.008† -0.301 (-0.471, -0.109) 0.008† M 0.671 0.364 0.404 -0.267 (-0.414, -0.094) 0.002† -0.308 (-0.492, -0.102) 0.004† Late Recurrence (c-index)
Ba Sb CP RAD CCR Difference
(CCR-CP)c P Value Difference (RAD-CP)d P-Value
2-5cm HCCs 0 L 0.746 0.491 0.594 -0.152 (-0.359, 0.058) 0.128 -0.255 (-0.492, -0.041) 0.046† M 0.745 0.516 0.680 -0.065 (-0.342, 0.095) 0.404 -0.228 (-0.542, 0.075) 0.062 3 L 0.745 0.545 0.595 -0.150 (-0.508, 0.125) 0.402 -0.200 (-0.542, 0.108) 0.224
- 18 - M 0.737 0.622 0.716 -0.021 (-0.358, 0.225) 0.894 -0.115 (-0.475, 0.258) 0.468 5 L 0.744 0.705 0.711 -0.033 (-0.208, 0.359) 0.628 -0.039 (-0.225, 0.408) 0.524 M 0.744 0.696 0.696 -0.048 (-0.292, 0.178) 0.636 -0.048 (-0.358, 0.358) 0.594 Note. CP, clinicopathologic model; RAD, radiomic model; CCR, combined clinicopathologic-radiomic model; Difference, difference between c-indices of the prognostic models; 0, 3, 5, the peritumoral border extension (mm); L, logrank split rule; M, maxstat split rule
Each prognostic model training was performed n = 1000 times using bootstrap samples of the training cohort. The performances were evaluated in the temporally independent validation set using the c-index. The number of training set and validation set was 128 and 39.
aB means peritumoral border extension (mm)
bS means splitting methods for the random survival forest
cDifference (CCR-CP) means difference between c-indices of the CCR and CP; Numbers in parentheses are 95% confidence
intervals
dDifference (RAD-CP) means difference between c-indices of the RAD and CP; Numbers in parentheses are 95% confidence
intervals
*The radiomic model showed a prognostic performance comparable to the clinicopathologic model without statistically significant difference.
**The highest value in the CCR models. However, the CCR model showed no statistically significant improvement over the clinicopathologic model.
- 19 -
Table 4. Comparison of diagnostic performance of radiomic model versus clinicopathologic model according to dynamic phases included in the radiomic analysis (in the condition of 3 mm peritumoral border extension)
Early Recurrence (c-index)
Phase Sa CP RAD CCR Difference
(CCR-CP)b P Value Difference (RAD-CP)c P Value
AP L 0.701 0.609 0.633 -0.068 (-0.270, 0.127) 0.548 -0.093 (-0.303, 0.119) 0.410 M 0.673 0.580 0.599 -0.075 (-0.240, 0.115) 0.368 -0.093 (-0.268, 0.115) 0.348 PP L 0.698 0.542 0.595 -0.103 (-0.256, 0.094) 0.264 -0.156 (-0.328, 0.061) 0.116 M 0.673 0.584 0.667 -0.006 (-0.187, 0.182) 0.954 -0.089 (-0.287, 0.135) 0.408 HBP L 0.699 0.581 0.669* -0.030 (-0.189, 0.121) 0.75 -0.118 (-0.283, 0.051) 0.156 M 0.673 0.583 0.682* 0.009 (-0.137, 0.156) 0.892 -0.090 (-0.287, 0.111) 0.382 AP+PP L 0.701 0.561 0.604 -0.097 (-0.209, 0.037) 0.152 -0.140 (-0.258, 0.010) 0.072 M 0.670 0.528 0.577 -0.094 (-0.221, 0.051) 0.21 -0.142 (-0.293, 0.027) 0.098 AP+HBP L 0.700 0.611 0.700 <0.001 (-0.119, 0.125) 0.996 -0.089 (-0.250, 0.088) 0.300 M 0.672 0.591 0.660 -0.013 (-0.137, 0.109) 0.862 -0.081 (-0.273, 0.111) 0.398 PP+HBP L 0.699 0.626 0.704 0.004 0.912 -0.073 0.356
- 20 - (-0.113, 0.123) (-0.217, 0.092) M 0.677 0.594 0.698 0.021 (-0.127, 0.164) 0.738 -0.083 (-0.293, 0.111) 0.394 ALL L 0.696 0.675 0.716** 0.019 (-0.101, 0.162) 0.788 -0.021 (-0.160, 0.148) 0.758 M 0.671 0.679 0.707** 0.036 (-0.092, 0.209) 0.620 0.008 (-0.156, 0.217) 0.986 Late Recurrence (c-index)
Phase Sa CP RAD CCR Difference
(CCR-CP)b P Value Difference (RAD-CP)c P Value AP L 0.740 0.483 0.485 -0.255 (-0.475, 0.175) 0.070 -0.257 (-0.492, 0.192) 0.068 M 0.738 0.381 0.464 -0.273 (-0.575, 0.108) 0.138 -0.357 (-0.608, 0.092) 0.076 PP L 0.744 0.489 0.498 -0.245 (-0.408, 0.142) 0.066 -0.255 (-0.425, 0.142) 0.068 M 0.741 0.609 0.663 -0.078 (-0.275, 0.308) 0.376 -0.132 (-0.308, 0.309) 0.136 HBP L 0.744 0.516 0.519 -0.225 (-0.425, 0.175) 0.056 -0.228 (-0.442, 0.175) 0.056 M 0.744 0.427 0.504 -0.240 (-0.592, 0.042) 0.088 -0.317 (-0.642, 0.008) 0.054 AP+PP L 0.745 0.607 0.621 -0.124 (-0.342, 0.094) 0.212 -0.138 (-0.358, 0.094) 0.168 M 0.742 0.514 0.610 -0.132 (-0.408, 0.142) 0.268 -0.228 (-0.492, 0.158) 0.132 AP+HBP L 0.743 0.233 0.269 -0.474 0.026† -0.511 0.024†
- 21 - (-0.675, -0.125) (-0.692, -0.125) M 0.740 0.398 0.569 -0.172 (-0.525, 0.125) 0.306 -0.342 (-0.625, 0.075) 0.064 PP+HBP L 0.744 0.509 0.545 -0.199 (-0.492, 0.108) 0.198 -0.236 (-0.508, 0.075) 0.112 M 0.744 0.529 0.570 -0.174 (-0.492, 0.092) 0.240 -0.216 (-0.475, 0.108) 0.138 ALL L 0.745 0.545 0.595 -0.150 (-0.508, 0.125) 0.402 -0.200 (-0.542, 0.108) 0.224 M 0.737 0.622 0.716 -0.021 (-0.358, 0.225) 0.894 -0.115 (-0.475, 0.258) 0.468 Note. CP, clinicopathologic model; RAD, radiomic model; CCR, combined clinicopathologic-radiomic model; Difference, difference between c-indices of the prognostic models; 0, 3, 5, the peritumoral border extension (mm); L, logrank split rule; M, maxstat split rule; AP, arterial phase; PP, portal phase; HBP, hepatobiliary phase; ALL, all three phases of AP, PP, and HBP Each prognostic model training was performed n = 1000 times using bootstrap samples of the training cohort. The performances were evaluated in the temporally independent validation set using the c-index. The number of training set and validation set was 128 and 39.
aS means splitting methods for the random survival forest
bDifference (CCR-CP) means difference between c-indices of the CCR and CP; Numbers in parentheses are 95% confidence
intervals
cDifference (RAD-CP) means difference between c-indices of the RAD and CP; Numbers in parentheses are 95% confidence
intervals
*Among the single phases, HBP showed the highest c-index value.
**The highest c-index was achieved when all three phases were used to predict early recurrence. †Statistically significant
- 22 -
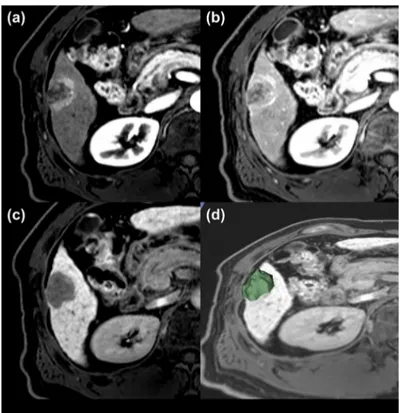
Figure 4. A representative case for poor prognosis. Magnetic resonance imaging findings for a representative case involving a 54-year-old male exhibiting a 3.0-cm hepatocellular carcinoma (HCC). Gadoxetic acid-enhanced T1-weighted MR images were obtained during the (a) arterial phase, (b) portal venous phase, and (c) hepatobiliary phase (HBP). Three-dimensional segmentation of MR HBP images of HCC was performed using 3D-slicer (d). The HCC was pathologically accessed as negative microvascular invasion, positive capsule formation with underlying hepatitis B-related cirrhosis. The HCC was classified as a low-risk group in the clinicopathologic prognostic model, but it was classified as a high-risk group in the radiomic model and combined clinicopathologic-radiomic model for early recurrence. The HCC showed poor prognosis in that it recurred in 20 months after surgery.
- 23 -
In the CCR model, we obtained the optimal cutoff for differentiating
the high-risk group and the low-risk group based on the hazard function 21 for
the training data set (log-rank test, P < 0.001, Figure 5). When the validation set was stratified into high- and low-risk groups, the survival curves showed statistically significant difference between the two groups (P = 0.031) in the validation set (Figure 5). Meanwhile, the survival curves were significantly different in the training data for the clinicopathologic model (P < 0.001) or radiomic model (P < 0.001). However, the survival curves of the high- and low-risk groups were not significantly different in the validation set in these two models.
The interobserver reproducibility of the radiomic feature extraction showed high ICC values (median 0.991, range 0.813-0.999 for the model with 3 mm border extension; Table 5, Figure 6).
- 24 -
Figure 5. Combined clinicopathologic-radiomic model for predicting disease-free survival in early postoperative period (<2 years) in patients with 2-5 cm HCCs.
- 25 -
Kaplan-Meier estimates of disease-free survival (DFS) and prediction curves of the combined clinicopathologic-radiomic model (CCR) for DFS in the training set (a, b) and the validation set (c, d). The validation cohort stratified into a low- and a high-risk group based on a cut-off value determined on the training cohort. A significant patient stratification was shown (P = 0.031) with high predictive performance (c-index: 0.716). In the training cohort, recurrences occurred in 22/29 patients in the high-risk group and 3/99 patients in the low-risk group. In the validation cohort, recurrences occurred in 4/10 patients in the high-risk group and 3/29 patients in the low-risk group.
- 26 -
Table 5. Selected radiomic features for 2-5 cm HCCs with 3 mm border extension
Selected Features ICC ICC CI
[1] wavelet.HHL_glszm_GrayLevelNonUniformityNor malized 0.988 0.975, 0.994 [2] meta_wavelet.HHH_glszm_ZoneVariance 0.813 0.646, 0.906 wavelet.HHH_glszm_SmallAreaLowGrayLe velEmphasis wavelet.HHH_glszm_ZoneVariance [3] meta_log.sigma.1.0.mm.3D_glcm_Correlation 0.996 0.992, 0.998 log.sigma.1.0.mm.3D_glcm_Correlation log.sigma.1.0.mm.3D_glcm_Imc2 [4]meta_log.sigma.5.0.mm.3D_glszm_SizeZoneNon UniformityNormalized.1 0.825 0.667, 0.912 log.sigma.5.0.mm.3D_glszm_SizeZoneNon UniformityNormalized.1 log.sigma.5.0.mm.3D_glszm_SmallAreaEm phasis.1 [5] meta_log.sigma.2.0.mm.3D_glcm_Imc2.1 0.994 0.988, 0.997 log.sigma.2.0.mm.3D_glcm_Correlation.1 log.sigma.2.0.mm.3D_glcm_Imc2.1 [6] log.sigma.1.0.mm.3D_glcm_InverseVariance 0.999 0.998, 0.999 [7] wavelet.HHL_glszm_SizeZoneNonUniformityNorm alized.1 0.911 0.822, 0.956 [8] meta_log.sigma.4.0.mm.3D_glcm_Correlation.2 0.997 0.995, 0.999 log.sigma.4.0.mm.3D_glcm_Correlation.2 log.sigma.4.0.mm.3D_glcm_Imc2.2 log.sigma.5.0.mm.3D_glcm_Correlation.2 log.sigma.5.0.mm.3D_glcm_Imc2.2
Note. ICC, intraclass correlation coefficient; CI, confidence interval
The prefix meta- means that the feature is the representative feature selected in the clustered feature group.
- 27 -
Figure 6. The order of importance of the selected features according to the minimum depth order of the random survival forest.
IV. DISCUSSION
In the present study, we developed and validated a radiomic model and CCR model using preoperative gadoxetic acid-enhanced MRI for individualized prediction of DFS in patients with HCC. Our results demonstrated that radiomic model with appropriate border extension using preoperative MRI showed comparable performance to the postoperative clinicopathologic model for predicting DFS of early recurrence. This result supports the clinical importance of using radiomics for preoperative clinical decision-making before the surgical pathology report in patients with HCC. More refined and personalized radiomic model using machine learning may improve the performance of prognostication of each patient with HCC. In addition, we developed a radiomic model using gadoxetic acid-enhanced multi-phase MRI data to reflect the nature of tumor perfusion and the hepatic uptake function. The suggested optimal forms of the input data for radiomic model in the present study could be the basis for future research in HCC.
- 28 -
The present study demonstrated the preoperative usefulness of radiomic features for predicting early recurrence of HCC. Multiple tumors, microscopic vascular invasion, serosal invasion, tumor markers, Milan criteria, positive surgical margin, and nonanatomic resection are known clinicopathologic factors that affect early recurrence 27-29. Imaging features, such
as peritumoral enhancement, peritumoral hypointensity, irregular tumor margin, and arterial rim enhancement, are also associated with the early recurrence of HCC 30,31. In previous studies, most preoperative imaging prognostic factors,
which are generally subjective criteria by the observers, were reported to be correlated with postoperative histopathologic factors. However, in the present study, we observed that preoperative radiomic features showed comparable prognostic performance to that of postoperative clinicopathologic data. It is meaningful in clinical practice in several aspects. It is helpful in predicting prognosis and determining management plan in patients without histology. It is objective compared to image interpretation which depends on observer's subjectivity. In addition, the radiomic model may be useful for prognostic prediction after surgical histology is obtained to compensate for the pathologic report. This may be explained by the fact that radiomic features were derived by mathematical equations, which could capture histopathologic characteristics and gross morphologic features. Moreover, in vivo radiomics can analyze the entire tumor thoroughly in three dimensions, indicating that comparable or more information could be obtained compared with pathologic examination in which only small tissues are sampled and assessed. In this study, we did not observe an additional value of the radiomic model compared with that of the clinicopathologic model, but further study is required because the importance of radiomic features incorporated with clinicopathologic data has been reported in several oncologic studies 13,32.
For the prognostic performance of late recurrence, the radiomics model did not show statistically significant difference from the clinical model, but the
- 29 -
clinical usefulness of the radiomic model was low. Recurrence of HCC was speculated to be caused by either metastasis of primary tumor or metachronous multicentric occurrence in the underlying liver disease. Several studies have reported that early recurrence is due to primary tumor metastasis and late recurrence is due to multicentric occurrence 9,33. In late recurrence, only liver
cirrhosis has been reported as an independent factor 8,9. Consistent with the
previous studies, the only independent clinicopathologic factor of the late recurrence in our study was liver cirrhosis. Although the radiomic model did not show a significant difference with the clinicopathologic model, the only independent factor, liver cirrhosis, can be assessed before surgery more easily than with the radiomic model. Therefore, the clinical usefulness of the radiomic model is limited for the predicting late recurrence.
We found that the peritumoral change had a significant effect on DFS through radiomics. The predictability of DFS increased when a peritumoral area of 3 mm diameter was included in the radiomic analysis. Our results are in good agreement with those reported in previous studies, which suggested that arterial peritumoral enhancement, non-smooth tumor margin, and peritumoral hypointensity on HBP are independent predictors of MVI, which is a potent
prognostic factor of HCC 30,31. All these suggested prognostic findings are
presented in the peritumoral area. However, most previous oncologic radiomic studies did not consider the peritumoral area as a potential prognostic factor, because only the tumors were segmented 13,32,34. In the present study, the
radiomic model showed a prognostic performance comparable to that of the clinicopathologic model only for 3 mm border extension, in which the highest prognostic performance was observed. This result indicates that appropriate border extension is required to achieve performance comparable to the clinicopathologic model. The radiomic model with 5 mm border extension showed lower prognostic performance than the clinicopathologic model. This may be due to the known nature of the distribution of microsatellites in HCC. A
- 30 -
microsatellite is defined as a pathologically microscopic invasion into the portal vein and/or intrahepatic metastasis. The number of microsatellites is known to decrease with distance from the primary HCC and increase with the primary tumor size 35-37. Therefore, it is possible that the 5 mm border extension may
have reduced prognostic performance due to the decrease in the number of microsatellites in the farther peritumoral area and inclusion of the peritumoral normal hepatic parenchyma. This suggested that proper border extensions may contribute to predictability.
Technically, a distinct tumoral boundary in HBP of gadoxetic acid-enhanced MRI enabled the border extension with high reproducibility. Segmentation is critical for radiomics because the subsequent feature data are generated from the segmented volumes. However, it is also challenging because
tumors may have indistinct borders 12. In a previous radiomic study, HCC
border segmentation was performed based on morphological or perfusional difference in AP or PP of CT scan manually 13. However, in our experience,
distinguishing between tumor itself and peritumoral change is difficult because of the indistinct border. We believe that our method could be an easy solution to better segmentation in MRI. By defining clear boundaries, we could analyze the various diameters of the peritumoral area, resulting in prognostic potential of morphologic changes within 3 mm of the peritumoral area. Moreover, the prediction of DFS showed the highest performance when all three dynamic phase images were used among all the possible combinations of three phases. Various prognostic imaging features, such as peritumoral enhancement or rim enhancement in AP, irregular or non-smooth tumor margin, and peritumoral hypointensity in HBP, have been demonstrated in different dynamic phases
30,31,38-41. Therefore, all three phases seem to be necessary to reflect all of these
image features. Our result suggests that a multiparametric approach is required for postoperative prognostic analysis of HCC using MRI and should include at least 3 dynamic phases.
- 31 -
This study has several limitations. First, it has a limited sample size of 167 patients. Radiomic features were basically high-dimensional data, and machine learning-based random forest was used; thus, there was a risk of overfitting. Therefore, parameter optimization was performed using the nested 5-fold cross-validation of the two different methodologies (logrank, maxstat) to achieve the generalized model. The prediction model was validated with a temporally independent validation set using bootstrap resampling (n = 1000) of training set for an objective evaluation of the model. Second, semi-automatic region of interest placement can be a limiting factor because interobserver variability is known to affect the result 42. However, because we used HBP
images in gadoxetic acid-enhanced MRI for segmentation, high interobserver reproducibility could be achieved. Third, only HBP-hypointense HCCs were included (excluding iso-/hyperintense HCCs) for clear delineation of the HCCs in HBP. However, only a small proportion of HCCs may show iso to
hyperintensity on HBP and they are known to have good prognosis 43,44. Fourth,
we performed SI normalization and voxel size resampling prior to radiomics feature extraction for quantitative comparison of images between different MRI machines and patients, but did not have access to how this process affects the results. However, recent CT radiomics studies have reported that using gray level normalization and voxel size resampling greatly reduced the dependency of differences in scanners and CT parameters 45-47. It is presumed that these
preprocesses would be effective for MRI, but further study is needed. Fifth, the training and validation cohorts were temporally disjoint and may cause problems if there were temporal changes in image acquisition or patient characteristics. However, this study was performed without any changes in the MRI unit or the image acquisition protocol between the training cohort and the validation cohort. No statistically significant difference was found in the clinical conditions between the training cohort and the validation cohort except for PIVKA-II (Table 1). PIVKA-II is a tumor marker associated with the diagnosis
- 32 -
of HCC, but there is no evidence that it affects the prognosis 30,31. In addition, it
is known that temporal validation is better than random split according to the
TRIPOD statement 48.
V. CONCLUSION
In conclusion, the prognostic value of the preoperative radiomic model with 3 mm border extension showed comparable performance to that of the postoperative clinicopathologic model for predicting DFS of early recurrence of HCC using gadoxetic acid-enhanced MRI. This suggests the importance of including peritumoral changes in the radiomic analysis of HCC.
- 33 -
REFERENCES
1. Hwang S, Lee YJ, Kim KH, Ahn CS, Moon DB, Ha TY, et al. The
Impact of Tumor Size on Long-Term Survival Outcomes After Resection of Solitary Hepatocellular Carcinoma: Single-Institution Experience with 2558 Patients. J Gastrointest Surg 2015;19:1281-90.
2. Wong TC, Lo CM. Resection strategies for hepatocellular carcinoma.
Semin Liver Dis 2013;33:273-81.
3. Cha C, Fong Y, Jarnagin WR, Blumgart LH, DeMatteo RP. Predictors
and patterns of recurrence after resection of hepatocellular carcinoma. J Am Coll Surg 2003;197:753-8.
4. Raza A, Sood GK. Hepatocellular carcinoma review: Current treatment,
and evidence-based medicine. World J Gastroenterol 2014;20:4115-27.
5. Balogh J, Victor D, Asham EH, Burroughs SG, Boktour M, Saharia A,
et al. Hepatocellular carcinoma: a review. J Hepatocell Carcinoma 2016;3:41-53.
6. Chen PJ, Chen DS, Lai MY, Chang MH, Huang GT, Yang PM, et al.
Clonal origin of recurrent hepatocellular carcinomas. Gastroenterology 1989;96:527-9.
7. Ng IO, Guan XY, Poon RT, Fan ST, Lee JM. Determination of the
molecular relationship between multiple tumour nodules in hepatocellular carcinoma differentiates multicentric origin from intrahepatic metastasis. J Pathol 2003;199:345-53.
8. Portolani N, Coniglio A, Ghidoni S, Giovanelli M, Benetti A, Tiberio
GAM, et al. Early and late recurrence after liver resection for hepatocellular carcinoma: prognostic and therapeutic implications. Annals of surgery 2006;243:229.
9. Yamamoto Y, Ikoma H, Morimura R, Konishi H, Murayama Y,
Komatsu S, et al. Optimal duration of the early and late recurrence of hepatocellular carcinoma after hepatectomy. World Journal of
- 34 -
Gastroenterology: WJG 2015;21:1207.
10. Cheng Z, Yang P, Qu S, Zhou J, Yang J, Yang X, et al. Risk factors and
management for early and late intrahepatic recurrence of solitary hepatocellular carcinoma after curative resection. HPB (Oxford) 2015;17:422-7.
11. Aerts HJ, Velazquez ER, Leijenaar RT, Parmar C, Grossmann P,
Carvalho S, et al. Decoding tumour phenotype by noninvasive imaging using a quantitative radiomics approach. Nat Commun 2014;5:4006.
12. Gillies RJ, Kinahan PE, Hricak H. Radiomics: images are more than
pictures, they are data. Radiology 2015;278:563-77.
13. Zhou Y, He L, Huang Y, Chen S, Wu P, Ye W, et al. CT-based radiomics
signature: a potential biomarker for preoperative prediction of early recurrence in hepatocellular carcinoma. Abdominal Radiology 2017;42:1695-704.
14. Kim BK, Han KH, Park YN, Park MS, Kim KS, Choi JS, et al.
Prediction of microvascular invasion before curative resection of hepatocellular carcinoma. J Surg Oncol 2008;97:246-52.
15. Kaibori M, Ishizaki M, Matsui K, Kwon AH. Predictors of
microvascular invasion before hepatectomy for hepatocellular carcinoma. J Surg Oncol 2010;102:462-8.
16. Shindoh J, Andreou A, Aloia TA, Zimmitti G, Lauwers GY, Laurent A,
et al. Microvascular invasion does not predict long-term survival in hepatocellular carcinoma up to 2 cm: reappraisal of the staging system for solitary tumors. Ann Surg Oncol 2013;20:1223-9.
17. Fedorov A, Beichel R, Kalpathy-Cramer J, Finet J, Fillion-Robin JC,
Pujol S, et al. 3D Slicer as an image computing platform for the Quantitative Imaging Network. Magn Reson Imaging 2012;30:1323-41.
18. van Griethuysen JJM, Fedorov A, Parmar C, Hosny A, Aucoin N,
- 35 -
Radiographic Phenotype. Cancer Res 2017;77:e104-e7.
19. Ishwaran H, Kogalur UB, Gorodeski EZ, Minn AJ, Lauer MS.
High-Dimensional Variable Selection for Survival Data. Journal of the American Statistical Association 2010;105:205-17.
20. Ishwaran H, Kogalur UB, Chen X, Minn AJ. Random survival forests
for high‐dimensional data. Statistical Analysis and Data Mining: The ASA Data Science Journal 2011;4:115-32.
21. Ishwaran H, Kogalur UB, Blackstone EH, Lauer MS. Random survival
forests. Ann. Appl. Stat. 2008;2:841-60.
22. Wright MN, Dankowski T, Ziegler A. Unbiased split variable selection
for random survival forests using maximally selected rank statistics. Stat Med 2017;36:1272-84.
23. Leger S, Zwanenburg A, Pilz K, Lohaus F, Linge A, Zophel K, et al. A
comparative study of machine learning methods for time-to-event survival data for radiomics risk modelling. Sci Rep 2017;7:13206.
24. Harrell FE, Jr., Lee KL, Mark DB. Multivariable prognostic models:
issues in developing models, evaluating assumptions and adequacy, and measuring and reducing errors. Stat Med 1996;15:361-87.
25. Efron B, Tibshirani R. An introduction to the bootstrap. New York:
Chapman & Hall; 1993.
26. Landis JR, Koch GG. The measurement of observer agreement for
categorical data. Biometrics 1977;33:159-74.
27. Hayashi M, Shimizu T, Hirokawa F, Inoue Y, Komeda K, Asakuma M,
et al. Clinicopathological risk factors for recurrence within one year after initial hepatectomy for hepatocellular carcinoma. Am Surg 2011;77:572-8.
28. Shah SA, Greig PD, Gallinger S, Cattral MS, Dixon E, Kim RD, et al.
Factors associated with early recurrence after resection for hepatocellular carcinoma and outcomes. J Am Coll Surg
- 36 -
2006;202:275-83.
29. Imamura H, Matsuyama Y, Tanaka E, Ohkubo T, Hasegawa K,
Miyagawa S, et al. Risk factors contributing to early and late phase intrahepatic recurrence of hepatocellular carcinoma after hepatectomy. J Hepatol 2003;38:200-7.
30. An C, Kim DW, Park YN, Chung YE, Rhee H, Kim MJ. Single
Hepatocellular Carcinoma: Preoperative MR Imaging to Predict Early Recurrence after Curative Resection. Radiology 2015;276:433-43.
31. Lee S, Kim SH, Lee JE, Sinn DH, Park CK. Preoperative gadoxetic
acid-enhanced MRI for predicting microvascular invasion in patients with single hepatocellular carcinoma. J Hepatol 2017;67:526-34.
32. Huang Y, Liu Z, He L, Chen X, Pan D, Ma Z, et al. Radiomics
Signature: A Potential Biomarker for the Prediction of Disease-Free Survival in Early-Stage (I or II) Non-Small Cell Lung Cancer. Radiology 2016;281:947-57.
33. Poon RT. Differentiating early and late recurrences after resection of
HCC in cirrhotic patients: implications on surveillance, prevention, and treatment strategies. Annals of surgical oncology 2009;16:792.
34. Wu J, Aguilera T, Shultz D, Gudur M, Rubin DL, Loo BW, Jr., et al.
Early-Stage Non-Small Cell Lung Cancer: Quantitative Imaging Characteristics of (18)F Fluorodeoxyglucose PET/CT Allow Prediction of Distant Metastasis. Radiology 2016;281:270-8.
35. Sasaki A, Kai S, Iwashita Y, Hirano S, Ohta M, Kitano S. Microsatellite
distribution and indication for locoregional therapy in small hepatocellular carcinoma. Cancer 2005;103:299-306.
36. Pawlik TM, Delman KA, Vauthey JN, Nagorney DM, Ng IO, Ikai I, et
al. Tumor size predicts vascular invasion and histologic grade: Implications for selection of surgical treatment for hepatocellular carcinoma. Liver Transpl 2005;11:1086-92.
- 37 -
37. Shi M, Zhang CQ, Zhang YQ, Liang XM, Li JQ. Micrometastases of
solitary hepatocellular carcinoma and appropriate resection margin. World J Surg 2004;28:376-81.
38. Kim H, Park MS, Choi JY, Park YN, Kim MJ, Kim KS, et al. Can
microvessel invasion of hepatocellular carcinoma be predicted by pre-operative MRI? Eur Radiol 2009;19:1744-51.
39. Kim KA, Kim MJ, Jeon HM, Kim KS, Choi JS, Ahn SH, et al.
Prediction of microvascular invasion of hepatocellular carcinoma: usefulness of peritumoral hypointensity seen on gadoxetate disodium-enhanced hepatobiliary phase images. J Magn Reson Imaging 2012;35:629-34.
40. Ariizumi S, Kitagawa K, Kotera Y, Takahashi Y, Katagiri S, Kuwatsuru
R, et al. A non-smooth tumor margin in the hepatobiliary phase of gadoxetic acid disodium (Gd-EOB-DTPA)-enhanced magnetic resonance imaging predicts microscopic portal vein invasion, intrahepatic metastasis, and early recurrence after hepatectomy in patients with hepatocellular carcinoma. J Hepatobiliary Pancreat Sci 2011;18:575-85.
41. Kawamura Y, Ikeda K, Seko Y, Hosaka T, Kobayashi M, Saitoh S, et al.
Heterogeneous type 4 enhancement of hepatocellular carcinoma on dynamic CT is associated with tumor recurrence after radiofrequency ablation. AJR Am J Roentgenol 2011;197:W665-73.
42. Lambregts DMJ, Beets GL, Maas M, Curvo-Semedo L, Kessels AGH,
Thywissen T, et al. Tumour ADC measurements in rectal cancer: effect of ROI methods on ADC values and interobserver variability. European Radiology 2011;21:2567-74.
43. Kitao A, Matsui O, Yoneda N, Kozaka K, Kobayashi S, Koda W, et al.
Hypervascular hepatocellular carcinoma: correlation between biologic features and signal intensity on gadoxetic acid-enhanced MR images.
- 38 -
Radiology 2012;265:780-9.
44. Choi JW, Lee JM, Kim SJ, Yoon JH, Baek JH, Han JK, et al.
Hepatocellular carcinoma: imaging patterns on gadoxetic acid-enhanced MR Images and their value as an imaging biomarker. Radiology 2013;267:776-86.
45. Shafiq-Ul-Hassan M, Zhang GG, Latifi K, Ullah G, Hunt DC,
Balagurunathan Y, et al. Intrinsic dependencies of CT radiomic features on voxel size and number of gray levels. Med Phys 2017;44:1050-62.
46. Shafiq-Ul-Hassan M, Latifi K, Zhang G, Ullah G, Gillies R, Moros E.
Voxel size and gray level normalization of CT radiomic features in lung cancer. Sci Rep 2018;8:10545.
47. Larue R, van Timmeren JE, de Jong EEC, Feliciani G, Leijenaar RTH,
Schreurs WMJ, et al. Influence of gray level discretization on radiomic feature stability for different CT scanners, tube currents and slice thicknesses: a comprehensive phantom study. Acta Oncol 2017;56:1544-53.
48. Moons KGM, Altman DG, Reitsma JB, Ioannidis JPA, Macaskill P,
Steyerberg EW, et al. Transparent Reporting of a multivariable prediction model for Individual Prognosis Or Diagnosis (TRIPOD): Explanation and ElaborationThe TRIPOD Statement: Explanation and Elaboration. Annals of Internal Medicine 2015;162:W1-W73.
- 39 -
APPENDICES
Appendix 1. Magnetic resonance image Acquisition parameters Acquisition Sequence Scanner Trade Name (Field Strength) Matri x Size Sectio n Thick ness (mm) Inters ection Gap (mm) Repet ition Time (msec ) Echo Time (msec ) Flip Angle (°) Dual–echo T1–weighte d gradient–re called-echo Magnetom Trio Tim (3T) 256ⅹ1 92 3 0.6 4 2.46 and 1.23 9 Intera Achieva (3T) 160ⅹ1 60 5 1 219 2.3 and 1.1 20 Intera Achieva (1.5T) 288ⅹ2 31 7 0.7 189 4.6 and 2.3 80 Discovery MR750w (3T) 320ⅹ2 50 4 1 4.9 2.3 and 1.1 10 T1–weighte d 3D gradient–ec ho with dynamic contrast enhanceme nt† Magnetom Trio Tim (3T) 256ⅹ1 92 2 0.4 2.54 0.95 13 Intera Achieva (3T) 256ⅹ2 20 2 0 3 1.42 10 Intera Achieva (1.5T) 256ⅹ1 66 4 0 4.2 2.0 10 Discovery MR750w (3T) 224ⅹ1 92 2.5 0 190 1.2–4. 7 10 T2–weighte d turbo spin-echo, navigator–tr iggered Magnetom Trio Tim (3T) 320ⅹ1 68 2 0.4 2.54 0.95 140 Intera Achieva (3T) 288ⅹ1 92 5 1 988 80 90 Intera Achieva (1.5T) 288ⅹ2 28 7 0 452 80 90 Discovery MR750w 320ⅹ3 20 4 1 4286 73 15
- 40 - (3T) Diffusion– weighted imaging Magnetom Trio Tim (3T) 128ⅹ9 6 5 1 5200 67 90 Intera Achieva (3T) 288ⅹ1 92 5 1 8500 57 90 Intera Achieva (1.5T) 112ⅹ1 44 7 1 1600 62 90 Discovery MR750w (3T) 96ⅹ12 8 4 1 5800 62 90
† The arterial phase began 2 or 3 seconds after the peak aortic enhancement was determined with the bolus injection; subsequent dynamic images were obtained at intervals of approximately 30 seconds. Each dynamic image acquisition required 18–24 seconds. Hepatobiliary images were obtained 15 or 20 minutes after injection of the contrast material by using the same imaging sequence as that used for the pre- and postcontrast images.
Appendix 2. Detailed methods of radiomic analysis
A. Data acquisition, image segmentation, and preprocessing
In the preoperative gadoxetic acid contrast-enhanced dynamic liver, MRI, AP, PP, and HBP images were downloaded in a Digital Imaging and Communications in Medicine format, and registration was performed on the three phases using 3D slicer (www.slicer.org). Voxels in each MR image volume
were resampled to an isotropic voxel size of 1.0 × 1.0 × 1.0 mm3 to minimize
the effects of different MR imaging conditions, such as pixel spacings and slice thicknesses. Semi-automatic 3-dimensional segmentation of tumor was performed in HBP images using FastGrowCut effect of 3D slicer, and the generated mask was commonly used for AP, PP, and HBP images. The 3D mask of tumor drawn on the HBP-hypointense area expanded the 3 mm and 5 mm radially outwards using the dilate effect of the 3D slicer. Consequently, three
- 41 -
kinds of 3D masks were created according to the extended length of the tumor (0 mm, 3 mm, and 5 mm). This process is called tumor border extension and is essential for extracting the radiomic features of the peritumoral area.
B. Radiomic feature extraction
MRI signal intensity normalization and feature extraction were performed using PyRadiomics (Computational Imaging and Bioinformatics Lab, Harvard Medical School). PyRadiomics enabled the normalization of image intensity values prior to feeding them to the feature extraction pipeline. Normalization centered the image at the mean with standard deviation. Normalization is based on the all gray values contained within the image, not just those defined by the volume of interest (VOI) in the mask.
Where:
- x and f(x) are the original and normalized intensity, respectively.
- μx and σx are the mean and standard deviation of the image intensity values. - s is a scaling factor. s was set to 100 in this study.
In addition, outliers were removed, in which case values for which x > μx + 3σx or x < μx - 3σx were set to μx + 3σx and μx - 3σx, respectively. Removal of outliers was done after the values of the image were normalized, but before scale was applied. Then, all voxel values were shifted by 300 to ensure that all voxels had positive values. For gray value discretization, bin width was set to 5, which means the number of bins was set to 600 / 5 = 125. All the processes about normalization and gray value discretization were performed using PyRadiomics.
Extracted feature classes consisted of the first-order features, shape features, the second-order features, and two high order filters — Laplacian of Gaussian (LoG) and Wavelet filter.
- 42 -
First-order statistics described the distribution of voxel intensities within the image region defined by the mask through commonly used and basic metrics. The second-order features consisted of Gray Level Co-occurrence Matrix (GLCM) Features, Gray Level Size Zone Matrix (GLSZM) Features, Gray Level Run Length Matrix (GLRLM) Features, Neighboring Gray Tone Difference Matrix (NGTDM) Features, and Gray Level Dependence Matrix (GLDM) Features.
Applied filter classes were Laplacian of Gaussian (LoG) and Wavelet filter. LoG filter is an edge enhancement filter, which emphasizes areas of gray level change, where sigma defines how coarse the emphasized texture should be. A low sigma emphasis on fine textures (change over a short distance), where a high sigma value emphasizes coarse textures (gray level change over a large distance). Five sigma values were used in this study (1 mm, 2 mm, 3 mm, 4 mm, and 5 mm). Wavelet filtering yields 8 decompositions per level (all possible combinations of applying either a high or a low pass filter in each of the three dimensions).
The following were extracted from the lesion: 13 shape features, 18 first-order features, 74 second-order features with LoG filters with 5 sigmas, and 8 combinations of wavelet filter. This led to 1301 features for one phase and 3903 features for all three dynamic phases in total. Radiomic features were extracted for each combination of AP, PP, and HBP phases and for each border extension of 0 mm, 3 mm, and 5 mm, respectively.
C. Radiomic feature normalization and feature clustering
All features were normalized on the training cohort using z-score normalization. The resulting scale and shift constants used in the z-score normalization process were saved and then applied to the feature normalization of the independent validation cohort. After normalization, hierarchical feature clustering was performed on the training cohort using Spearman correlation