External validation of
recurrence predicting nomogram for
early gastric cancer after curative resection
Joo Hoon Kim
Department of Medicine
External validation of
recurrence predicting nomogram for
early gastric cancer after curative resection
Directed by Professor Sun Young Rha
The Master's Thesis
submitted to the Department of Medicine,
the Graduate School of Yonsei University
in partial fulfillment of the requirements for the degree
of Master of Medical Science
Joo Hoon Kim
June 2010
This certifies that the Master's Thesis of
Joo Hoon Kim is approved.
Thesis Supervisor: Sun Young Rha
Thesis Committee Member: Chung Mo Nam
Thesis Committee Member: Ki Yeol Kim
The Graduate School
Yonsei University
ACKNOWLEDGEMENTS
First of all, I really appreciate my thesis supervisor, professor
Sun Young Rha, for her supervision and encouragement to
study this subject. Thanks to Professor Rha, I had this great
opportunity to experience the glimpse of this study.
I also want to appreciate professors Chung Mo Nam and Ki
Yeol Kim who gave me experienced advices and warm
supports.
I am especially grateful to my family members, especially my
parents and sister, they have been always by my side and
tolerated the years of my study with patience. I give my love
and admiration to them.
<TABLE OF CONTENTS>
ABSTRACT ··· 1
I. INTRODUCTION ··· 3
II. MATERIALS AND METHODS ··· 6
1. Patients ··· 6
2. Definitions ··· 6
3. Data analysis ··· 7
III. RESULTS ··· 10
1. Patients characteristics ··· 10
2. Nomogram validation ··· 14
IV. DISCUSSION ··· 18
V. CONCLUSION ··· 20
REFERENCES ··· 21
ABSTRACT(IN KOREAN) ··· 23
LIST OF FIGURES
Figure 1. Nomogram for recurrence prediction of early gastric
cancer ··· 5
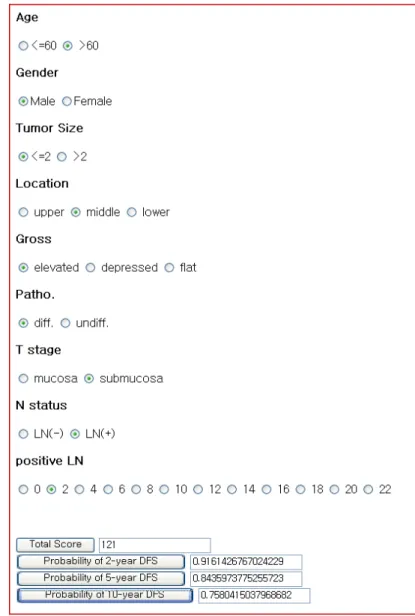
Figure 2. The EGC nomogram available in HTML format ··· 9
Figure 3. Distribution of nomogram score between Nomogram
development set and External validation set ··· 12
Figure 4. A receiver operating characteristic (ROC) curve
assessing the discrimination of the nomogram ··· 14
Figure 5. Comparison of Kaplan-Meier DFS curve of patients
stratified into three risk groups depending on their total number
of points ··· 17
LIST OF TABLES
Table 1. Descriptive Statistics for EGC Patient Cohorts from
Nomogram development set and External validation set ··· 11
Table 2. Comparison between no recurrence group and
recurrence group in external validation set ··· 13
Table 3. Stratified into three risk groups depending on their
1
ABSTRACT
External validation of recurrence predicting nomogram for early
gastric cancer after curative resection
Joo Hoon Kim
Department of Medicine
The Graduate School, Yonsei University
(Directed by Professor Sun Young Rha)
Purpose :
Nomograms are statistically based tools that provide the overall probability of a specific outcome. In our previous study, nomogram whichpredict recurrence of EGC after curative resection was developed on the basis of the Cox regression. We performed this study to externally validate our previous EGC nomogram.
Methods:
Our previous EGC nomogram was established from a retrospective EGC database that included 2923 consecutive patients at Severance Hospital, Yonsei University between January 1987 and April 2005. This nomogram was externally validated by an independent 930 patients cohort who were retrospectively included between May 2005 and April 2007. Nomogram external validation consisted of discrimination and calibration.Results:
A total of 11 patients (1.1%) experienced recurrence, and 4 (36.4%) out of them recurred within 2 years after surgery. With the median 37 months of follow up, median time to recurrence was 26.4 months and the mean score estimated predicting recurrence by the nomogram was 203.7 (SD 32.7). The concordance index (c-index) was 0.7 (p=0.02) and the result of overall C index2
was 0.82 (p=0.006, 95% CI 0.59-1.00). The goodness of fit test showed that the EGC nomogram had significantly good fit at 1- and 2-year survival interval (p=0.998 and 0.879, respectively). The predictions derived from the EGC nomogram were then divided into three groups depending on their points: high risk (less than 170 points, n=102), intermediate risk (170-208 points, n=427), low risk (more than 208 points, n=401). A Kaplan-Meier DFS curve among these three subgroups showed a significant difference (p=0.001).
Conclusion:
Preexisting nomogram for predicting recurrence-free survival of EGC after surgery was externally validated. It is useful for accurate and individual prediction of disease-free survival, patient prognostication, counseling and follow-up planning.---
Key words : early gastric cancer, nomogram, external validation
3
External validation of recurrence predicting nomogram for early
gastric cancer after curative resection
Joo Hoon Kim
Department of Medicine
The Graduate School, Yonsei University
(Directed by Professor Sun Young Rha)
I. INTRODUCTION
Early gastric cancer (EGC) has been defined as an adenocarcinoma confined to the mucosa or submucosa, regardless of the size or presence of lymph node metastasis. Recent developments in diagnosis and the introduction of the national mass screening programs have allowed increased detection of early gastric cancer, and these patients account for 40–50% of operations carried out for gastric carcinoma in Japan and Korea.1,2 Patients with EGC generally have
an excellent prognosis after curative resection (R0); 5-year survival rates have been reported to be approximately 90%. However, recurrence can occur after curative resection of EGC; with the recurrence rate of 1.4–7.0%.3-8 Some
studies have evaluated the independent risk factors for recurrence of EGC, but the number of patients with recurrence in these studies was too small to provide reliable results.6-9 Especially, the prediction of recurrence of EGC after R0
resection has not been studied.
Nomograms are statistically based tools that provide the overall probability of a specific outcome.10 In clinical practice, it is important to predict prognosis to
decide the further treatment plan or follow-up duration. Nomograms, which could incorporate more clinicopathologic parameters than the staging system
4
reflecting not only the tumor but also the host status, can allow the clinician to achieve a better estimation of the prognosis of an individual patient. Another potential benefit of nomogram is that it creates a simple graphical representation of a statistical predictive model that generates a numerical probability of a clinical event. But, one should be cautious about extrapolating from regression models built on different populations. Because a nomogram derived from one population may not be applicable to a new population. Therefore, external validation is essential to assure that the nomogram is universally applicable in practice.
We attempted to identify independent risk factors for predicting recurrence of EGC after curative resection. According to results of our previous study11, elevated gross type and presence of lymph node metastasis were shown to be independent risk factors for overall recurrence. On the basis of findings from this study for EGC, our institution developed a nomogram which estimates the disease-specific survival rate of each patient at 2-, 5- and 10- years after after curative resection for EGC (Figure 1). This EGC nomogram was found to be accurate by internal validation in the same cohort. However, external validation of this nomogram needs to be performed for it to be applied as standard care. This validation should be performed using another independent data set. Therefore, the aim of the present study was to externally validate this EGC nomogram in patients from another independent data set.
5
Figure 1. Nomogram for recurrence prediction of early gastric cancer.
Find the position of each variable on the corresponding axis, draw a line to the ‘Points’ axis for the number of points, add the points from all the variables together and draw a line from the ‘Total points’ axis to determine the survival probabilities at the bottom, assuming no death from other causes. DFS, disease-free survival
6
II. MATERIALS AND METHODS
1. Patients
Patients cohort from the EGC database at the Department of Surgery, and Gastric Cancer Clinic, Yonsei University Health System (YUHS) in Seoul, Korea, was used to evaluate validity of the EGC nomogram. Between May 2005 and April 2007, a consecutive series of 1058 patients with EGC who underwent curative resection at the Severance hospital, Yonsei University Health System, Seoul, Korea, were retrospectively reviewed.
2. Definitions
The variables required for the EGC nomogram were age, gender, tumour size, location, gross type, histological differentiation, depth of invasion, lymph node metastasis, number of positive nodes. By using these clinicopathogic factors, the practical use of EGC nomogram is available in the HTML (Hyper Text Markup Language) format shown in Figure 2.
The standard operation for EGC was a total or subtotal gastrectomy with D2 lymph node dissection in accordance with the rules of the Japanese Research Society for Gastric Cancer (JRSGC). Curative resection was defined as no tumor remaining after removal, both macroscopically and microscopically.
The gross appearance was classified according to JRSGC standard: type I, IIa was regarded as elevated type; IIb as flat type; and IIc, III as depressed type. A mixed type was recorded according to the type of the largest area (i.e., recoded as IIa in IIa +IIc).
The histological type was classified into two main categories: differentiated type (including papillary adenocarcinoma, well- and moderately differentiated tubular adenocarcinoma) and undifferentiated type (including poorly
7
differentiated tubular adenocarcinoma, mucinous adenocarcinoma,and signet ring cell adenocarcinoma).
After being discharged from the hospital, the patients were started on a regular follow-up program. Patients were followed-up every 3 months during the first 2 years, every 4 months during the third year, every 6 months during the fourth and fifth years, and once every year thereafter.
Recurrence was confirmed by physical findings, radiological studies, endoscopic examination with biopsy, and surgery if indicated. Disease that recurred within 24 months from the time of the operation was defined as early recurrence. Disease-free survival was defined from time of operation to time of recurrence.
3. Data analysis
The patients’ features and clinical characteristics were analyzed using the two-tailed Student’s t-test for continuous variables and χ2 test for categorical variables. Disease-free survival was estimated using the Kaplan-Meier method. Nomogram validation consisted of two activities: discrimination and calibration. First, discrimination was quantified with the concordance index (c-index). Discrimination refers to a nomogram model’s ability to correctly distinguish the two classes of outcomes. A model with good discrimination ability produces higher predicted probabilities to subjects who had events than subjects who did not have events. The area under the Receiver Operating Characteristic (ROC) curve is one of the most used measures for a model discrimination. In addition, we considered a time to event survival time model with censored observations such as the Cox regression model. Thus, we used overall C index introduced by Harrell as a natural extension of the ROC curve area to survival analysis for our nomogram discrimination.12,13 Second,
8
disease free survival with the actual survival. We used Poisson log-linear model as an approximation to the survival time model in investigating the asymptotic behavior of the statistic based on the framework of goodness of fit statistic for generalized linear models.12 In addition, another calibration measure was
performed by grouping patients according to their nomogram-predicted probabilities and then comparing the mean of the group with the observed Kaplan-Meier disease free survival estimate.
SPSS 17.0 (SPSS, Chicago, IL, USA) was used for the aforementioned statistical analyses. In all statistical analyses, a P value of 0.05 was considered significant.
9
10
III. RESULTS
1. Patient characteristics
Of 1058 patients who had undergone curative resection for EGC
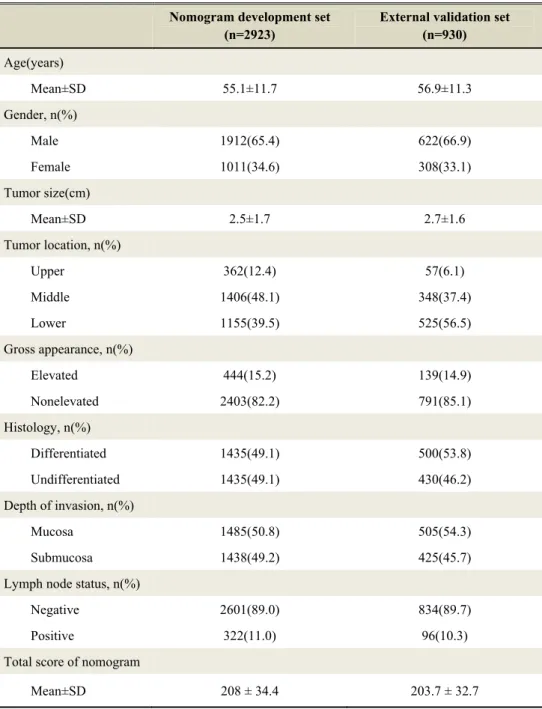
between May 2005 and April 2007, 115 (10.9%) were lost to follow-up with insufficient information. Among the remaining 943 patients, data for all the necessary variables were available for 930 patients.Descriptive statistics for the external validation data set are summarized and compared with those for the nomogram development data set in Table 1.
The differences between the two cohorts were younger age and smaller tumor size in the external validation set compared with the nomogram development set: Mean 55.1 years (SD 11.7) and 2.5 cm (SD 1.7) sized tumor in the external validation set, 56.9 years (SD 11.3) and 2.7 cm (SD 1.6) sized tumor in the nomogram development set. Another differences were the proportion of tumor location and histology. Otherwise the two cohorts were not significantly different in other clinicopathologic factors
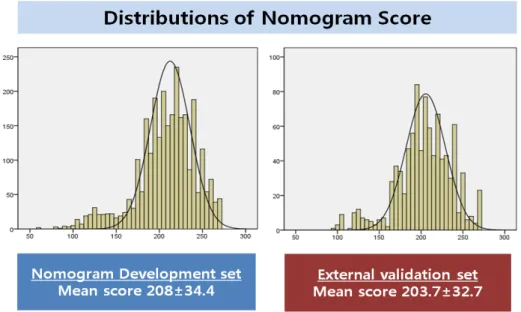
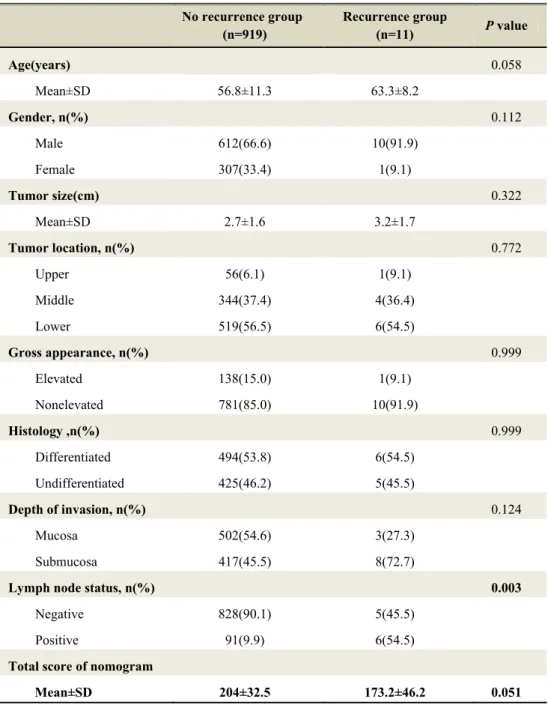
Table 2 showed comparison of characteristics between ‘no recurrence group’ and ‘recurrence group’ in external validation set. The recurrence group had a higher rate of lymph node metastasis (54.5%) compared with that (9.9%) of the No recurrence group. The difference in lymph node status between these two groups was statistically significant (p=0.003). The mean score of nomogram between these two cohorts were shown in figure 3. The mean score of nomogram in the recurrence group was lower than that in the no recurrence group. However, there was no statistically significant difference (p=0.051).
11
Table 1. Descriptive Statistics for EGC Patient Cohorts from Nomogram development set and External validation set
Nomogram development set (n=2923)
External validation set (n=930) Age(years) Mean±SD 55.1±11.7 56.9±11.3 Gender, n(%) Male 1912(65.4) 622(66.9) Female 1011(34.6) 308(33.1) Tumor size(cm) Mean±SD 2.5±1.7 2.7±1.6 Tumor location, n(%) Upper 362(12.4) 57(6.1) Middle 1406(48.1) 348(37.4) Lower 1155(39.5) 525(56.5) Gross appearance, n(%) Elevated 444(15.2) 139(14.9) Nonelevated 2403(82.2) 791(85.1) Histology, n(%) Differentiated 1435(49.1) 500(53.8) Undifferentiated 1435(49.1) 430(46.2) Depth of invasion, n(%) Mucosa 1485(50.8) 505(54.3) Submucosa 1438(49.2) 425(45.7) Lymph node status, n(%)
Negative 2601(89.0) 834(89.7) Positive 322(11.0) 96(10.3) Total score of nomogram
12
Figure 3. Distribution of nomogram score between Nomogram development set and External validation set
13
Table 2. Comparison between No Recurrence group and Recurrence group in External Validation set
No recurrence group (n=919) Recurrence group (n=11) P value Age(years) 0.058 Mean±SD 56.8±11.3 63.3±8.2 Gender, n(%) 0.112 Male 612(66.6) 10(91.9) Female 307(33.4) 1(9.1) Tumor size(cm) 0.322 Mean±SD 2.7±1.6 3.2±1.7 Tumor location, n(%) 0.772 Upper 56(6.1) 1(9.1) Middle 344(37.4) 4(36.4) Lower 519(56.5) 6(54.5) Gross appearance, n(%) 0.999 Elevated 138(15.0) 1(9.1) Nonelevated 781(85.0) 10(91.9) Histology ,n(%) 0.999 Differentiated 494(53.8) 6(54.5) Undifferentiated 425(46.2) 5(45.5) Depth of invasion, n(%) 0.124 Mucosa 502(54.6) 3(27.3) Submucosa 417(45.5) 8(72.7)
Lymph node status, n(%) 0.003
Negative 828(90.1) 5(45.5) Positive 91(9.9) 6(54.5)
Total score of nomogram
14
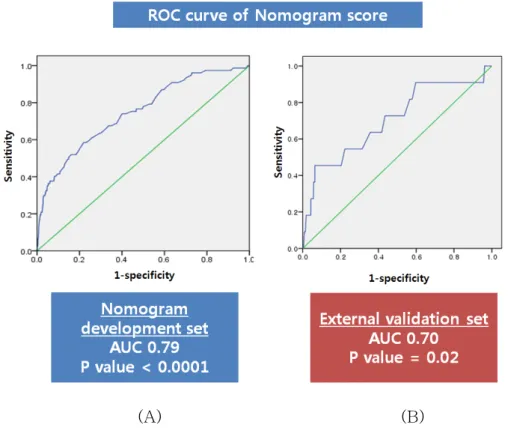
2. Nomogram validation
When applied to the external validation set, the EGC nomogram achieved a c-index of 0.70 (Figure 4). In addition, we performed further discrimination using overall C index which is extension of C statistics to survival analysis. The result of overall C index at 2-year survival interval was 0.82 (p=0.006, 95% CI 0.59-1.00).
(A) (B)
Figure 4. A receiver operating characteristic (ROC) curve assessing the discrimination of the nomogram. The c-indexes in (A) the nomogram development data set and (B) the external validation data set were 0.79 and 0.70, respectively.
15
The χ2 Goodness of fit analysis was performed for calibration. P>0.05 would indicate a significant good of fit. The goodness of fit test showed that the nomogram model had significantly good fit at 1- and 2-year survival interval (χ2 =4.0995, p=0.998 and χ2 =11.7679, p=0.879, respectively).
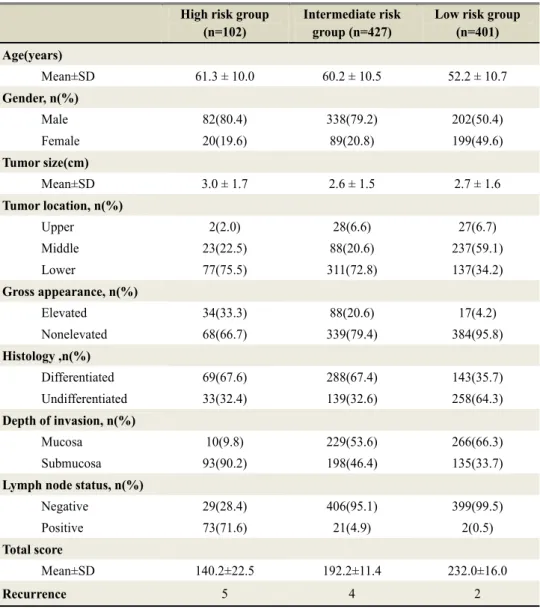
A subsequent calibration of the EGC nomogram was assessed by comparing the nomogram predicted disease free survival with the actual survival. The predictions derived from the EGC nomogram were then divided into three groups depending on their points, and these points were determined on the basis of mean nomogram score of no recurrence group and recurrence group in
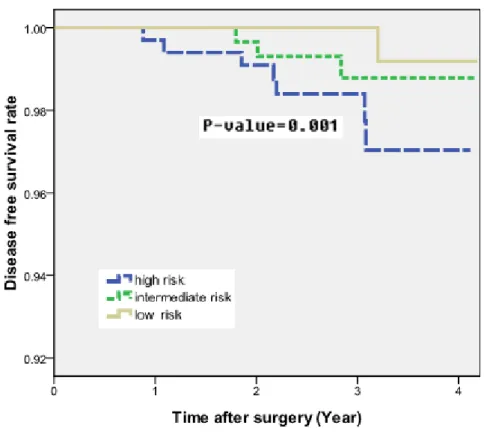
nomogram development set: high risk (lower than 170 points, 102 patients), intermediate risk (170-208 points, 427 patients), low risk (more than 208 points, 401 patients). The descriptive statistics for the three subgroups were listed in table 3. A Kaplan-Meier DFS curve among these three subgroups showed a significant difference (p=0.001). Especially, in comparison of Kaplan-Meier DFS curve between “high risk group” and “low risk group”, DFS of low risk group was statistically significant higher compare with that of high risk group (93.4% of 4 year DFS in high risk group Vs 99.2% of 4 year DFS in low risk group) (Figure 5).
16
Table 3. Stratified into three risk groups depending on their nomogram score
High risk group (n=102)
Intermediate risk group (n=427)
Low risk group (n=401) Age(years) Mean±SD 61.3 ± 10.0 60.2 ± 10.5 52.2 ± 10.7 Gender, n(%) Male 82(80.4) 338(79.2) 202(50.4) Female 20(19.6) 89(20.8) 199(49.6) Tumor size(cm) Mean±SD 3.0 ± 1.7 2.6 ± 1.5 2.7 ± 1.6 Tumor location, n(%) Upper 2(2.0) 28(6.6) 27(6.7) Middle 23(22.5) 88(20.6) 237(59.1) Lower 77(75.5) 311(72.8) 137(34.2) Gross appearance, n(%) Elevated 34(33.3) 88(20.6) 17(4.2) Nonelevated 68(66.7) 339(79.4) 384(95.8) Histology ,n(%) Differentiated 69(67.6) 288(67.4) 143(35.7) Undifferentiated 33(32.4) 139(32.6) 258(64.3) Depth of invasion, n(%) Mucosa 10(9.8) 229(53.6) 266(66.3) Submucosa 93(90.2) 198(46.4) 135(33.7)
Lymph node status, n(%)
Negative 29(28.4) 406(95.1) 399(99.5) Positive 73(71.6) 21(4.9) 2(0.5)
Total score
Mean±SD 140.2±22.5 192.2±11.4 232.0±16.0
Recurrence 5 4 2
The predictions derived from the nomogram were then divided into three groups depending on their points : High risk(lower than 170, 102 patients ), Intermediate risk(170-208, 427 patients) , Low risk (more than 208, 401 patients)
17
Figure 5. Comparison of Kaplan-Meier DFS curve of patients stratified into three risk groups depending on their total number of points
18
IV. DISCUSSION
This study has provided external validation for our previous EGC nomogram predicting disease-free survival after curative resection for EGC. The EGC nomogram, originally developed in the Yonsei cancer center, combines clinicopathological and operative data to predict disease free survival at 2, 5 and 10 years from curative resection of EGC, which was internally validated.11 The
EGC nomogram performed well when applied to the external validation set with good individual discriminatory properties and a good overall calibration.
The concordance index was 0.70 when the EGC nomogram was applied to the external validation set (n=930). The concordance index addresses the ability of the nomogram to predict a patient’s individual disease free survival rate accurately. Therefore, the c-index of 0.70 in external validation set means that the recurrence predicting accuracy of the nomogram is 70%. In addition, measuring discrimination in survival analysis (i.e. time to event analysis) was also performed using overall C index. The overall C index was 0.82 (p=0.006, 95% CI 0.59-1.00). Although not perfect, this represents an encouraging level of predictive accuracy.
Calibration describes how closely the predicted probabilities agree numerically with the actual outcomes. The χ2 Goodness of fit analysis was performed for calibration. P>0.05 would indicate a significant good of fit. The goodness of fit test showed that the nomogram model had significantly good fit at 1- and 2-year survival intervals (p=0.998 and 0.879, respectively). In addition, this was verified by a linear analysis after grouping patients according to their nomogram-predicted probabilities and then comparing the mean of the group with the observed survival estimate. The predictions derived from the nomogram were then divided into three groups depending on their points, and these points were determined on the basis of mean nomogram score of no recurrence group and recurrence group in nomogram development
19
set. A Kaplan-Meier DFS curve among these three subgroup showed significant difference (p=0.001). Therefore, the actual and predicted survival outcome showed good agreement, suggesting the survival predictions from the nomogram are well calibrated externally.
This study has shown that survival in patients after surgical resection for EGC is limited even after resection with curative intent. Although the recurrence rate of EGC after curative resection was rare but did occur. In the current study, the overall recurrence rate of EGC after D2 gastrectomy is 1.1%. The median time to recurrence in the patients of external validation set was 26.4 months, which was similar with the median time to recurrence in nomogram development set (26.5 months).
The clinicopathologic characteristics and disease free survival observed in the nomogram development cohorts and external validation cohorts were similar.
The prognosis after curative resection for EGC is currently estimated using TNM staging from the American Joint Committee on Cancer (AJCC).14 The stage groupings are based on the depth of tumor invasion and the number of lymph node metastases, and stratify patients into risk groups. However, this system did not provide sufficient estimates for recurrence risk and survival outcomes, because most patient with EGC diagnosed at early stage (stage I or II) and the recurrence rate of EGC after curative resection is rare. In contrast to staging system, prognostic nomograms are tools designed explicitly for prediction.10 They do not produce risk groups. Instead, they attempt to combine
all proven prognostic factors and quantify risk as precisely as possible.They have been developed and validated for prostate cancer, sarcoma, pancreatic cancer and gastric cancer.15-21 Nomograms are able to evaluate a large number
of significant variables to better predict an individual patient’s outcome. Improved prediction of patient outcome would be useful for counseling patients, designing novel therapeutic strategies, and scheduling patient follow-up.
20
There are some limitations to our study. Despite widespread use, the Cox model may have difficulty representing complex relationships, such as interactions in which a variable has a different effect depending on the level(s) of other variable(s). It is impossible to include enough predictive variables in a nomogram to give absolute predictions. Known variables may not be included because of the lack of numbers or observations, even though they are considered important in some analysis. However, by taking into account a greater number of known factors, this postresection nomogram allows for a more realistic approximation of whether an individual patient will be recur for a defined period of time. As our understanding of the disease progresses, clinical, pathologic, and biologic markers can be incorporated to further the refinement of this predictive tool.
V. CONCLUSION
Preexisting nomogram for predicting recurrence-free survival of EGC after surgery was externally validated. For the individual patient, the nomogram predicts the likelihood that a population of similar patients will survive a defined period of time. Although this is only a likelihood, the nomogram provides a more accurate prediction of what the patient might expect, as it takes into account factors that are not included in a simple median survival analysis. For the clinician, the nomogram might be helpful in tailoring follow-up schedules or novel therapeutic strategies.
21
References
1. Maehara Y, Kakeji Y, Oda S, Takahashi I, Akazawa K, Sugimachi K. Time trends of surgical treatment and the prognosis for Japanese patients with gastric cancer. Br J Cancer 2000;83:986-91.
2. Association KGC. National gastric cancer report in Korea. J Korea Gastric Cancer Assoc 2002;2:105–14.
3. Ichiyoshi Y, Toda T, Minamisono Y, Nagasaki S, Yakeishi Y, Sugimachi K. Recurrence in early gastric cancer. Surgery 1990;107:489-95.
4. Sano T, Kobori O, Muto T. Lymph node metastasis from early gastric cancer: endoscopic resection of tumour. Br J Surg 1992;79:241-4.
5. Shiozawa N, Kodama M, Chida T, Arakawa A, Tur GE, Koyama K. Recurrent death among early gastric cancer patients: 20-years' experience. Hepatogastroenterology 1994;41:244-7.
6. Lo SS, Wu CW, Chen JH, Li AF, Hsieh MC, Shen KH, et al. Surgical results of early gastric cancer and proposing a treatment strategy. Ann Surg Oncol 2007;14:340-7.
7. Furusawa M, Notsuka T, Tomoda H. Recurrence of early gastric cancer. Semin Surg Oncol 1991;7:344-50.
8. Ikeda Y, Saku M, Kishihara F, Maehara Y. Effective follow-up for recurrence or a second primary cancer in patients with early gastric cancer. Br J Surg 2005;92:235-9.
9. Lee HJ, Kim YH, Kim WH, Lee KU, Choe KJ, Kim JP, et al. Clinicopathological analysis for recurrence of early gastric cancer. Jpn J Clin Oncol 2003;33:209-14.
10. Banks. J. Nomograms. New York, NY, Wiley. 1985.
11. Lai JF, Kim S, Kim K, Li C, Oh SJ, Hyung WJ, et al. Prediction of recurrence of early gastric cancer after curative resection. Ann Surg Oncol 2009;16:1896-902.
12. R.B.D' Agostino, Nam BH. Evaluation of the performance of survival analysis models : Discrimination and Calibration Measures. Elsevier B.V. 2004:1-24.
13. Pencina MJ, D'Agostino RB. Overall C as a measure of discrimination in survival analysis: model specific population value and confidence interval estimation. Statistics in Medicine 2004;23:2109-23.
14. Green FL PD, Fleming ID. AJCC Cancer Staging Manual (ed 6). New York,NY, Springer 2002.
22
A preoperative nomogram for disease recurrence following radical prostatectomy for prostate cancer. J Natl Cancer Inst 1998;90:766-71.
16. Graefen M, Karakiewicz PI, Cagiannos I, Klein E, Kupelian PA, Quinn DI, et al. Validation study of the accuracy of a postoperative nomogram for recurrence after radical prostatectomy for localized prostate cancer. J Clin Oncol 2002;20:951-6.
17. Kattan MW, Leung DH, Brennan MF. Postoperative nomogram for 12-year sarcoma-specific death. J Clin Oncol 2002;20:791-6. 18. Eilber FC, Brennan MF, Eilber FR, Dry SM, Singer S, Kattan MW.
Validation of the postoperative nomogram for 12-year sarcoma-specific mortality. Cancer 2004;101:2270-5.
19. Kattan MW, Karpeh MS, Mazumdar M, Brennan MF. Postoperative nomogram for disease-specific survival after an R0 resection for gastric carcinoma. J Clin Oncol 2003;21:3647-50.
20. de Castro SM, Biere SS, Lagarde SM, Busch OR, van Gulik TM, Gouma DJ. Validation of a nomogram for predicting survival after resection for adenocarcinoma of the pancreas. Br J Surg 2009;96:417-23.
21. Ferrone CR, Kattan MW, Tomlinson JS, Thayer SP, Brennan MF, Warshaw AL. Validation of a postresection pancreatic adenocarcinoma nomogram for disease-specific survival. J Clin Oncol 2005;23:7529-35.
23
ABSTRACT(IN KOREAN)
조기위암의 근치적 절제술 후 재발 위험도 예측 노모그램의
외적 타당도 검증
<지도교수 라선영>
연세대학교 대학원 의학과
김주훈
서론 : 노모그램은 특정한 결과에 대한 가능성을 예측하고자 고안된 통계학적인 도구이다. 본원에서 진행한 이전 연구에서 조기 위암의 근치적 절제술 이후에 발생한 재발과 관련된 위험인자를 탐색하였고 이러한 위험인자를 Cox 회귀분석에 기초하여 조기위암의 재발 예측 노모그램을 개발하였다. 본 연구는 이 노모그램의 적합성 및 임상적 유용성을 확인하기 위해 외적 타당도 검증을 시행하였다. 방법 : 신촌 세브란스 병원에서 1987 년 1 월부터 2005 년 4 월까지의 기간 동안 조기위암으로 진단받고 근치적 절제술을 시행 받은 2923 명의 환자 군에서 구축된 재발예측 노모그램에 대하여 2005 년 5 월부터 2007 년 4 월 사이에 진단된 930 명 환자 군을 이용하여 외적 타당도 검증을 시행하였다. 상기 외적 타당도 검증은 discrimination 과 calibration 과정으로 진행하였다. 결과 : 총 11 명(1.1%)의 환자가 재발하였고 이중 4 명(36.4%)은 수술 후 2 년 이내에 재발하였다. 37 개월 중앙 추적 관찰 기간 동안 중앙 재발 기간은 26.4 개월이었고 노모그램 평균 값은 203.7(표준편차 32.7)이었다. 일치성 지수 (concordance index)는 0.7 (p=0.02)이었고 overall C index 는 0.82(p=0.006, 95%24
신뢰구간 0.59-1.05)이었다. 적합도 검정 (goodness of fit test) 을 시행했을 때 1 년, 2 년 생존 구간에서 통계학적으로 유의하게 적합한 결과를 보여주었다 (p=0.998 and 0.879, 각각). 전체 연구집단을 노모그램의 예측 점수에 따라 3 그룹으로 나누었고, 각각의 그룹에 대한 분류 기준은 다음과 같다. : 고위험군 (노모그램 점수 170 점 미만, 102 명), 중위험군 (노모그램 점수 170-208 점, 427 명), 저위험군 (노모그램 점수 208 점 초과, 401 명). 위 세 그룹간의 무병 생존율을 비교한 결과 통계학적으로 유의한 차이를 보여주었다 (p=0.001). 결론 : 본 연구를 통해 조기 위암의 근치적 절제술 이후 재발을 예측하는 노모그램에 대한 외적 타당도 검증을 시행하였다. 따라서 향후 임상에서 본 노모그램을 이용하여 조기 위암의 근치적 절제술을 받은 환자의 재발 여부를 보다 정확하게 예측할 수 있을 것으로 기대하며 이를 토대로 치료 및 검사, 추적 관찰에 대한 계획을 수립하는 데 도움이 될 것으로 생각된다.