2019 ⦽ǎႊᔍᖒ⠱ʑྜྷ⦺⫭ ⇹ĥ⦺ᚁݡ⫭ םྙ᧞Ḳ
161
The Methodology for the Decision of Groundwater Monitoring Points Around a
Nuclear Facility
Kyung-Woo Park*, Sung-Hoon Ji, and Jang-Soon Kwon
Korea Atomic Energy Research Institute, 111, Daedeok-daero 989beon-gil, Yuseong-gu, Daejeon, Republic of Korea *
woosbest@kaeri.re.kr
1. Introduction
Generally, the radioactive contaminant which is leaked from the nuclear use facility moves to the ecosystem by a run-off through the river or an advective transport through the groundwater flow. Among the two mechanisms, the contaminant plume through the river can be easily detected in surface water monitoring system, but the advective transport of a radioactive contaminant with the groundwater flow is difficult to monitor because of the lack of information for the flow path. To more understand the contaminant flow in groundwater, the description of geo-environment is needed. In this study, we suggest the methodology of the decision of monitoring point from a nuclear use facility by using the results of site characterization.
2. Study Area
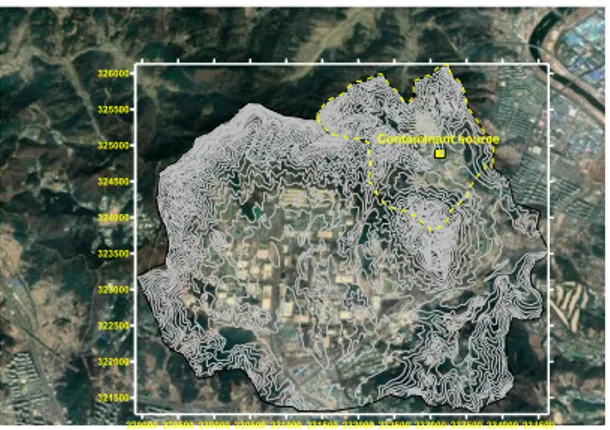
The study area is located at a northern part of Daejeon city. The topography of the study site is well characterized as rolling hills surrounded by upland of EL. 300-500 m and the lowland of about EL. 50 m. The geology of the study area is mainly composed of Mesozoic plutonic rock, Precambrian metamorphic rock, and a dike. The geologic formation of the Mesozoic plutonic rock is Jurassic schistose granite and two-mica granite. The Cenozoic alluvium is distributed over a wide area through the surface basin system in the research area with a 3-11 m depth. To make the monitoring system, we imagine the nuclear facility which acts as a contaminant source in the study area (Fig. 1).
Fig. 1. Location of the imaginary nuclear facility.
3. The Decision of Monitoring Point
3.1 Borehole Location
RM-1 borehole was drilled in 2018 to install the monitoring system. To decide the location of RM-1 borehole, we conducted the groundwater flow modeling based on the site descriptive model. From the result of a groundwater flow simulation, the contaminant transport from the imaginary nuclear facility was simulated by the particle tracking method and RM-1 borehole is located in the middle of the flow path from the imaginary nuclear facility (Fig. 2).
Fig. 2. Location of the RM-1 borehole.
229000 229500 230000 230500 231000 231500 232000 232500 233000 233500 234000 234500 321500 322000 322500 323000 323500 324000 324500 325000 325500 326000 Contaminant source
162
2019 ⦽ǎႊᔍᖒ⠱ʑྜྷ⦺⫭⇹ĥ⦺ᚁݡ⫭םྙ᧞Ḳ 3.2 Field InvestigationsTo decide the monitoring point in RM-1 borehole, the fracture logging along the borehole, hydro-chemical logging of the groundwater in the borehole and detail hydraulic tests with 30m interval were conducted. From the fracture logging, 4 geological units (weathered zone, upper/lower fracture rock and fracture zone) were defined and total 4 fracture zones were identified in the RM-1 borehole. The Hydro-chemical logging data told that there are 6 hydro-chemical anomalies, which were considered as water-conducting features in RM-1 borehole. And, we could obtain the 3 hydrogeological units (HSD, UHRD, 4 HCDs) from the result of the in-situ hydraulic test.
Table 1. Monitoring points from the result of the geological
logging (Ɣ : most favorable, Ÿ:favorable)
Section (GL.-m)
Geological
description Width Preference
surface~28.0 Weathered zone 28 Ɣ
28.0~61.0 Upper fractured rock 33 Ɣ
69.0~72.0 Fracture zone1 3 Ÿ
80.0~84.0 Fracture zone2 4 Ɣ
100.0~112.0 Fracture zone3 2 Ÿ
143.0~147.0 Fracture zone4 4 Ɣ
61.0૫150.0 Lower fractured rock
Table 2. Monitoring points from the hydro-chemical
logging (Ɣ : most favorable, Ÿ:favorable)
Section (GL.-m) Width Preference 31.0૫34.0 3 Ɣ 44.0૫47.0 3 Ɣ 56.0૫58.0 2 63.0૫67.0 4 Ɣ 69.0૫73.0 4 Ɣ 143.0૫145.0 2 Ÿ
Table 3. Monitoring point from the hydraulic tests (Ɣ : most
favorable, Ÿ:favorable) HG description Section (GL.-m) K/T Preference HSD 0~28 5.43×10⁻⁶ m/sec Ɣ UHRD 28~61 1.52×10⁻⁶ m/sec Ɣ HCD 69.0~72.0 1.76×10⁻⁵ m2/sec Ɣ 80.0~84.0 1.64×10⁻⁷ m2/sec Ÿ 100.0~112 .0 8.28×10 -9 m2/sec 143.0~147 .0 4.72×10 -6 m2/sec Ɣ
4. Conclusion
When the geological, hydrogeological and hydro-chemical properties were considered, we could suggest that the 4 sections should be monitored in RM-1 borehole. The water table was just a few meters(2૫3 m) beneath the surface, so groundwater from the nuclear facility flew to discharge area through the hydraulic soil domain(HSD) and upper hydraulic rock domain(UHRD). We also suggested that the two high permeable fracture zones should be monitored because these fracture zone might act as the preferential flow pathway in deep underground.
Table 4. Suggested monitoring points from the summary of the investigation result
Section (GL.-m) Geol. Hydrogeology Summary Chem. Permea. Surface~28.0 Ɣ Ɣ Ɣ 28.0 ~61.0 31૫3 4 Ɣ Ɣ Ɣ Ɣ 44૫4 7 Ɣ 56૫5 8 63.0૫67.0 Ɣ 69.0~72.0 Ÿ Ɣ Ɣ Ɣ 80.0~84.0 Ɣ Ÿ 100.0~112.0 Ÿ 143.0~147.0 Ɣ Ɣ Ɣ Ɣ
ACKNOWLEDGEMENT
This work was supported by the Nuclear Core Technology of the Korea Institute of Energy Technology Evaluation and Planning (KETEP) grant funded by the Korea government Ministry of Trade, Industry and Energy [No.20171510300670].