Article Information
Manuscript Received April 23, 2020, Accepted July 21, 2020, Published online September 30, 2020
The authors are with Department of Electrical Engineering, Soongsil University, Seoul, Republic of Korea. Correspondence Author: Sung-Guk Yoon ([email protected])
ORCID: 0000-0002-9575-7705(N. H. L. Fidele); 0000-0002-8987-6628(S. Yoon)
This paper is an open access article licensed under a Creative Commons Attribution-NonCommercial-NoDerivatives 4.0 International Public License. To view a copy of this license, visit http://creativecommons.org/licenses/by-nc-nd/4.0
This paper, color print of one or more figures in this paper, and/or supplementary information are available at http://journal.kepco.co.kr.
Volume 6, Number 3, September 2020, pp. 315-319 DOI 10.18770/KEPCO.2020.06.03.315
Revenue Maximizing Scheduling for a Fast Electric Vehicle Charging
Station with Solar PV and ESS
Nishimwe H. Leon Fidele, Sung-Guk Yoon
Abstract
The modern transportation and mobility sector is expected to encounter high penetration of Electric Vehicles (EVs) because EVs contribute to reducing the harmful emissions from fossil fuel-powered vehicles. With the prospective growth of EVs, sufficient and convenient facilities for fast charging are crucial toward satisfying the EVs' quick charging demand during their trip. Therefore, the Fast Electric Vehicle Charging Stations (FECS) will be a similar role to gas stations. In this paper, we study a charging scheduling problem for the FECS with solar photovoltaic (PV) and an Energy Storage System (ESS). We formulate an optimization problem that minimizes the operational costs of FECS. There are two cost and one revenue terms that are buying cost from main grid power, ESS degradation cost, and revenue from the charging fee of the EVs. Simulation results show that the proposed scheduling algorithm reduces the daily operational cost by effectively using solar PV and ESS.
Keywords: Electric Vehicle Fast Charging Station, Solar Photovoltaic, Energy Storage System, Optimization, Smart Grid, Charging Schedule
Nomenclature
N Index of number of fast chargers in the FECS t Index for time slot number
∆𝑡 Duration of an individual time slot
𝐶 Price of buying electricity from the main grid 𝐶 ESS degradation cost
𝐶 Price of charging an EV in a charging station 𝑃 Power drawn from the main grid by the FECS in
timeslot t.
𝑃 Minimum Power drawn from the main grid by the FECS
𝑃 Maximum Power drawn from the main grid by the FECS
𝑃 Solar power output in timeslot t 𝑃 Maximum solar power output
𝑃 Power required by the n-th charger to charge the EV connected to it in timeslot t
𝑃 , EV charging power demand at the charger n in
timeslot t
𝑃 , Maximum EV charging power requirement at the
charger n
𝐸 , EV charging energy requirement at the charger n in
timeslot t
𝐸 , Maximum EV charging energy requirement at the
charger n
𝑃 ESS charging power in timeslot t 𝑃 Maximum ESS charging power 𝑃 ESS discharging power in timeslot t
𝑃 Maximum ESS discharging power 𝑆 SoC of the ESS in timeslot t 𝑆 Minimum SoC of the ESS 𝑆 Minimum SoC of the ESS 𝜂 Efficiency of the ESS charging 𝜂 Efficiency of the ESS discharging 𝜂 Efficiency of the fast charger.
I. Introduction
Historically, fossil fuels have been mainly used for the transportation and mobility sector. Electric Vehicles (EVs) are expected to produce magnificent changes in the transportation and mobility sector. The gradual replacement of harmful emission releasing from Internal Combustion Engine vehicles (ICEV) and the integration of EVs at a large scale is considered not only as a promising way to tackle the global warming but also as a solution to the problem of accessibility and affordability of expensive fossil fuels [1]. In this regard, many countries worldwide are looking forward to elevating policies and incentives to speed up the integration of EVs [2]. However, because there is not enough number of EVs fast-charging facilities, EVs owners still have range anxiety resulting from the EVs' short driving distance and the long waiting time at charging stations [3]. With the growing penetration of EVs, a sufficient number of fast-charging stations are needed to offer convenient charging services and solve the range anxiety [4].
In recent years, EV charging infrastructure deployment problems have received extensive research attention. It has mostly
considered such as optimal placement and planning problem from the feature of sitting and sizing of charging stations. In [4], the authors designed an optimal charging network for charging service providers with considering the time-varying and location-dependent demands from vehicles and constraints of the power grid. According to [5], an approach is presented for optimal placement and sizing of the EV charging station to minimize the total cost including station development and, electrification costs as well as EV and electric grid energy loss cost due charging the EVs. In [6], the authors have addressed the optimal planning of EV fast-charging stations with a consideration of the interaction between the transportation and electrical networks. A network of charging stations equipped with an energy storage device and an allocation scheme concerning power and customer routes have been addressed in [7]. These researches have mainly approached the optimization problems from the aspects of planning and sizing of fast-charging stations.
Additional research has studied the cost optimization of the EV charging station. In [8], the authors have explained the design criteria for electric vehicle fast-charge infrastructure to supplement the residential and public slow charging infrastructure while covering the Flemish mobility needs. A work in [9] has expressed a mixed-integer programming problem to minimize a cost for photovoltaics (PV) powered EV charging station. In [10], the authors have proposed a complex mixed integer linear problem for an optimal EV charging method that minimizes the total cost of a merchant-owned charging facility with multiple chargers. Under [11], researchers have recommended a smart charging strategy for EV charging stations to find a station that provides minimum charging time, travel time and, charging cost. However, in these researches, the power of the charging station is principally drawn from the existing main grid, which incurs sharp demand charges. The expected high penetration of EVs will raise electric demand that can bring undesired impacts upon operation and voltage regulation of distribution networks [12]. Previous researches have mainly focused on the design and cost minimization of the charging station. However, the EV charging scheduling problem with the main grid, solar PV, and ESS has not been investigated much yet.
The main objective of EV charging stations is to maximize their profits while meeting the EVs charging demand as soon as possible. In this paper, we study a problem of an economic grid-connected fast electric vehicle charging station (FECS) that has solar PV and an ESS. To minimize the total daily operation cost of the FECS, it manages the ESS and takes advantage of solar PV. Simulation results show that the proposed scheduling algorithm decreases the daily operational cost through using solar PV and ESS effectively.
The remaining of this paper is organized as follows. Section II presents The FECS system overview. The detailed problem formulation of the FECS power scheduling is in Section III. Section IV provides case studies, results, and discussion, and then the conclusion is in Section V.
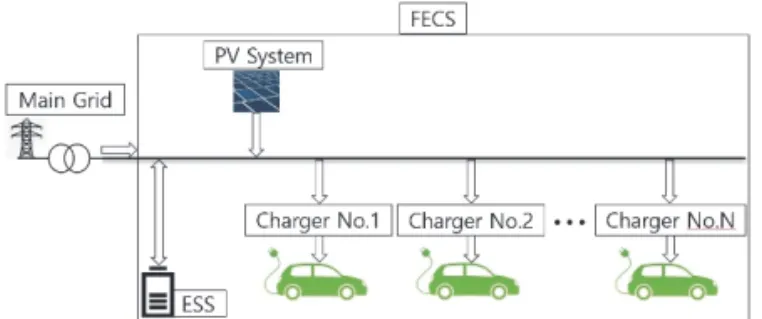
II. FECS System Model
We consider a FECS with 𝑁 fast chargers, and it can simultaneously charge up to 𝑁 EVs. A typical FECS which consists of the main grid, solar PV, and an ESS is illustrated in Fig. 1. The FECS manages the ESS in such a way to charge and discharge its power suitably to reduce the daily operational cost. In this paper, we assume that one fast charger can serve at most one EV during a timeslot t. When an EV arrives at the charging station, it is connected to a fast charger if there is a vacant charger. The charging process starts at the beginning of a timeslot t. The FECS purchase power from the main grid or can use the solar PV output, and/or ESS to supply the EV charging demand. The FECS buys the main grid power from the utility company and, it receives a charging fee from EV owners.
We consider the operation horizon of one day, which is segmented into 𝑇 = 144 equal time slots of 10 minutes, denoted as 𝒯 = {1,2, ⋯ , 𝑇} . At every time slot t, FECS allocates the electrical power from the main grid and solar PV and manage the ESS charging and discharging power to meet the total EVs’ power demand. The total power demand for the FECS during timeslot t is obtained from the sum of the power demands at N fast chargers.
III. Problem Formulation A. Objective Function
An objective function of the FECS is to minimize the daily operational cost of the FECS with the decision variables 𝑋 ≡
𝑃 , 𝑃 , 𝑃 . The total operational cost of the FECS at timeslot 𝑡 is expressed in Eq. (1) as
𝑋 = 𝐶 𝑃 + 𝐶 𝑃 + 𝑃 − 𝐶 𝑃 , ∀𝑡 ∈ 𝒯 (1)
This operational cost consists of purchasing cost from the main grid and the ESS degradation cost, and the revenue of FECS from the charging fee. Therefore, the objective function is formulated as
min
, , 𝑋
∈𝒯 (2)
B. Constraints
There are a number of constraints to guarantee that the optimization problem can be applicable. We assume that EVs can start charging only at the beginning of each timeslot t. In that regard, a constraint on EV charging power applies on each timeslot when an EV is charging. Otherwise, EV charging power is zero. At each timeslot t, the power balance Eq. (3) for FECS is expressed as
𝑃 ≤ 𝑃 + 𝑃 − 𝑃 + 𝑃 , ∀𝑡 ∈ 𝒯 (3)
EVs charging demand, the power supply from the main grid, and the solar PV have the following constraints,
0 ≤ 𝐸 , ≤ 𝐸 , , ∀𝑡 ∈ 𝒯 (4)
𝑃 , =
𝐸 ,
∆𝑡 , ∀𝑡 ∈ 𝒯 (5)
0 ≤ 𝑃 , ≤ 𝑃 , , ∀𝑡 ∈ 𝒯 (6)
𝑃 =𝑃 ,
𝜂 , ∀𝑡 ∈ 𝒯 (7)
𝑃 ≤ 𝑃 ≤ 𝑃 , ∀𝑡 ∈ 𝒯 (8)
When an EV arrives at a FECS to charge, its demand is bounded as shown in Eq. (4). Eq. (5) denotes EV charging requirement in a unit of watts. In Eq. (6), the power demand by the EV at the n-th charger is bounded between 0 and 𝑃 , . Eq. (7) represents the
actual power delivered to the EV at t through charger n. According to Eq. (8), the power purchased from the main grid is bounded. Note that it is assumed that, in this work, FECS cannot sell its power to the main grid, i.e., 𝑃 = 0.
0 ≤ 𝑃 ≤ 𝑃 , ∀𝑡 ∈ 𝒯 (9) 0 ≤ 𝑃 ≤ 𝑃 , ∀𝑡 ∈ 𝒯 (10) 𝑆 = 𝑆 + 𝜂 𝑃 −𝑃 𝜂 , ∀𝑡 ∈ 𝒯 (11) 𝑆 ≤ 𝑆 ≤ 𝑆 , ∀𝑡 ∈ 𝒯 (12) 𝑆 = 𝑆 , ∀𝑡, 𝑇 ∈ 𝒯 (13)
Constraints Eq. (9)-(13) represent the ESS model in this work. Constraints Eq. (9) and Eq. (10) represent ESS charging and discharging boundaries. State of charge (SoC) of the ESS is presented in Eq. (11), and it should be bounded between 𝑆 and 𝑆 at any t of Eq. (12). Constraint Eq. (13) ensures that the initial ESS storage level is equal to the ESS storage level at the end of the day.
C. Optimization Problem
The FECS coordinates the power scheduling and ESS charging and discharging scheduling to minimize the total operational cost while supplying EV charging demand. Our objective function includes the cost of buying power from the main grid, ESS degradation cost, and the revenue from charging the EVs. The optimization problem is formulated as
min , , 𝑋 ∈𝒯 (14) subject to Eq. (3)-(13).
IV. The Results discussion
In this section, we will evaluate the performance of the proposed optimization framework for FECS. We solve this optimization problem using CPLEX integrated with AMPL. The sensitivity analysis according to the solar PV size is also evaluated.
A. Case Study Parameters
We consider a FECS with solar PV and an ESS. The solar PV output data is obtained from [13]. It is assumed that the daily EV charging demand follows the distribution of vehicle trips. From the summary of travel trends of the 2017 National Household Travel
survey [14], we choose two scenarios: commute and errand distribution trips. We assume that the solar PV output and EV charging demand can be forecasted with reasonable accuracy at the start of a day.
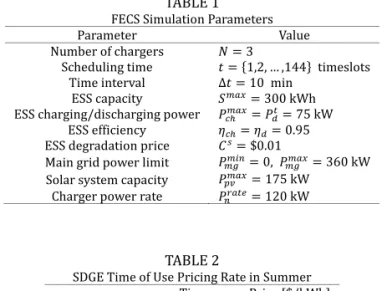
Because FECS is not a parking lot, it is assumed that EVs visit FECS for only a quick charge and continue its trip. In addition to that, EVs can charge up to 20 kWh within 10 minutes’ period. Initial SoC for the ESS at FECS is 30 kWh. Other detailed parameters for FECS are presented in TABLE I.
B. Pricing Structure
To determine the cost of energy from the main grid, we choose a Time of Use (ToU) pricing plan in summer by San Diego Gas & Electric (SDGE) [15]. The detailed tariff is listed in TABLE 2. Moreover, we set the electricity price of EV charging at a FECS as 0.33 $/kWh [16].
C. Simulation Results
The scheduling results for the proposed scheme with the distributions of commute and errand trips are illustrated in Figs. 2 and 3, respectively. EV charging demand for EVs in the commute distribution trip shows two peaks: morning and evening as shown in Fig. 2. In this case, during the night and early in the morning, FECS takes advantage of the lowest-priced period to charge the ESS. From 06:00 to 10:00, ESS is sensible to the peak demand and increase of the main grid power price as a result of discharging its power to supply EVs demand. Throughout the daytime between 10:00 and 15:40, the EVs charging demand to FECS is provided by the solar PV. Furthermore, the solar PV’s surplus energy goes to ESS. The energy stored; discharges during the peak demand and the highest-priced time.
Fig. 3 shows the case of a FECS serving EVs on errand distribution trips. The errand distribution case has two peak demands that occur during the daytime between 11:00 and 16:00. Similar to the case of commute distribution trips, ESS charges at night because of the cheap price of electricity. In this case, there is no surplus from the solar PV. So there is none ESS charging during the daytime. Later between 16:00 and 21:00, the ESS responded to the
TABLE 1
FECS Simulation Parameters
Parameter Value Number of chargers 𝑁 = 3
Scheduling time 𝑡 = {1,2, … ,144} timeslots Time interval ∆𝑡 = 10 min
ESS capacity 𝑆 = 300 kWh ESS charging/discharging power 𝑃 = 𝑃 = 75 kW
ESS efficiency 𝜂 = 𝜂 = 0.95 ESS degradation price 𝐶 = $0.01
Main grid power limit 𝑃 = 0, 𝑃 = 360 kW Solar system capacity 𝑃 = 175 kW
Charger power rate 𝑃 = 120 kW
TABLE 2
SDGE Time of Use Pricing Rate in Summer
Time Price [$/kWh] On-peak 16:00- 21:00 0.37774
Off-peak 06:00- 16:00 21:00- 00:00 0.29171 Super Off-peak 00:00- 06:00 0.21364
on-peak period by discharging its power.
TABLE 3 illustrates the total operational profit for FECS. There are four cases to compare: MG, MG & ESS, MG & PV, and MG, PV & ESS.
Baseline (MG) Case: In this case, we considered a FECS, which uses
solely the main grid power to supply the EVs charging demand. The profit of the FECS comes from the revenue of providing charging service to EVs. The FECS which serves EVs on errand distribution trips earns more compared to a FECS which serves EVs on commute distribution trips although the two FECSs have the same EV charging demand. It is because a big part of the EVs demand in the errand trip is supplied with the mid-peak priced power while a FECS with commute trip has a peak demand during the highest-price period.
MG & ESS Case: In this case, we considered a FECS which have an
ESS. The profit gain resulting from the installation of an ESS is highest for a FECS with commute trips than a FECS with errand trips cases. Compared to the baseline case, the gain of using ESS for FECS with commute trips is 141.5% while the gain of using ESS for a FECS which serves EVs on errand trips is 76.3%. It is because the FECS with commute trips uses the ESS twice per day while that with errand trip uses only once.
MG & PV Case: In this case, FECS has a solar PV but does not have
ESS. Both the FECS with either commute trips or errand trips have significantly increased their profit compared to their baseline case. Because the errand trip exhibits a high-power demand during the day time where there is the highest power from solar PV, it has more profit than the FECS with commute trips. In commute trips case, the surplus energy around noon is wasted. As a result, the profit of a FECS with an errand trip is about $ 500 higher than that of a FECS with a commute trip.
MG, PV, & ESS Case: This case shows the best results. Compared to
the MG & PV case, the profit with commute trip increases much since it uses ESS twice. However, still, the gain with an errand trip is higher because of the same reason as the baseline case.
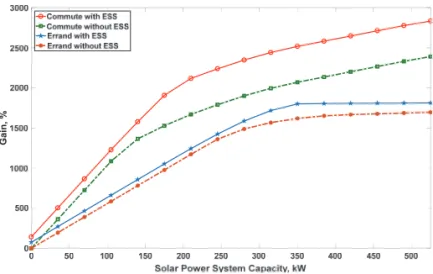
D. Sensitivity Analysis
In this section, we investigate the sensitivity of solar PV by changing the capacity of the solar PV generator between 35 kW to 525 kW. The gain in Fig. 4 is relative compared to a baseline that is a FECS without both solar PV and ESS. We compare the performances of FECSs with solar PV and with or without ESS. As depicted in Fig. 4, the profit of FECS increases as the capacity of solar PV increases, and ESS further increases the FECS’s profit.
Initially, the gain increases linearly with the capacity of solar PV. However, when the solar power surplus starts to occur, FECS’s gain increases logarithmically with the capacity of solar PV. The changing point between linear and logarithm of the commute trip occurs at smaller solar PV capacity than that of an errand trip because the commute trip has less charging demand when the solar PV output is at peak. During the logarithmically increasing period, the gain from ESS on a commute trip is higher than that of an errand trip. It is because ESS charging and discharging happen twice due to the surplus around noon for the case of commute trips. The profit gain in the commute trip is higher compared to the gain on an errand trip since the baseline cost of commute trips is smaller than that of an errand trip as shown in TABLE 3.
Fig. 2. Charging scheduling for a FECS with a solar PV (175 kW) and an ESS (300 kWh). EVs charging power demand follows a distribution of vehicle on the commute trip.
Fig. 3. Charging scheduling for a FECS with a solar PV (175 kW) and an ESS (300 kWh). EVs charging power demand follows a distribution of vehicles on the errand trip.
TABLE 3
Profits for FECS with Only Main Grid (MG), MG and ESS, MG and Solar PV, and MG, solar PV, and ESS
Scenario MG [$] MG & ESS [$] MG & PV [$] MG, PV& ESS [$] Commute trips 130.45 315.04 2122.75 2617.45 Errand trips 241.94 426.53 2604.63 2788.68 00:00 02:00 04:00 06:00 08:00 10:00 12:00 14:00 16:00 18:00 20:00 22:00 Time, h -100 -50 0 50 100 150 200 250 300 350 400 Pow er , k W -0.2 -0.1 0 0.1 0.2 0.3 0.4 0.5 0.6 0.7 0.8 TO U p ri ce, $/ kW h
EVs demand (Commute) Solar Power Output ESS Charging Main Grid Power ESS Discharging Time of Use price
00:00 02:00 04:00 06:00 08:00 10:00 12:00 14:00 16:00 18:00 20:00 22:00 Time, h -100 -50 0 50 100 150 200 250 300 350 400 -0.2 -0.1 0 0.1 0.2 0.3 0.4 0.5 0.6 0.7 0.8 EVs demand (Errand)
Solar Power Output ESS Charging Main Gid Power ESS Discharging Time of Use price
Fig. 4. Sensitivity of PV solar and ESS on the FECS daily operational gain.
Gain
V. Conclusion
Sustainable and efficient facilities for fast EV charging are important for the widespread adoption of EVs. In this paper, we studied the operational power scheduling problem for a fast EV charging station (FECS) with solar PV and ESS. The objective of this work is to minimize the total operational cost using solar PV and ESS. We simulate with two case studies that EV charging demand follows the distributions of vehicles on commute or errand trips. Simulation results demonstrated the effectiveness of solar PV and ESS for the FECS. According to the EV traffic distribution, the effect of PV solar and ESS is different. Therefore, each FECSs need to consider their capacities of PV and ESS to maximize its gain. In our future work, we will consider the stochastic characteristics of EV charging demand and develop a more robust scheduling problem for a FECS.
Acknowledgment
This work was supported by Korea Electric Power Corporation under Grant R18XA04.
References
[1] Vishu, G., Rajesh, K., BK. Panigrahi, “Electric Vehicle Charging Management-Battery Charging vs. Swapping in Densely Populated Environments,” IEEE Smart Grid Newsletters, Oct. 2019.
[2] Liu, G., Kang, L., Luan, Z., Qiu, J., Zheng, F. “Charging Station and Power Network Planning for Integrated Electric Vehicles (EVs),” Energies, 12(13), p.2595, Jan. 2019, DOI: https://doi.org/10.3390/en12132595. [3] Bryden, T. S., Hilton, G., Dimitrov, B., de León, C. P., Cruden, A., “Rating a
Stationary Energy Storage System within a Fast Electric Vehicle Charging Station Considering User Waiting Times,” IEEE Trans. Transport. Electrific., vol. 5, no. 4, pp. 879-889, Dec. 2019, DOI: 10.1109/TTE.2019.2910401.
[4] Zhang, Y., Chen, J., Cai, L., Pan, J., “EV Charging Network Design with Transportation and Power Grid Constraints”, in Proc. IEEE INFOCOM 2018, Honolulu, HI, USA, Apr. 2018, pp. 2492-2500, DOI:
10.1109/INFOCOM.2018.8486414.
[5] Sadeghi-Barzani, P., Rajabi-Ghahnavieh, A., Kazemi-Karegar, H., “Optimal Fast Charging Station Placing and Sizing,” Applied Energy, vol. 125, pp. 289–299, Jul. 2014. DOI:
https://doi.org/10.1016/j.apenergy.2014.03.077.
[6] Zhang, H., Moura, S. J., Hu, Z., Song, Y., “PEV Fast-Charging Station Siting and Sizing on Coupled Transportation and Power Networks”, IEEE Trans. Smart Grid, vol. 9, no. 4, pp. 2595-2605, Jul. 2018, DOI: 10.1109/TSG.2016.2614939.
[7] Bayram, I. S., Michailidis, G., Devetsikiotis, M., Granelli, F., “Electric Power Allocation in a Network of Fast Charging Stations”, IEEE Journal on Sel. Areas Commun., vol. 31, no. 7, pp. 1235-1246, Jul. 2013, DOI: 10.1109/JSAC.2013.130707.
[8] Machiels, N., Leemput, N., Geth, F., Van Roy, J., Büscher, J., Driesen, J., “Design Criteria for Electric Vehicle Fast Charge Infrastructure Based on Flemish Mobility Behavior”, IEEE Trans. Smart Grid, vol. 5, no. 1, pp. 320-327, Jan. 2014, DOI: 10.1109/TSG.2013.2278723.
[9] Tushar, W., Yuen, C., Huang, S., Smith, D. B., Poor, H. V., “Cost Minimization of Charging Stations with Photovoltaics: An Approach with EV Classification”, IEEE Trans. Intell. Transp. Syst., vol. 17, no. 1, pp. 156-169, Jan. 2016, DOI: 10.1109/TITS.2015.2462824. [10] Vidanalage, I., Sabillon, C., Venkatesh, B., Torquato, R., Freitas, W.,
“Scheduling of Merchant-Owned EV Charging at a Charging Facility with Multiple Chargers”, in Proc. 2018 IEEE EPEC, Toronto, ON, USA, Oct. 2018, pp. 1-6, DOI: 10.1109/EPEC.2018.8598415.
[11] Moghaddam, Z., Ahmad, I., Habibi, D., Phung, Q. V., “Smart Charging Strategy for Electric Vehicle Charging Stations”, IEEE Trans. Transport. Electrific., vol. 4, no. 1, pp. 76-88, Mar. 2018, DOI:
10.1109/TTE.2017.2753403.
[12] Zahedi, A. “Maximizing Solar PV Energy Penetration Using Energy Storage Technology,” Renew. Sustain. Energy Rev., vol.15, No. 1, pp. 866-870, Jan. 2011, DOI: 10.1016/j.rser.2010.09.011.
[13] PV Output, Available at https://pvoutput.org/outputs.jsp, Accessed on April 12, 2020.
[14] Summary of Travel Trends: 2017 National Household Travel Survey, Available at:
https://nhts.ornl.gov/assets/2017_nhts_summary_travel_trends.pdf, Accessed on April 12, 2020.
[15] SDG&E EV Time of Use summer pricing plan, Available at:
https://www.sdge.com/residential/pricing-plans/about-our-pricing-plans/electric-vehicle-plans, Accessed on April 12, 2020.
[16] Kim, J., Lee, J., Park, S., Choi, J. K., “Battery-Wear-Model Based Energy Trading in Electric Vehicles: A naı̈ve auction Model and a Market Analysis,” IEEE Trans. Ind. Informat., vol. 15, no. 7, pp. 4140-4151, Jul. 2019, DOI: 10.1109/TII.2018.2883655.