의
의
의학
학
학 박
박
박사
사
사학
학
학위
위
위 논
논
논문
문
문
R
R
Re
e
eg
g
gu
u
ul
l
l
a
a
at
t
to
o
or
r
ry
y
yM
M
Me
e
ec
c
ch
h
ha
a
an
n
ni
i
i
s
s
sm
m
ms
s
so
o
of
f
fM
M
Mi
i
i
t
t
to
o
ot
t
ti
i
i
c
c
c
C
C
Ca
a
at
t
ta
a
as
s
st
t
tr
r
ro
o
op
p
ph
h
he
e
eI
I
In
n
nd
d
du
u
uc
c
ce
e
ed
d
db
b
by
y
yD
D
Do
o
ox
x
xo
o
or
r
ru
u
ub
b
bi
i
i
c
c
ci
i
i
n
n
n
아
아
아 주
주
주 대
대
대 학
학
학 교
교
교 대
대
대 학
학
학 원
원
원
의
의
의 학
학
학 과
과
과
엄
엄
엄 영
영
영 우
우
우
R
R
Re
e
eg
g
gu
u
ul
l
la
a
at
to
t
o
or
r
ry
y
yM
M
Me
e
ec
c
ch
h
ha
a
an
n
ni
i
is
s
sm
m
ms
s
so
o
of
f
fM
M
Mi
i
it
t
to
o
ot
t
ti
i
ic
c
c
C
C
Ca
a
at
t
ta
a
as
s
st
t
tr
r
ro
o
op
p
ph
h
he
e
eI
I
In
n
nd
d
du
u
uc
c
ce
e
ed
d
db
b
by
y
yD
D
Do
o
ox
x
xo
o
or
r
ru
u
ub
b
bi
i
ic
c
ci
i
in
n
n
지
지
지도
도
도교
교
교수
수
수 최
최
최 경
경
경 숙
숙
숙
이
이
이 논
논
논문
문
문을
을
을 의
의
의학
학
학 박
박
박사
사
사학
학위
학
위
위 논
논
논문
문
문으
으
으로
로
로 제
제
제출
출
출함
함
함.
.
.
2
2
20
0
00
0
05
5
5년
년
년 2
2
2월
월
월
아
아
아 주
주
주 대
대
대 학
학
학 교
교
교 대
대
대 학
학
학 원
원
원
의
의
의 학
학
학 과
과
과
엄
엄
엄 영
영
영 우
우
우
엄
엄
엄영
영
영우
우
우의
의
의 의
의
의학
학
학 박
박
박사
사
사학
학
학위
위
위 논
논
논문
문
문을
을
을 인
인
인준
준
준함
함
함.
.
.
심
심
심사
사
사위
위
위원
원
원장
장
장
주
주
주 일
일
일 로
로
로 인
인
인
심
심
심 사
사
사 위
위
위 원
원
원
백
백
백 은
은
은 주
주
주 인
인
인
심
심
심 사
사
사 위
위
위 원
원
원
최
최
최 경
경
경 숙
숙
숙 인
인
인
심
심
심 사
사
사 위
위
위 원
원
원
이
이
이 창
창
창 우
우
우 인
인
인
심
심
심 사
사
사 위
위
위 원
원
원
강
강
강 동
동
동 민
민
민 인
인
인
아
아
아 주
주
주 대
대
대 학
학
학 교
교
교 대
대
대 학
학
학 원
원
원
2
2
20
0
00
0
04
4
4년
년
년 1
12
1
2
2월
월
월 2
2
22
2
2일
일
일
Regulatory Mechanisms of Mitotic Catastrophe Induced
by Doxorubicin
by
Young-Woo Eom
A Dissertation Submitted to The Graduate School of Ajou University
in Partial Fulfillment of the Requirements for the Degree of
DOCTOR OF PHILOSOPHY
Supervised by
Kyeong Sook Choi, Ph.D.
Department of Medical Sciences
The Graduate School, Ajou University
2
- ABSTRACT -
Regulatory Mechanisms of Mitotic Catastrophe Induced by
Doxorubicin
Purpose: Doxorubicin may act through DNA intercalation/binding, inhibition of
topoisomerase II, free radical generation, or damage to cell membranes and induce apoptosis, senescence or mitotic catastrophe. Because low dose of doxorubicin induce senescence or mitotic cell death, we attempted to investigate the possible link between the drug-induced senescence and mitotic cell death as comparing with apoptotic cell death induced by high doses of doxorubicin in human hepatoma cells. And we examined the role of p21 in the prevention of doxorubicin-induced mitotic catastrophe (or multinucleation) to understand the regulatory mechanisms of mitotic catastrophe in human colorectal carcinoma cells.
Materials and Methods: We used human hepatoma (Huh-7) and human
hepatocellular carcinoma cell lines (SNU-354, -398, -449, and -475) to distinguish the mode of low doses (LD) of doxorubicin-induced cell death from that of apoptosis induced by high doses (HD) of the same drug, morphologically and biochemically, and human colorectal carcinoma cell line HCT116 to understand the regulatory mechanisms of mitotic catastrophe induced by doxorubicin. We checked changes of several senescence markers, such as SA-β-galactosidase activity and osteonectin, SM22, TGase II, and PAI-1 expressions by RT-PCR, and evaluated morphological
3
and biochemical differences between mitotic catastrophe and apoptosis using electron or fluorescence microscophy and western blotting. To know the role of p21 in multinucleation formation we analyzed the cell cycle profiles using FACS, activities of Cdc2 or Cdk2.
Results: LD doxorubicin induced abnormal mitosis and then senescence-like
phenotype (SLP) in Huh-7 human hepatoma cell lines. Subsequently, these cells were undergoing cell death through mitotic catastrophe which was caused by abnormal mitosis. Cellular morphologies and biochemical characters of mitotic cell death were different to HD doxorubicin-induced apoptosis. 1) Membrane morphology changed during the mitotic cell death was similar to those observed in necrosis. 2) Nuclear lamin B distribution differed in cells undergoing LD doxorubicin-induced mitotic cell death and HD doxorubicin-induced apoptosis. 3) Mitochondrial cytochrome c was released both in doxorubicin-induced apoptosis and mitotic cell death. 4) p38, JNK MAP kinases, and NF-κB were significantly activated during doxorubicin-induced apoptosis but not mitotic cell death. 5) Caspases were significantly activated during doxorubicin-induced apoptosis but not mitotic cell death
In HCT116 human colorectal carcinoma cells, LD doxorubicin induced multinucleation in p21-/- cells, but not in p21+/+ cells. In p21-/- cells, abnormal mitosis caused by multi-polar spindle structures were observed and activities of Cdc2 and Cdk2 were not decreased. But in p21+/+ cells, LD doxorubicin induced G1 cell
cycle accumulation and decrease of activities of Cdc2 and Cdk2. These multinucleation observed in LD doxorubicin-treated p21-/- cells was dramatically
4
decreased by pre-treatment with Purvalanol A, an inhibitor of Cdc2 and Cdk2. But 500 nM doxorubicin induced G2 cell cycle arrest both in p21+/+ and p21-/- cells. G2
cell cycle arrest induced by 500 nM doxorubicin was caused from ATM/Chk signaling pathways. Although caffeine abrogated G2 arrest both in p21+/+ and p21-/-
cells, multinucleation was accelerated only in p21-/- cells.
Conclusion: In part I, LD doxorubicin induces SLP in Huh-7 human hepatoma cells,
and then those cells with SLP subsequently died by abnormal mitosis or mitotic catastrophe. And two distinct modes of cell death by doxorubicin were due to differences in cellular morphologies and many biochemical characters. In part II, p21 played a key role in preventing multinucleation via G1 or G2 cell cycle arrest induced
by 50 or 500 nM doxorubicin, respectively. Even though G2 arrest was abrogated by
caffeine, multinucleation was prevented in p21+/+ cells because p21 induced again cell cycle arrest at G1 phase.
Key words: Doxorubicin, Mitotic catastrophe, Senescence-like phenotype, Apoptosis, p21, Multinucleation,
5
TABLE OF CONTENTS
TITLE PAGE ---1 ABSTRACT ---2 TABLE OF CONTENTS --- 5 LIST OF FIGURES ---10 LIST OF TABLES --- 12 I. INTRODUCTION --- 13II. MATERIALS AND METHODS ---17
A. Cells and Culture Conditions--- 18
B. SA-β-gal Activity Assay --- 19
C. Measurement of Cellular Viability --- 19
D. Transmission Electron Microscopic Examination --- 20
E. Annexin-V/Propidium Iodide Staining --- 20
F. Immunoblotting --- 21
G. Immunocytochemistry --- 22
H. RT-PCR --- 23
I. Assassment of Nuclear Translocation of NF-kB --- 24
6
K. Subcellular Fractionation for Cytosolic and Mitochondrial Cytochrome c 24 L. Cdc2 and Cdk2 Kinase Assay --- 25 III. RESULTS --- 28 A. Part I. Two distinct Modes of Cell Death Induced by Doxorubicin: Apoptosis and Cell Death by Mitotic Catastrophe Accompanying Senescence-like Phenotype ---28 1. LD doxorubicin induces SLP and cell death by mitotic catastrophe --- 28 2. Several mitosis-controlling proteins are down-regulated during the
induction of SLP and cell death through mitotic catastrophe by LD doxorubicin --- 38 3. Induction of SLP and cell death through mitotic catastrophe is observed in many human HCC cell lines treated with LD doxorubicin --- 40 4. Differences in cellular morphologies and kinetics between LD
doxorubicin-induced cell death by mitotic catastrophe and HD doxorubicin-induced apoptosis --- 42 5. Integrity of the plasma membrane is not lost from the initial phase of LD doxorubicin-induced cell death through mitotic catastrophe --- 47 6. Nuclear lamin B distribution differs in cells undergoing LD doxorubicin-induced cell death and HD doxorubicin-doxorubicin-induced apoptosis --- 49
7
7. Mitochondrial cytochrome c is released during both doxorubicin-induced apoptosis and cell death through mitotic catastrophe --- 50 8. p38, JNK MAP kinases, and NF-κB are significantly activated during doxorubicin-induced apoptosis but not cell death through mitotic catastrophe --- 50 9. Caspases are significantly activated during doxorubicin-induced apoptosis but not cell death through mitotic catastrophe --- 53 B. Part II. p21 is dispensable for G2/M arrest induced by moderate dose of
doxorubicin, but indispensable for blocking of multinucleation induced by low dose of doxorubicin. --- 61 10. A significant multinucleation is induced by low dose of doxorubicin in p21-/- cells --- 61 11. Abnormal spindle structures are frequently observed in p21-/- cells treated with LD doxorubicin --- 64 12. G1 cell cycle arrest in responses to LD doxorubicin is not occurred in
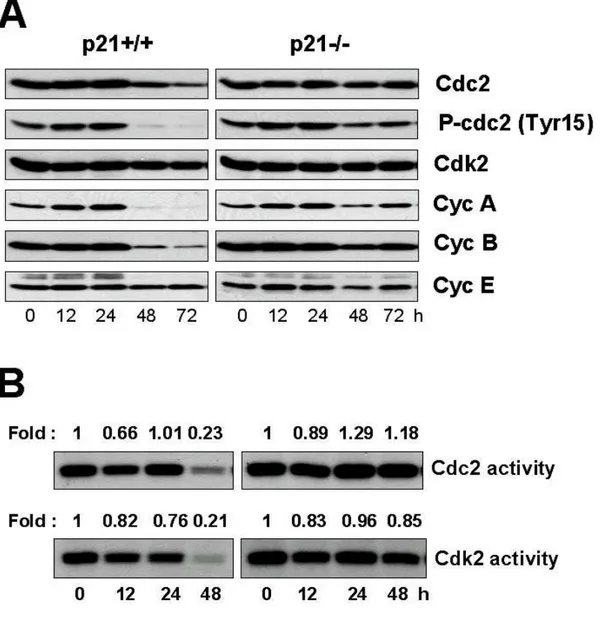
p21-/- cells --- 67 13. Activation of DNA damage checkpoint proteins and p53 is not significant in response to LD doxorubicin --- 67 14. Failure in the inhibition of Cdc2 and/or Cdk2 activity in p21-/- cells
8
treated with LD doxorubicin may be associated with induction of multinucleation --- 68 15. G2 cell cycle arrest is induced both in p21+/+ and p21-/- cells treated
with 500 nM doxorubicin --- 73 16. Multiple DNA checkpoint signaling pathways are activated in MD doxorubicin-induced G2/M arrest. --- 75
17. Abrogation of G2/M arrest by caffeine accelerates multinucleation in
p21-/- cells treated with MD doxorubicin. --- 77 IV. DISCUSSION --- 83 A. Part I. Two distinct Modes of Cell Death Induced by Doxorubicin in Huh-7
human hepatoma cells: Apoptosis and Mitotic Cell Death --- 83 1. LD doxorubicin induces SLP and cell death by mitotic catastrophe --- 83 2. Caspases are significantly activated during doxorubicin-induced
apoptosis but not cell death through mitotic catastrophe --- 87 3. Depletion of multiple mitotic ckeckpoint proteins by LD doxorubicin -88 B. Part II. p21 is dispensable for G2/M arrest induced by moderate dose of
doxorubicin, but indispensable for blocking of multinucleation induced by low dose of doxorubicin --- 91
9
4. Low dose of doxorubicin induced multinucleation in p21-/- cells, but not
in p21+/+ cells --- 91
5. Moderate dose of doxorubicin induced G2 arrest both in p21+/+ and p21-/- cells. --- 92
V. CONCLUSION --- 95
REFERENCES --- 96
국문요약 --- 110
10
LIST OF FIGURES
Fig. 1. Induction of senescence-like phenotype by LD doxorubicin --- 31 Fig. 2. Changes of cellular morphologies of Huh-7 cells treated with LD Doxorubicin --- 34
Fig. 3. Characterization of the time course of multinucleation and SA-b-gal expression in Huh-7 cells treated with LD doxorubicin --- 36
Fig. 4. Abnormal spindle formation in cells treated with LD doxorubicin --- 37 Fig. 5. Changes in DNA contents following treatment with LD doxorubicin --- 39 Fig. 6. Changes in the expression of p53, p21 and some mitosis-controlling proteins following treatment with LD doxorubicin --- 41 Fig. 7. Induction of SLP and mitotic catastrophe in other human HCC cell lines -- 44 Fig. 8. Comparison of morphologies and viabilities between cells undergoing doxorubicin-induced cell death through mitotic catastrophe and apoptosis - 46 Fig. 9. Membrane alterations in doxorubicin-induced cell death and apoptosis --- 48 Fig. 10. Patterns of nuclear lamin B distribution in doxorubicin-induced cell death through mitotic catastrophe and apoptosis --- 51 Fig. 11. Release of mitochondrial cytochorme c in doxorubicin-induced cell death through mitotic catastrophe and apoptosis --- 55 Fig. 12. Differential regulation of p38, JNK cascades, and NF-κB in
doxorubicin-induced cell death through mitotic catastrophe and apoptosis --- 59 Fig. 13. Differential regulation of caspases in doxorubicin-induced cell death through
11
mitotic catastrophe and apoptosis --- 60 Fig. 14. Induction of multinucleation in p21-/- cells treated with 50 nM doxorubicin, but not by MD doxorubicin --- 63 Fig. 15. Formation of abnormal spindle structure in p21-/- cells treated with 50 nM doxorubicin --- 65 Fig. 16. Changes in DNA contents in p21+/+ or p21-/- cells treated 50 nM doxorubicin --- 66 Fig. 17. Expression of the proteins involved in DNA damage checkpoint signaling pathways in p21+/+ and p21-/- cells treated with 50 nM doxorubicin--- 69 Fig. 18. Expression of the cell cycle regulators and Cdc2 and Cdk2 activities in p21+/+ and p21-/- cells treated with 50 nM doxorubicin --- 70 Fig. 19. LD doxorubicin-induced multi-nucleation is attenuated by inhibition of Cdc2 and Cdk2 in p21-/- cells --- 72 Fig. 20. Changes in DNA contents in p21+/+ or p21-/- cells treated 500 nM doxorubicin --- 74 Fig. 21. Expression of the proteins involved in DNA damage checkpoint signaling pathways in p21+/+ and p21-/- cells treated with 50 nM doxorubicin --- 76 Fig. 22. Effect of combined treatment with caffeine and 500 nM doxorubicin on the multinucleation --- 79 Fig. 22. Effect of combined treatment with caffeine and 500 nM doxorubicin on the DNA contents and the activities of Chk1/2 --- 81
12
LIST OF TABLE
13
I. INTRODUCTION
The anthracycline antibiotic, doxorubicin, is one of the most important anticancer agents for solid tumors (Hortobagyi, 1997), and is a valuable component of intra-arterial infusion for the treatment of unresectable hepatocellular carcinoma (Acunas and Rozanes, 1999). However, despite widespread clinical use of doxorubicin, its anti-proliferative and death-inducing signaling is far from well characterized. Free radical formation and DNA damage via inhibition of topoisomerase II may be primarily responsible for its cytotoxic effects (Gewirtz, 1999). As with many other anticancer drugs, doxorubicin induces apoptosis; this may involve activation of caspases and disruption of mitochondrial membrane potential (Gamen et al., 2000). Several reports have demonstrated that various cancer cells treated with low doses (LD) of doxorubicin show a senescence-like phenotype (SLP) that resembles replicative senescence of normal cells at the morphological and enzymatic levels (Chang et al., 1999a; Wang et al., 1999). Senescent cells are generally characterized by a reduction in proliferative capacity, adoption of a flattened and enlarged cell shape, and the appearance of senescence-associated
(SA)-β-galactosidase activity (Dimiri et al., 1995). Other than doxorubicin, low doses of DNA damaging agents, including various chemotherapeutic drugs and ionizing radiation (Chang et al., 1999b), and introduction of an activated ras oncogene (Serrano et al., 1997) have been reported to induce senescence in cancer cells in a
14
similar manner. However, the molecular events that trigger SLP in cancer cells are far from clear.
Another lines of evidences showed that LD of chemotherapeutic drugs (Lock and Stribinskiene, 1996), γ-radiation (Hendry and West, 1997), and activated Ras (Miranda et al., 1996) induce mitotic catastrophe. Igor Roninson attempted to define mitotic catastrophe in morphological term, namely, as a type of cell death resulting from abnormal mitosis, which usually ends in the formation of large cells with multiple micronuclei and decondensed chromatin (Roninson et al., 2001). Cells undergoing mitotic catastrophe usually do not show DNA ladder formation (He et al., 2002) or DNA breaks detectable by TUNEL staining (Chang et al., 1999b), suggesting that this death is non-apoptotic. However, some research groups regard “mitotic catastrophe” as abnormal mitosis that leads to cell death (which can occur through necrosis or apoptosis) rather than to the cell death itself (Nitta et al., 2004; Chu et al., 2004). Castedo et al., have recently proposed that mitotic catastrophe results from a combination of deficient cell-cycle checkpoints and cellular damage (Castedo et al., 2004a). They argued that failure to arrest the cell cycle before or at mitosis triggers an attempt of aberrant chromosome segregation, which culminates in the activation of apoptotic default pathway and cellular demise. Therefore, until now there is no consensus whether cell death through mitotic catastrophe is fundamentally different death mode from apoptosis.
p53 protein is capable of transactivating at least three genes, MDM2, GADD45, and p21 (CIP1/WAF1). p21 is thought to be the main downstream effector
15
of p53 protein and is suggested to mediate p53-induced growth arrest, triggered by DNA damage. Normally, in a cell cycle, cyclin-dependent kinases (CDKs) phosphorylate proteins such as the Rb protein, allowing cells to enter the S-phase. In cells exposed to DNA-damaging agents, an arrest in the G1 phase of the cell cycle is seen. This arrest is thought to be mediated by p21, which is increased secondary to an increase in p53 protein after injury to DNA. p21 acts by binding to CDK–cyclin complexes, inhibiting their kinase activity and thereby leading to lack of phosphorylation of crucial proteins. This results in blockage of entry into the S-phase, allowing sufficient time for repair. In several studies, most of them on cell lines, p53 protein accumulation in response to DNA-damaging agents has been compared with the p21 response. A strong association has been found between DNA damage, p53 protein accumulation, and p21 expression. p21 protein expression has been detected in cells with wild-type TP53, but not in cells lacking p53 protein activity. The development of many types of human cancers (>50%) is associated with loss or mutation of p53. Furthermore, Bukholm and Nesland (Bukholm and Nesland, 2000) reported that a strong association between p21 downregulation and p53 protein accumulation and some cases with no expression of p21 and without detectable p53 protein was observed in primary human colon carcinoma. p21 also appears to induce G2 cell cycle arrest after DNA damage by directly inhibiting the activity of Cdks
(Canman and Kastan, 1995; White, 1996; Levine, 1997). DNA damage is sensed by the ataxia-telangiectasia mutated protein (ATM; Perry and Kleckner, 2003; Bakkenist and Kastan, 2003). p53 is one of the key targets that are subjected to activation by
16
ATM catalyzed phosphorylation (Canman et al, 1998). Activated p53, in turn, induces the expression of many proteins including p21, and is required to arrest cells at the G1 and G2 checkpoints of the cell cycle after DNA damage (Dulic et al, 1994;
Kuerbitz et al, 1992; Reed et al, 1994; Passalaris et al, 1999). These events also provide the cells with enough time to repair damaged DNA and prevent accumulation of deleterious mutations in the genome that would otherwise be subsequently transferred to daughter cells. The development of many types of human cancers (>50%) is associated with loss or mutation of p53. In particular, the loss or mutation of the p53 tumor suppressor gene has important consequences on mitotic fidelity when damaged DNA is present. In several studies, a strong association between DNA damage-induced p53 accumulation and p21 protein levels (Bukholm and Nesland, 2000) has been reported. p21 protein expression has been detected in cells harboring wild-type p53, but not in cells without functional p53. Also in primary human colon carcinoma without detectable p53 protein, p21 expression was not observed. Although several groups (Castedo et al., 2004a; Nitta et al., 2004) have reported the induction of mitotic catastrophe in p53-deficient cancer cells, involvement of p21 in mitotic catastrophe or multinucleation has not been clarified.
Chemotherapeutic agents have been reported to induce various cellular responses in cancer cells, including apoptosis, cell cycle arrest, senescence or mitotic catastrophe. However, the critical factors determining these different cellular responses are largely unknown. Recently, we have observed that doxorubicin of high dose (HD) induces apoptosis, while doxorubicin of low dose (LD) induces cell death
17
through mitotic catastrophe in human hepatoma cells. In addition to the doses of the drugs, different cellular responses may be induced by the same drug of same dose, depending on the genetic backgrounds of cancer cells.
The fact that sub-apoptotic doses of the same stimuli induce SLP or cell death by mitotic catastrophe attempted us to investigate the possible link between the drug-induced SLP and cell death through mitotic catastrophe in tumor cells. Here, in part I we show that LD doxorubicin induces abnormal mitosis and SLP in Huh-7 cells, and then those cells finally die through mitotic catastrophe, accompanying the formation of multiple micronuclei and loss of membrane integrity. Many human HCC cell lines show a similar cellular response, suggesting that induction of SLP and cell death by mitotic catastrophe may be a general response to LD doxorubicin. We show for the first time that the mode of LD doxorubicin-induced cell death by mitotic catastrophe is morphologically and biochemically distinct from apoptosis induced by high doses of the same drug. In part II, we examined the role of p21 in the determination of cellular fates in response to different doses of doxorubicin. We demonstrate here that treatment with LD doxorubicin inducesd a dramatic multinucleation in p21-/- cells but not in p21+/+ cells. In contrast, treatment with MD of doxorubicin induces G2
cell cycle arrest, instead of multinucleation, both in p21+/+ and p21-/- cells. Therefore we presents the first evidence that p21 plays a pivotal role in the blocking of multinucleation induced by LD doxorubicin but a supportive role in the attenuation of MD doxorubicin-induced multinucleation.
18
II. MATERIALS AND METHODS
A. Cells and Culture Conditions
To explore the mode of cell death after induction of SLP by doxorubicin, we first determined the optimal conditions to induce SLP in most of the treated cells. Of the tested experimental protocols (including different doses of doxorubicin, pulse treatment with doxorubicin for different periods, intermittent or chronic treatment, etc.), we obtained the best results with chronic exposure of HCC cells to a low dose of doxorubicin (50 ng/ml for Huh-7 cells). Briefly, Huh-7 cells were first plated in 10 cm dishes with 6 ml of DMEM containing 10% fetal bovine serum (FBS). After overnight culture, this medium was replaced with 6 ml of fresh DMEM containing 10% FBS and 50 ng/ml doxorubicin. Three days later, 3 ml of fresh DMEM containing 10% FBS and 50 ng/ml doxorubicin was added into the preexisting medium (to avoid possible nutritional depletion in long-term culture and to maintain the long-term concentration of doxorubicin at 50 ng/ml). Thereafter, 3 ml of doxorubicin-containing fresh medium was added every 3 days in the same manner, until day 12. Well-defined human HCC cells (SNU-354, -398, -449, and -475) were obtained from the Korean Cell Line Bank (Seoul, Korea) (Park et al., 1995) and grown in RPMI 1640 (Gibco-BRL, Grand Island, NY) supplemented with 10% FBS. In the respective HCC cell lines, the optimal concentration of doxorubicin to induce SLP was determined as follows: 60 ng/ml for SNU-354, 15 ng/ml for SNU-398, 120
19
ng/ml for SNU-449, and 45 ng/ml for SNU-475. To induce doxorubicin-induced apoptosis in Huh-7 cells, cells were treated with 10 µg/ml doxorubicin. Human colorectal carcinoma cell line HCT116 p21 wild-type (p21+/+) and knockout derivative (p21-/-) cells were kindly provided by Dr. Bert Vogel stein (Howard Hughes Medical Institute, Baltimore, MD). HCT116 cells were grown in a humidified atmosphere containing 5% CO2 at 37 ℃ in DMEM supplemented with
penicillin/streptomycin and 10% fetal bovine serum.
B. SA-ββββ-gal Activity Assay
Cells were stained for β-galactosidase activity as described by Dimiri et al. (Dimiri
et al., 1995). Briefly, 1 X 10⁴ cells were seeded in 24-well plate. After appropriate exposure, the cells were washed twice with PBS, fixed with 2% formaldehyde and 0.2% glutaraldehyde in PBS, and washed twice in PBS. Cells were stained for 12 h in X-gal staining solution [1 mg/ml X-gal, 40 mmol/L citric acid/sodium phosphate (pH 6.0), 5 mmol/L potassium ferricyanide, 5 mmol/L potassium ferrocyanide, 150 mmol/L NaCl, 2 mmol/L MgCl2]. Cells were then counterstained with 0.1%
haematoxylin solution or Giemsa stain solution.
C. Measurement of Cellular Viability
Huh-7 cells were treated with doxorubicin at the indicated concentrations for the fixed time points. Cellular viability was assessed by double labeling of cells with 2
20
µmol/L calcein-acetoxymethyl ester (calcein-AM) and 4 µmol/L ethidium homodimer-1 (Etd-1). Calcein-positive live cells were counted under a fluorescence microscope (Nikon Diaphot 300, Japan), since Etd-1-positive dead cells were floated from the culture plate following treatment of doxorubicin. Alternatively, cellular viability was assessed by trypan blue exclusion assay. Following the treatment of Huh-7 cells with doxorubicin, cells were trypsinized. After addition of 0.4% trypan blue stain solution into the cells, total cell numbers and trypan blue-stained cells were counted using haemacytometer.
D. Transmission Electron Microscopic Examination
Huh-7 cells were treated with 50 ng/ml doxorubicin for the indicated time periods. The cells were prefixed in Karnovsky’s solution (1% paraformaldehyde, 2% glutaraldehyde, 2 mmol/L calcium chloride, 0.1 mol/L cacodylate buffer, pH 7.4) for 2 h and washed with cacodylate buffer. Post-fixing was carried out in 1% osmium tetroxide and 1.5% potassium ferrocyanide for 1 h. After dehydration with 50 to 100% alcohol, the cells were embedded in Poly/Bed 812 resin (Pelco, Redding, CA) and polymerized, and observed under electron microscope (EM 902A, Zeiss, Oberkochen, Germany).
21
Huh-7 cells grown on coverslips were treated with 50 ng/ml or 10 µg/ml doxorubicin at different time periods. Adherent cells on coverslips were washed with PBS and externalized phosphatidyl serine and DNA was labeled with Annexin-V-fluorescein and Propidium iodide (1 µg/ml) in HEPES buffer (10 mmol/L HEPES/NaOH, ph 7.4, 140 mmol/L NaCl, 5 mmol/L CaCl2) for 15 min. The stained cells were observed
under fluorescence microscope after washing and mounting of the coverslip on the slide glass. Floated dead cells were separately collected by centrifugation and washed with PBS. These cells were resuspended in HEPES buffer containing Annexin V-FITC and PI and incubated for 15 min. After centrifugation, the stained cells were observed under fluorescence microscopy by placing the resuspended cells in HEPES buffer onto a glass slide and covering with a coverslip. Percentages of the cells stained with Annexin V-FITC and/or PI relative to total cell numbers, the numbers of adherent cells on a coverslip plus the numbers of floated dead cells, were measured.
F. Immunoblotting
After treatments, cells were washed once with ice-cold PBS and lysed in sodium dodecyl sulfate/polyacrylamide gel electrophoresis (SDS-PAGE) sample buffer (62.5 mmol/L Tris [pH 6.8], 1% SDS, 10% glycerol, and 5% β-mercaptoethanol). The lysates were sonicated, boiled for 5 min, separated by SDS-PAGE, and transferred to an Immobilon membrane (Millipore, Bedford, MA). Immunoblotting was performed
22
using standardprocedures.The membrane was incubated with antibodies against p53, p21, Cyc A, 14-3-3 σ (each diluted 1:500, purchased from Calbiochem, San Diego, CA), αtubulin, VDAC, Bid, phosphospecificp38, MKK3/6, SEK1, JNK, p38, -IkB-α, -Cdc2, -p53, -Chk1, -Chk2, -Histone H3 (each diluted 1:1000, purchased from Cell Signaling Technology, Beverly, MA), caspase-9, FAK, Lamin B, Cdc2, Cdk2, Cyc B1, Cyc E, Cdc25A, Cdc25C, Cdc20, Cdc27, BubR1, Chk1, Chk2, Prc1 (each diluted 1:500, purchased from Santa Cruz Biotechnology Inc., Santa Cruz, CA), caspase-3, caspase-6, caspase-7, caspase-8 (1:500, Stressgen Biotechnologies Co., Victoria, BC), CENP-A, PARP, phosphor-specific H2AX (1:500, Upstate Biotechnology, Lake Placid, NY), securin (1:1000, Zymed Laboratories Inc., South San Francisco, CA), phosphor-specifin ATM (1:500, Abcam Inc.,Cambridge, MA), actin, Mad2, Cdh1, Plk1, and cytochrome c (1:500, BD Transduction Lab., San Diego, CA) in blocking buffer. Bound primary antibodies were detected with HRP-conjugated secondary antibodies and enhanced chemiluminescence (Amersham, Arlington heights, IL).
G. Immunocytochemistry
Cells were washed twice with PBS and fixed in 4% formaldehyde for 10 min at room temperature, and then washed 3 times with PBS. To examine the expression of α -tubulin or cytochrome c, fixed cells were permeabilized in 0.1% Triton X-100/2% BSA, and stained with mouse anti-α-tubulin antibody (1:200, Calbiochem, San
23
Diego, CA), mouse anti-cytochrome c antibody (1:50, BD Transduction Lab., San Diego, CA). Cells were further incubated with FITC-conjugated anti-mouse antibody (1:50, Molecular Probes, Inc., Eugene, OR). To examine the expression of lamin B, cells were stained with goat anti-lamin B antibody (1:100, Santa Cruz Biotechnology, Santa Cruz, CA) and further incubated with FITC-conjugated anti-goat antibody (1:50, Sigma, St. Louis, MI). Nuclei were further stained with Hoechst 33258, DAPI, or propium iodide (1 µg/ml, Sigma, St. Louis, MI). To examine the expression of actin, cells were incubated with FITC-conjugated phalloidin (1:50, Sigma, St. Louis, MI). Stained cells were examined by confocal or fluorescence microscopy (Olympus, Shinjuku-ku, Tokyo).
H. RT-PCR Analysis
Total RNA was isolated from cells treated with 50 ng/ml doxorubicin for the indicated time points using RNAZolB (Tel-Test, Friendswood, TX). Total RNA (2
µg) from each cell culture was reverse transcribed using oligo-dT primers and AMV reverse transcriptase (TaKaRa, Otsu, Shiga). The cDNAs were amplified by PCR (94oC for 30 sec, 60oC for 30 sec and 72oC for 1 min) with Taq DNA polymerase.To ensure exponential amplification, four aliquots were removed from each PCR assay at cycles 20, 25, 30, or 35 cycles (which were determined in preliminary experiments to produce the weakest detectable PCR product for each gene) and every 2-4 cycles thereafter. Amplified products were analyzed by agarose gel electrophoresis at cycles
24
within the linear range of mRNA amplification. The sequences of oligonucleotide primers used for RT-PCR and the expected transcript sizes are listed in Table 1.
I. Assessment of Nuclear Translocation of NF-κΒκΒκΒκΒ
After treatments, nuclear extracts of Huh-7 cells were prepared using an established protocol as described previously (Liu et al., 1998). The expression of the translocated NF-κB was assessed by Western blotting using ani-p65, c-rel, and p50 antibody (1: 500, Santa Cruz Biotechnology Inc., Santa Cruz, CA).
J. Cell Cycle Analysis
Trypsinized and floating cells were pooled, washed with PBS-EDTA, and fixed in 70% (v/v) ethanol. DNA content was assessed by staining cells with propidium iodide and monitoring by FACScan. Cell cycle distribution was determined with a ModFit LT program (Verity Software House, Inc).
K. Subcellular Fractionation for Analysis of the Release of Mitochondrial Cytochrome c
After treatments, Huh-7 cells were collected and washed twice in ice-cold PBS, resuspended in S-100 buffer (20 mM HEPES, pH 7.5, 10 mM KCl, 1.9 mM MgCl2, 1
mM EGTA, 1 mM EDTA, mixture of protease inhibitors), and incubated on ice for 20 min. After 20 min incubation on ice, the cells were homogenized with a Dounce
25
glass homogenizer and a loose pestle (Wheaton, Millville, NJ) for 70 strokes. Cell homogenates were spun at 1,000 X g for 10 min to remove unbroken cells, nuclei, and heavy membranes. The supernatant was spun again at 14,000 X g for 30 min to collect the mitochondria-rich (pellet) and cytosolic (supernatant) fractions. The mitochondria-rich fraction was washed once with extraction buffer, followed by a final resuspension in lysis buffer (150 mM NaCl, 50 mM Tris-HCl, pH 7.4, 1% Nonidet P-40, 0.25% sodium deoxycholate, 1 mM EGTA) containing protease inhibitors for Western blot analysis.
L. Cdc2 and Cdk2 Kinase Assay
Cells were collected at different incubation times with doxorubicin and washed in PBS. Cells were lysed in buffer A for 15 minon ice. Cell lysates were cleared by centrifugation at 13,000rpm for 15 min. Protein concentration was determined by Bio-Radassay,and 200 g of protein was used for each co-immunoprecipitation. Immunoprecipitations were performed by incubating lysates with2 µg of the anti-Cyclin B1 or –Cdk2 antibody for Cdc2 or Cdk2 activity, respectively, for 3 h at 4 °C. 15µl of 50% protein A/G-agarose suspension (Santa Cruz Biotechnology Inc., Santa Cruz, CA)was added into the mixture, which was then further incubated for1 h. Immune complexes were centrifuged at 2,500 rpm for 5 min and the precipitates were washed three times with buffer A andtwice with kinase buffer (50 mM Tris-HCl (pH 7.5), 10 mM MgCl2,1 mM DTT). Cdk kinase assays on histone H1 were
26
performed by mixingthe respective immune complexes with 5 µg of histone H1 and 10µCi of [γ-32P] ATP in 30 µl of kinase buffer. The kinase reactionwas performed at 30 °C for 30 min and then terminated with 2× SDS-PAGE sample buffer. Radioactive ATP incorporation was measured by SDS-PAGE and autoradiography.
28
III. RESULTS
Part I. Two distinct modes of cell death induced by doxorubicin:
apoptosis and cell death by mitotic catastrophe accompanying
senescence-like phenotype
1. LD doxorubicin induces SLP and cell death by mitotic catastrophe
While various cytotoxic agents have been reported to induce senescence in cancer cells at low doses (Wang et al., 1999; Chang et al., 1999a; Chang et al., 1999b), the biochemical changes associated with treatment-induced senescence are not clearly understood. Using doxorubicin, a widely used anti-cancer drug, we first determined the optimal condition to induce SA-β-gal activity, a biomarker for cellular senescence (Dimiri et al., 1995) in Huh-7 human hepatoma cells. We found that chronic exposure to 50 ng/ml doxorubicin for 6 days could effectively induce SA-β-gal activity in over 82% of Huh-7 cells, but not in cells incubated in doxorubicin-free media for the same period, suggesting that doxorubicin is responsible for SA-β-gal expression (Fig. 1A and 1B). Moreover, Huh-7 cells treated with 50 ng/ml doxorubicin for 6 days demonstrated a characteristic SLP, including enlargement of cell volume, flattened cell morphology, and the appearance of multinucleated and vacuolated cell forms (Fig. 1A). RT-PCR analysis of gene products commonly associated with cellular senescence showed that osteonectin,
29
SM22, TGase II, and PAI-1 (Dumont et al., 2000) mRNA levels were significantly increased at 6 days and were maintained up to 9 days following doxorubicin treatment (Fig. 1C). As shown in Fig. 1B, the percentage of SA-β -galactosidase-positive cells decreased after 9 days of doxorubicin exposure and giant cells were gradually floated from the plate. Trypan blue exclusion assays showed that cellular viability was maintained for the first 6 days of doxorubicin exposure and then gradually decreased to reach 54% by day 9(Fig. 1D).
The changes in nuclear morphologies following exposure to 50 ng/ml doxorubicin were further assessed by Hoechst 33258 staining (Fig. 2A). After 3 days of LD doxorubicin treatment, the nuclei became significantly larger and some cells had several nuclei of unequal sizes. After 6 days, we observed an increased number of micronuclei, but did not observe the condensed or fragmented nuclei that were characteristic of apoptotic cells. More detailed electron microscopic observation demonstrated that cells became enlarged and the number of nuclei with intact nuclear membranes significantly increased after 3 days of treatment with LD doxorubicin (Fig. 2B). After 6 days, the number of micronuclei was further increased and multiple nuclei filled most of the cellular spaces. Furthermore, we observed considerable increases in the numbers of vacuoles, and electron-dense lysosomes, and we additionally observed the convolution or collapse of some nuclear membranes.After 9 days of LD doxorubicin treatment, most of the cells floated from the culture plate demonstrated necrosis-like characteristics such as diffuse chromatin,
31
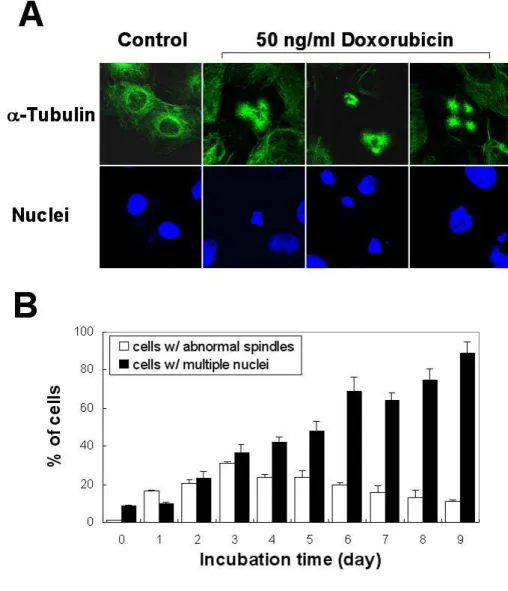
Fig. 1. Induction of senescence-like phenotype by low-dose doxorubicin. (A)
Expression of senescence-associated β-galactosidase in Huh-7 cells following chronic exposure to low dose (LD) doxorubicin. Huh-7 cells incubated with or without 50 ng/ml doxorubicin for 6 days and the control Huh-7 cells were fixed and then SA-β-gal assay was performed as described in Materials and Methods. Representative pictures are shown (magnification, 200X). Note the substantial increase in cell volume and the blue staining of cells treated with doxorubicin. (B) Quantitation of β-galactosidase expression in Huh-7 cells treated with or without doxorubicin. Data are presented as the mean and SD (bars) of four independent experiments based on three random fields with 100 cell counts per field.(C) RT-PCR analysis of gene products associated with cellular senescence. RNA was prepared from Huh-7 cells treated with 50 ng/ml doxorubicin for the indicated time points and RT-PCR was performed as described in Materials and Methods. (d) Changes in cellular viability following treatment with LD doxorubicin, as analyzed by staining with trypan blue.
32
disruption of intact cellular boundaries, and losses of the distinctive nuclear membrane structures. We did not detect the DNA fragmentation characteristic of apoptosis, as assessed by agarose gel electrophoresis or TUNEL assay (data not shown). Next, we investigated whether abnormal nuclear morphologies are observed before or after the increase in the number of SA-β-gal positive cells. SA-β-gal assay and subsequent nucrear staining with Giemsa solution demonstrated that both the percentages of multinucleate cells and the percentages of SA-β-gal positive cells were increased by 6 daays of 50 ng/ml doxorubicin treatment (Fig. 3A and 3B). While the percentages of multinucleate cells were 8.16, 10.04, 22.15, 34.67, 40.24, 49.91, and 78.04% at 0, 1, 2, 3, 4, 5, and 6 day respectively, the percentages of SA-β -gal positive cells were 3.87, 5.02, 4.95, 6.66, 21.41, 45.83, and 75.80% at the same incubation time points. Therefore, abnormal nuclear morphologies, which most likely arose as the consequence of abnormal mitosis, were observed earlier than the principal increase in the number of SA-β-gal positive cells. However, over 65% of total cells demonstrated both multinucleation and SA-β-gal positivity on 6-day exposure, suggesting that multinucleation and SLP are induced in most cells treated with 50 ng/ml doxorubicin.
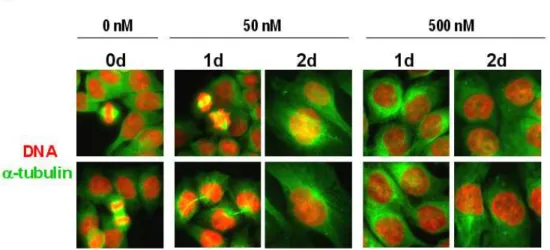
Next, to investigate whether multinucleation by doxorubicin was associated with abnormal mitosis, we examined the expression of α-tubulin, a major component of microtubules by staining with anti-α-tubulin antibody and nuclear morphologies by staining with DAPI. While the percentages of the cells with multiple nuclei were
34
Fig. 2. Changes in the cellular morphologies of Huh-7 cells treated with 50 ng/ml doxorubicin. (A) Changes in the nuclear morphologies. Representative pictures of
cells stained with Hoechst 33258 and visualized under a fluorescence microscope (magnification, 200X). (B) Electron microscopic observation of Huh-7 cells treated with 50 ng/ml doxorubicin for the indicated time periods. Bar is 2.5 µm. Electron micrographs are same magnification. White arrowheads, black arrowheads, and white arrows denote electron-dense lysosomes, vacuoles, and the convolution of nuclear membranes, respectively. And higher magnification of the picture showing the collapse of the nuclear membrane at 6 day is demonstrated.
36
Fig. 3. Characterization of the time course of multinucleation and SA-ββββ-gal expression in Huh-7 cells treated with 50 ng/ml doxorubicin. (A) Microscopic
analysis of multinucleation and SA-β-gal expression. Huh-7 cells were treated with 50 ng/ml doxorubicin for the indicated time points and SA-β-gal assay was performed. Cells were countestained with Giemsa solution and photographed at bright field with 400-fold magnification. β+, β -, SN, or MN denotes SA-β -gal-positive, SA-β-gal-negative, single nucleus, multiple nuclei, respectively. Representive pictures are shown. (B) Measurement of the percentages of cells with SA-β-gal negativity and single nucleus (β-gal (-) & SN), cells with SA-β -gal-positivity and multiple nuclei (β-gal (+) & MN), cells with SA-β-gal-positivity and single nucleus (β-gal (+) & SN) cells with SA-β-gal-negativity and multiple nuclei (β-gal (-) & MN
37
Fig. 4. Abnormal spindle formation in cells treated with 50 ng/ml doxorubicin. (A) Representative pictures of control Huh-7 cells and Huh-7 cells
treated with 50 ng/ml doxorubicin for 3 days after immunostaining using anti-α -tubulin antibody and DAPI. Images from confocal laser scanning microscopy are shown (magnification, 1200X). (B) Measurement of the percentages of cells with abnormal spindles or cells with multiple nuclei following treatment with 50 ng/ml doxorubicin for the indicated time periods.
38
gradually increased by treatment with 50 ng/ml doxorubicin, abnormal formation of spindles (tripolar, quadripolar or asymmetrical mircotubules) was observed with a peak at 3 days of doxorubicin treatment (Fig. 4A and 4B). These results suggest that abnormal spindle formation may contribute to the observed multinucleation by doxorubicin.
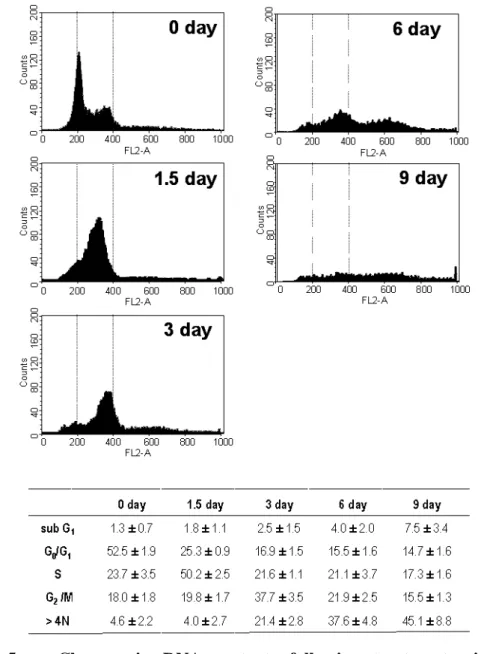
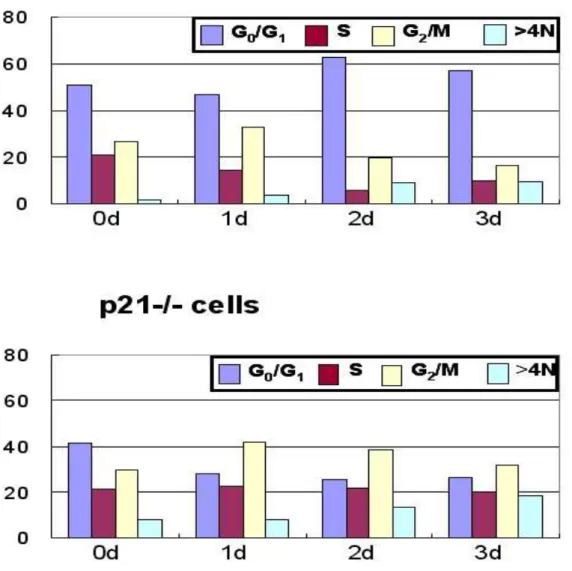
Next, we used FACS analysis to monitor the changes of DNA content in cells treated with LD doxorubicin (Fig. 5). At day 1.5 of doxorubicin treatment, the S phase cell population (from 23.7% to 50.2%) was significantly increased with a concomitantdecrease in the G0/G1 phase cell population (from 52.5% to 25.3%).At
day 3, about 37.7% of cells were detected at G2/M phase and the fraction of
hyperploid cell population (>4N DNA cells) increased (21.4%). Thereafter, the hyperploid cell population increased further and the DNA contents of the doxorubicin-treated cells became very heterogeneous, possibly due to the formation of multiple micronuclei of various sizes in the absence of cytokinesis. Interestingly, there was only a slight increase (7.5%) in the subG1 population after 9 days of LD
doxorubicin treatment, whereas cellular viability, assessed by trypan blue exclusion assay, decreased to 54% at this time (Fig. 1D). Taken together, these results suggest that apoptosis might not be the major mode of the cell death in Huh-7 cells treated with LD doxorubicin, but that these cells likely died through mitotic catastrophe.
2. Several mitosis-controlling proteins are down-regulated during the induction of SLP and cell death through mitotic catastrophe by LD doxorubicin
39
Fig. 5. Changes in DNA contents following treatment with 50 ng/ml doxorubicin. Cells were fixed with ethanol and their DNA contents measured by
FACS analysis. Representative histograms of three independent experiments are shown. Percentages of G0/G1, S, G2/M and subG1 phase cells were calculated by
deconvolution of the DNA content histograms. Values are presented as the mean and SD of three independent experiments.
40
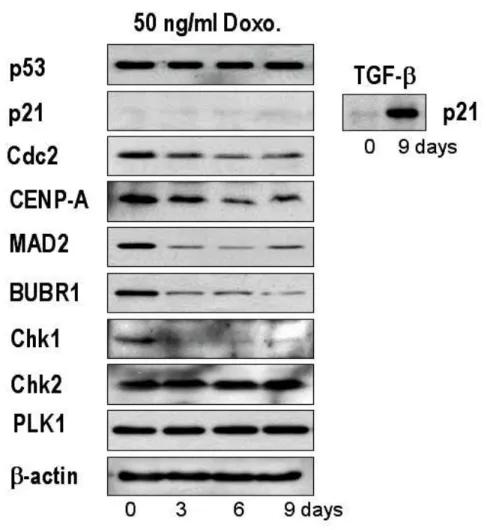
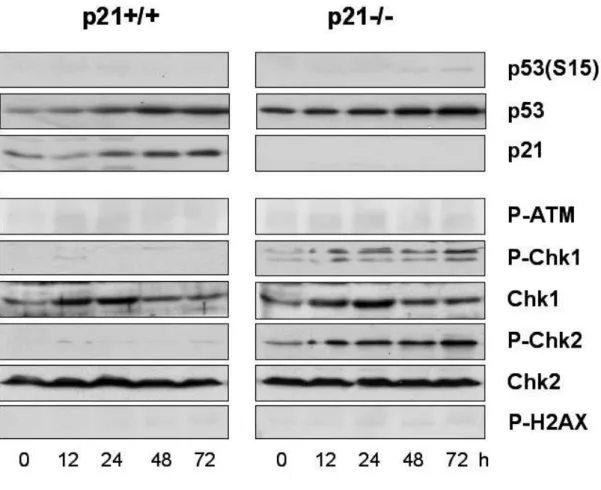
There is a broad consensus that p53-deficient cells are able to aberrantly reenter the cell cycle, where they undergo unchecked reduplication of their DNA, leading to increased nuclear content and subsequent chromosomal instability (Lanni and Jacks, 1998). In this context, p21 appears to be one of the major p53 target genes (Mantel et al., 1999). In Huh-7 cells harboring mutant p53 (Hsu et al., 1993), neither p53 nor p21 protein levels were altered following treatment with 50 ng/ml doxorubicin (Fig. 6), suggesting that induction of SLP by LD doxorubicin in Huh-7 is independent of p53 and p21. This is contrary to previous reports that p53 and p21 acted as positive regulators of doxorubicin-mediated senescence (Wang et al., 1999; Chang et al., 1999a). We further analyzed the protein levels of mitosis-associated proteins following treatment with 50 ng/ml doxorubicin. We observed downregulation of the mitosis initiator Cdc2, the centromere protein CENP-A (Kalitis et al., 1998), spindle checkpoint control proteins Mad2 and BubR1 (Li and Benezra, 1996), and the DNA damage-induced checkpoint kinase Chk1 (Chan et al., 1999). In contrast, neither the DNA damage-induced checkpoint kinase Chk2 (Hirao
et al., 2000) nor the mitotic checkpoint protein Plk1 (Seong et al., 2002) protein
levels were altered in response to 50 ng/ml doxorubicin. Our results suggest that doxorubicin may induce depletion of multiple proteins controlling mitosis, thus contributing to abnormal mitosis and subsequent cell death in Huh-7 cells.
3. Induction of SLP and cell death through mitotic catastrophe is observed in many human HCC cell lines treated with LD doxorubicin
41
Fig. 6. Changes in the expression of p53, p21 and some mitosis-controlling proteins following treatment with 50 ng/ml doxorubicin. Huh-7 cells were treated
with 50 ng/ml doxorubicin for the indicated time periods and Western blotting was performed to detect the changes in the expression of the listed proteins. To confirm that anti-p21 antibody used in this experiment was immunologically active, Huh-7 cells were treated with 5 ng/ml TGF-β1 for 9 days and Western blotting of p21 was performed.
42
To analyze whether induction of SLP and cell death through mitotic catastrophe following to exposure to doxorubicin is restricted to a particular cell line, we examined the effect of LD doxorubicin on other human HCC cell lines including SNU-354, -398, -449, and -475. Although there were cell type-specific variations in the optimal concentrations of doxorubicin for induction of SLP and the incubation time to reach mitotic catastrophe, all tested cell lines demonstrated similar induction of SLP and cell death by mitotic catastrophe in response to doxorubicin treatment (Fig. 7).
4. Differences in cellular morphologies and kinetics between LD doxorubicin-induced cell death by mitotic catastrophe and HD doxorubicin-doxorubicin-induced apoptosis
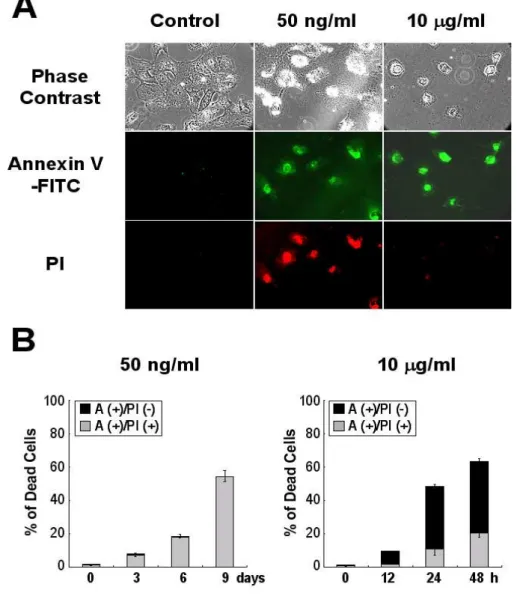
Although biochemical characteristics of apoptotic cell death have been well defined, those of cell death through mitotic catastrophe are less well understood. After 24 h treatment with 10 µg/ml of doxorubicin, cells showed a typical apoptosis characterized by reduction of cell volume, apoptotic blebbing, and an increase in nucleus-to-cytoplasm ratio (Fig. 8A and 8B). In contrast, 9 days of treatment with 50 ng/ml of doxorubicin induced significant increases in cell volume and additional micronuclei with indistinct nuclear boundaries. Cellular viability was compared during HD doxorubicin-induced apoptosis and LD doxorubicin-induced cell death through mitotic catastrophe by staining with calcein-AM and Etd-1, which detected
44
Fig. 7. Induction of SLP and mitotic catastrophe by doxorubicin in other human HCC cell lines. (A) SA-β-galactosidase assay. After treatment of human HCC cells with or without doxorubicin at the indicated experimental concentrations (SNU-354, 60 ng/ml for 8 days; SNU-398, 15 ng/ml for 10 days, SNU-449, 120 ng/ml for 8 days, SNU-475, 45 ng/ml for 8 days), SA-β-gal assay was performed and cells were counterstained with Giemsa stain solution. Representative pictures are shown (magnification, X200). (B) Quantitation of β-galactosidase expression in HCC cells treated with LD doxorubicin. Data are presented as the mean and SD (bars) of four independent experiments based on three random fields with 100 cell counts per field. (C) Occurrence of multinucleation. After treatment of HCC cells with or without doxorubicin at the indicated experimental conditions (SNU-354, 60 ng/ml for 10 days; SNU-398, 15 ng/ml for 12 days, SNU-449, 120 ng/ml for 10 days, SNU-475, 45 ng/ml for 10 days), nuclei were stained with Hoechst 33258 and cells were observed under a fluorescence microscope.
46
Fig. 8. Comparison of morphologies and viabilities between cells undergoing doxorubicin-induced cell death through mitotic catastrophe and apoptosis. (A)
Cellular morphologies of cells undergoing LD doxorubicin-induced cell death through mitotic catastrophe and HD doxorubicin-induced apoptosis. Cell death by mitotic catastrophe or apoptosis in Huh-7 cells was respectively induced by treatment with 50 ng/ml doxorubicin for 9 days or 10 µg/ml doxorubicin for 24 h. Representative phase contrast microscopic pictures of the cells are shown (magnification; X200). (B) Nuclear and cytoskeletal morphologies of cells undergoing doxorubicin-induced mitotic cell death and apoptosis. Nuclei and actin were respectively stained with propidium iodide and FITC-conjugated phalloidin in cells treated as described above. Representative fluorescence microscopic pictures are shown (magnificantion; X1200). (C) Cellular viability after exposure to doxorubicin. Huh-7 cells were plated in 24-well plates at 1 X 10⁴ cells/ well and exposed to 50 ng/ml or 10 µg/ml doxorubicin for different time points. The viable cells were determined according to their ability to hydrolyze calcein-AM and exclude Etd-1, as described in Materials and methods. (D) Changes in DNA contents following treatment with 10 µg/ml doxorubicin. Cells were fixed with ethanol and their DNA contents measured by FACS analysis. Representative histograms of three independent experiments are shown.
47
live and dead cells, respectively (Fig. 8C). While apoptosis induced by 10 µg/ml doxorubicin was a rapid process completed within 5 days, cell death induced by 50 ng/ml doxorubicin progressed more slowly, beginning after 6 days and continuing for 8 more days. In terms of DNA content, Huh-7 cells treated with 10 µg/ml doxorubicin demonstrated an obvious gradual increase in sub-doploid populations (Fig. 8D), as compared with the changes in the DNA content of Huh-7 cells undergoing LD doxorubicin-induced cell death through mitotic catastrophe (Fig. 5). These results suggest that LD doxorubicin-induced cell death through mitotic catastrophe and HD doxorubicin-induced apoptosis may differ not only morphologically but also biochemically.
5. Integrity of the plasma membrane is not lost from the initial phase of LD doxorubicin-induced cell death by mitotic catastrophe
To further understand the cell death mode through mitotic catastrophe, cells treated with 50 ng/ml or 10 µg/ml doxorubicin for different time periods were stained with FITC-conjugated annexin-V (a Ca2+-dependent phospholipid-binding protein with high affinity for phosphatidyl serine) and propidium iodide (a membrane-impermeable DNA stain). While most of annexin V (+) cells were PI (-) at 24 h of 10
µg/ml doxorubicin treatment, the percentages of annexin V (+) & PI (+) cells were increased by 20% at 48 h (Fig. 9). Very interestingly, following treatment with 50 ng/ml doxorubicin, almost all of annexin V (+) cells were PI (+), whereas annexin V
48
Fig. 9. Membrane alterations in LD doxorubicin-induced cell death and HD doxorubicin-induced apoptosis. After treatment of cells with 50 ng/ml doxorubicin
or 10 µg/ml doxorubicin for indicated time periods, cells were incubated with FITC-annexin-V and PI as described in Materials and Methods. Positively stained cells were observed under a fluorescence microscope (A; magnification, X200) and counted and then expressed as a percentage of total cell number (B).
49
(+) & PI (-) cells were barely detected. These results suggest that phosphatidyl serine externalization is occurred both in cells undergoing doxorubicin-induced apoptosis and cell death through mitotic catastrophe. However, the integrity of the plasma membrane is lost from the initial phase of doxorubicin-induced cell death through mitotic catastrophe, while it is lost only at later phase doxorubicin-induced apoptosis.
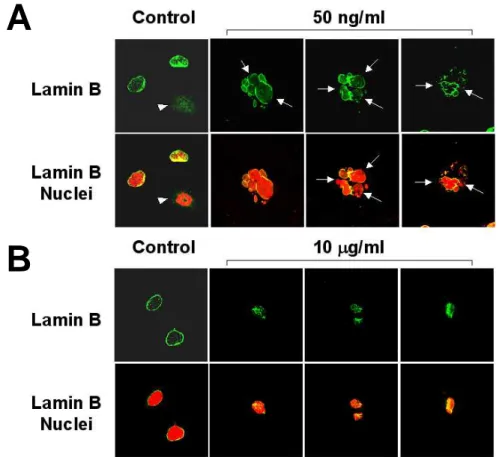
6. Nuclear lamin B distribution differs in cells undergoing LD doxorubicin-induced cell death and HD doxorubicin-doxorubicin-induced apoptosis
Next, we investigated the structure of the nuclear envelope in cells undergoing LD doxorubicin-induced mitotic cell death. Lamin B is a major component of nuclear lamina, a fibrous structure adjacent to the nucleoplasmic face of the nuclear membrane (Aebi et al., 1986). Nuclear envelopes were strongly labeled by lamin B antibody in control interphase cells (Fig. 10). In contrast, the ring-like structure was frequently disrupted in cells treated with doxorubicin for 9 days, suggesting a loss in the integrity of nuclear envelopes. However, in apoptotic cells treatedwith 10 µg/ml doxorubicin for 24 h, the peripheral ring-like structure of lamin B was almost absent, and the intranuclear staining of numerous spots was intense (Fig. 10). Therefore, these results demonstrate that lamin B distribution differs in cells undergoing doxorubicin-induced mitotic cell death and apoptosis. Taken together, our results suggest that different doses of doxorubicin induce different modes of cell death with distinctive morphologies and possibly different
50
regulatory mechanisms.
7. Mitochondrial cytochrome c is released both in doxorubicin-induced apoptosis and cell death through mitotic catastrophe
Disruption in mitochondrial membrane function and the release of mitocohndrial cytochrome c into the cytosol have been reported to play a critical role in apoptosis induced by many chemotherapeutic agents (Decaudin et al., 1998). As expected, cells treated with 10 µg/ml doxorubicin showed gradual increase in cytochrome c in the cytosolic fractions (Fig. 11A). Interestingly, cytochrome c was also progressively released into the cytosol beginning after 3 days of treatment with 50 ng/ml doxorubicin, climbing to significant levels by day 9. Release of cytochrome c into the cytosol in cells treated with HD or LD doxorubicin was further confirmed by immunofluorescence experiments by fluorescece microscopy (Fig. 11B). While puntate staining patterns of cytochrome c were observed in untreated Huh-7 cells, both LD and HD doxorubicin commonly lead to diffuse pattern of cytochrome c. Therefore, our results indicate that mitochondrial cytochrome c is released both in doxorubicin-induced apoptosis and mitotic cell death.
8. p38, JNK MAP kinases, and NF-κκκκB are significantly activated during doxorubicin-induced apoptosis but not cell death through mitotic catastrophe
51
A
B
Fig. 10. Patterns of nuclear lamin B distribution in LD doxorubicin-induced cell death through mitotic catatrophe and HD doxorubicin-induced apoptosis.
Huh-7 cells were treated with or without 50 ng/ml doxorubicin for 9 days (A) or Huh-7 cells were treated with or without 10 µg/ml doxorubicin for 24 h (B). Cells were immunostained using anti-lamin B antibody (green). Nuclei were counter-stained with propidium iodide (red). Cells were visualized by confocal laser scanning microscopy (magnification, 1200X) and representative pictures are shown. Arrowhead denotes lack of lamin B labeling around chromatin and the possible disassembly of nuclear envelope in cells undergoing mitosis. Arrows indicate the frequent disruption of nuclear envelopes in cells undergoing mitotic catastrophe.
52
Both p38 and JNK have been implicated in apoptosis induced by various cytotoxic agents (Ono and Han; 2000; Davis, 2000). Therefore, we investigated whether these stress-activated MAP kinases were also involved in doxorubicin-induced SLP and cell death through mitotic catastrophe. The activities of p38 and JNK were analyzed with antisera that bound the actively phosphorylated proteins (Fig. 12A). As early as 1 h after exposure to 10 µg/ml doxorubicin, phosphorylation of both p38 and JNK was substantially enhanced, and this activity was sustained up to 24 h. In contrast, treatment with 50 ng/ml doxorubicin did not induce any significant activation of these proteins. MKK3/6 (Raingeaud et al., 1996) and SEK1 (Yan et al., 1994), which are the upstream kinases of p38 and JNK, respectively, demonstrated the same activation profiles of p38 and JNK under LD and HD doxorubicin conditions. The total protein levels of these MAP kinases were not significantly altered in response to either 10 µg/ml or 50 ng/ml doxorubicin (data not shown).
Activation of the transcription factor NF-κB has been linked to apoptosis, with the factor playing either an anti-apoptotic or a pro-apoptotic role, depending on the cell type (Baichwal and Baeuerle, 1997). We analyzed changes in the expression levels of IkB-α, an inhibitor protein of NF-κB, during the progression of doxorubicin-induced apoptosis and cell death through mitotic catastrophe (Fig. 12B). When cells were treated with 10 µg/ml doxorubicin, IkB-α protein was markedly diminished at 1 h and completely disappeared thereafter. Next, we analyzed whether
53
IkB-α degradation in these apoptotic cells was directly associated with the concomitant nuclear translocation of NF-κB. Interestingly, the appearance of NF-κB p65, p50, and c-Rel in the nuclear fractions was increased significantly at 30 minutes after doxorubicin treatment, peaked and then declined (Fig. 12C). These results demonstrate that NF-κB is only transiently activated during the initial phase of doxorubicin-induced apoptosis. In contrast, IkB-α protein levels were not significantly decreased at any time point in cells treated with 50 ng/ml doxorubicin (Fig. 12B). Furthermore, there was no detectable nuclear translocation of NF-κB in cells undergoing LD doxorubicin-induced cell death through mitotic catastrophe (data not shown). Taken together, these results demonstrate that the stress-activated signaling molecules are not involved in doxorubicin-induced cell death through mitotic catastrophe.
9. Caspases are significantly activated during doxorubicin-induced apoptosis but not cell death through mitotic catastrophe
Apoptosis triggered by various cytotoxic agents depends on activation (via internal cleavage of proenzymes) of caspases, which play pivotal roles in the proteolysis of specific targets (Gupta, 2001). To examine whether caspases were also involved in doxorubicin-induced cell death through mitotic catastrophe, the proteolytic processing patterns of caspases in cells undergoing LD doxorubicin-induced cell death were compared with those of cells undergoing HD doxorubicin-
55
Fig. 11. Release of mitochondrial cytochorme c in LD doxorubicin-induced mitotic cell death and HD doxorubicin-induced apoptosis. (A) Analysis of the
release of mitochondrial cytochrome c by subcellular fractionation and Western blotting. Cytosolic and membrane fractions were separated from cells treated with 50 ng/ml or 10 µg/ml doxorubicin at the indicated time points as described in Materials and Methods. Ten micrograms of cytosolic and mitochondrial proteins per lane were resolved on 12% SDS-PAGE. Contents of cytochrome c in the respective fractions were analyzed by Western blotting using an anti-cytochrome c antibody. Successful fractionation of the cytosolic and mitochondrial fractions were confirmed by Western blotting of α-tubulin as a specific marker for cytosolic proteins and VDAC as a specific marker for mitochondrial proteins. (B) Analysis of the release of mitochondrial cytochrome c by immunocytochemistry. Control Huh-7 cells, Huh-7 cells treated with 50 ng/ml doxorubicin for 9 days, or Huh-7 cells treated with 10
µg/ml doxorubicin for 24 h were fixed and immunocytochemical analysis of cytochrome c (green) was performed. Nuclei (red) were counter-stained with propidium iodide and cells were observed under a fluorescence microscope (magnification, 640X).