Endocrinol Metab 2020;35:470-479 https://doi.org/10.3803/EnM.2020.35.2.470 pISSN 2093-596X · eISSN 2093-5978
Original
Article
Serotonin Regulates De Novo Lipogenesis in Adipose
Tissues through Serotonin Receptor 2A
Ko Eun Shong1,*, Chang-Myung Oh2,*, Jun Namkung3, Sangkyu Park4, Hail Kim1,5
1Biomedical Science and Engineering Interdisciplinary Program, Korea Advanced Institute of Science and Technology
(KAIST), Daejeon; 2Department of Biomedical Science and Engineering, Gwangju Institute of Science and Technology,
Gwangju; 3Departments of Biochemistry, 4Precision Medicine, Yonsei University Wonju College of Medicine, Wonju; 5Graduate
School of Medical Science and Engineering, Korea Advanced Institute of Science and Technology (KAIST), Daejeon, Korea
Background: Obesity is defined as excessive fat mass and is a major cause of many chronic diseases such as diabetes, cardiovascu-lar disease, and cancer. Increasing energy expenditure and regulating adipose tissue metabolism are important targets for the treat-ment of obesity. Serotonin (5-hydroxytryptophan [5-HT]) is a monoamine metabolite of the essential amino acid tryptophan. Here, we demonstrated that 5-HT in mature adipocytes regulated energy expenditure and lipid metabolism.
Methods: Tryptophan hydroxylase 1 (TPH1) is the rate-limiting enzyme during 5-HT synthesis in non-neural peripheral tissues. We generated adipose tissue-specific Tph1 knockout (Tph1 FKO) mice and adipose tissue-specific serotonin receptor 2A KO (Htr2a FKO) mice and analyzed their phenotypes during high-fat diet (HFD) induced obesity.
Results: Tph1 FKO mice fed HFD exhibited reduced lipid accumulation, increased thermogenesis, and resistance to obesity. In ad-dition, Htr2a FKO mice fed HFD showed reduced lipid accumulation in white adipose tissue and resistance to obesity.
Conclusion: These data suggest that the inhibition of serotonin signaling might be an effective strategy in obesity.
Keywords: Serotonin; Adipose tissue, white; Obesity; Lipogenesis
INTRODUCTION
Obesity is a chronic disease resulting from an imbalance be-tween energy ingested and energy expended and has been rec-ognized as a major risk factor for type 2 diabetes mellitus, ath-erosclerosis, metabolic syndrome, cardiovascular diseases, and various types of cancer [1]. In addition, obesity is associated with higher all-cause mortality [2]. Hence, intensive efforts
have been taken to uncover the basic mechanisms of obesity and to discover effective therapeutic targets for the treatment of obesity. However, to date, safe and efficacious therapeutics for obesity remain scarce.
Serotonin (5-hydroxytryptophan [5-HT]) is a monoamine metabolite of the essential amino acid tryptophan. Tryptophan is hydroxylated to 5-HT by tryptophan hydroxylase (TPH). TPH represents the rate-limiting step in the pathway, with the enzyme
Received: 27 November 2019, Revised: 4 March 2020, Accepted: 7 April 2020 Corresponding authors: Sangkyu Park
Department of Precision Medicine, Yonsei University Wonju College of Medicine, 20 Ilsan-ro, Wonju 26426, Korea
Tel: +82-33-741-0154, Fax: +82-33-742-5034, E-mail: [email protected]
Hail Kim
Graduate School of Medical Science and Engineering, Korea Advanced Institute of Science and Technology, 291 Daehak-ro, Yuseong-gu, Daejeon 34141, Korea
Tel: +82-42-350-4243, Fax: +82-42-350-4287, E-mail: [email protected]
*These authors contributed equally to this work.
Copyright © 2020 Korean Endocrine Society
This is an Open Access article distributed under the terms of the Creative Com-mons Attribution Non-Commercial License (https://creativecomCom-mons.org/ licenses/by-nc/4.0/) which permits unrestricted non-commercial use, distribu-tion, and reproduction in any medium, provided the original work is properly cited.
pISSN 2093-596X · eISSN 2093-5978
occurring in two isoforms. TPH1 is expressed in non-neural tis-sues and TPH2 is localized in the neural tistis-sues [3]. In the next step, 5-HT is catalyzed by L-amino acid decarboxylase to pro-duce serotonin. Since serotonin poorly crosses the blood-brain barrier, central, and peripheral serotonin represent separate sig-naling systems. Peripheral serotonin is produced in enterochro-maffin cells in the gastrointestinal tract, pancreatic β-cells, and adipocytes [4]. Serotonin synthesized in the periphery exerts a wide variety of physiological roles by interacting with serotonin receptors in the control of vasoconstriction, intestinal motility, and glucose and lipid metabolism.
Several studies have reported the possible relationships be-tween serotonin and obesity. In humans, the blood serotonin level and Tph1 expression in the duodenum has been positively correlated with body mass index [5]. The genetic analysis re-ported that Tph1 and 5-HT(2A) receptor, 5-HT(2B) receptor polymorphisms are associated with the development of obesity [6,7]. Furthermore, serotonin synthesis and serotonin levels were reportedly elevated in the liver and adipose tissue of glu-cocorticoid-induced insulin-resistant rats [8]. These reports sug-gest that obesity is associated with increased serotonin concen-trations in both serum and adipose tissue.
Recent studies have reported that the inhibition of peripheral serotonin results in resistance to obesity and reduced lipid accu-mulation in peripheral tissues [9-11]. This suggests a link be-tween peripheral serotonin and energy balance. However, the metabolic phenotypes of adipose tissue-specific Tph1 and its re-ceptor knockout mice have not been reported. Therefore, in this study, we generated adipose tissue specific Tph1 knockout (Tph1 FKO) mice and adipose tissue-specific serotonin receptor 2A knockout (Htr2a FKO) mice and analyzed their metabolic phenotypes. We observed that the deletion of Tph1 in adipose tissue resulted in a resistance to high-fat diet (HFD) induced obesity, increased thermogenesis, and reduced lipid accumula-tion in the adipose tissue. Furthermore, Htr2a FKO mice dem-onstrated resistance to obesity, with reduced lipid accumulation in the adipose tissue. Our studies contribute to the information regarding serotonin function in adipocyte metabolism and indi-cate that targeting Tph1 and Htr2a in the adipose tissue could be a potential treatment strategy to manage obesity and related metabolic diseases.
METHODS
Animal experiments
The generation of Tph1-floxed mice, Htr2a-floxed mice, and
adiponectin (Adipoq)-Cre mice have previously been reported [11-13]. C57BL/6 J mice were purchased from Charles River Japan (Yokohama, Japan). Tph1 FKO mice were crossed with uncoupled protein 1 (Ucp1)-luciferase transgenic mice. The mice were housed in climate-controlled, specific pathogen-free barrier facilities, under a 12-hour light-dark cycle, with chow and water provided ad libitum. Male mice (aged 8 weeks) were fed either a standard chow diet (SCD; 12% fat calories, Re-search Diets D10001) or an HFD (60% fat calories, ReRe-search Diets D12492). In case of the transgenic mice, we compared the data between KO mice and their wild type (WT) littermates. The experimental protocols for this study were approved by the Institutional Animal Care and Use Committee (LML 15-535) at the Korea Advanced Institute of Science and Technology. These experiments were performed unblinded.
Metabolic analysis
The mice were housed individually in a 12-chamber, open-cir-cuit Oxymax/CLAMS (Columbus Instruments Comprehensive Lab Animal Monitoring system) system and the metabolic rate was measured as previously described [11]. After one day of ac-climation, each mouse was assessed for 72 hours in the fed state to assess the metabolic rates. The respiratory exchange ratio (RER=VCO2/VO2) and heat production (HP=3.185×VO2+
1.232×VCO2) were calculated. Fat mass and lean body mass
were measured using Minispec time-domain nuclear magnetic resonance analyzer (Bruker Optics, Billerica, MA, USA).
Glucose tolerance test and insulin tolerance test
To perform the glucose tolerance test, the mice were fasted overnight. Then, 2 g/kg D-glucose in phosphate-buffered saline (PBS) was intraperitoneally injected into the mice. For the insu-lin tolerance test (ITT), 0.75 U/kg human insuinsu-lin (Humuinsu-lin R, Lilly, Indianapolis, IN, USA) was intraperitoneally injected into 6 hours fasted mice. Blood samples were collected from the tail vein and glucose concentrations were measured using a Gluco DR plus glucometer (Allmedicus, Anyang, Korea) as previously described [10].
Quantitative real-time polymerase chain reaction analysis
Total RNA extractions from the mice adipose tissues were per-formed using TRIzol as previously described [14]. After TUR-BO DNase (Invitrogen, Waltham, MA, USA) treatment, 2 μg of total RNA was used to generate complementary DNA with Su-perscript III reverse transcriptase (Invitrogen) according to the manufacturer’s protocol. Quantitative real-time polymerase
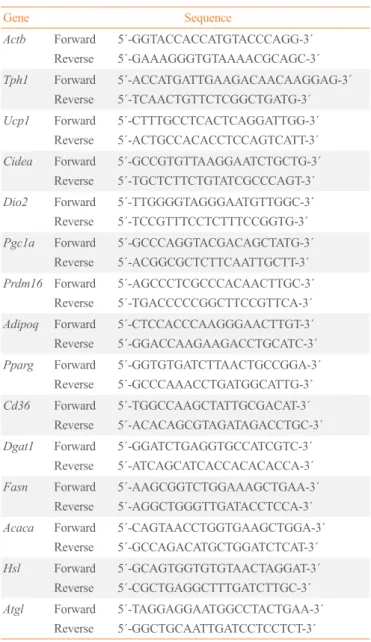
chain reaction (RT-PCR) was performed with Fast SYBR Green Master Mix (Applied Biosystems, Foster City, CA, USA) and a ViiA 7 Real-time PCR system (Applied Biosystems). Gene ex-pressions were analyzed using the delta-delta Ct method as pre-viously described [11]. The primer sequences are presented in Table 1.
Cell culture
Murine 3T3-L1 cells (American Type Culture Collection) were cultured in Dulbecco’s Modified Eagle Medium (DMEM) sup-plemented with 10% fetal calf serum and 100 μg/mL penicillin/ streptomycin in a humidified atmosphere of 5% CO2 at 37°C.
Cells were differentiated and analyzed as previously described [10]. Immunostaining was performed on differentiated day 8.
Histological analysis
Inguinal, epididymal, and interscapular adipose tissues were harvested, fixed in 4% (w/v) paraformaldehyde in PBS and em-bedded in paraffin. Next, 5-μm-thick tissue sections were depa-raffinized, rehydrated, and used for hematoxylin and eosin staining, immunohistochemistry and immunofluorescence [10]. In vivo luciferase assay
We obtained Ucp1-luciferase mice from the laboratory of Dr. Shingo Kajimura (University of California, San Francisco) [15]. Briefly, 150 mg/kg of D-Luciferin potassium salt (GoldBio, St. Louis, MO, USA) was injected into WT and Tph1 FKO with Ucp1-luciferase fed SCD or HFD. Fifteen minutes post-injec-tion, we detected luciferase activity using IVIS Lumina S5, us-ing the Livus-ing Image software (PerkinElmer, Waltham, MA, USA) to setup (autoexposure), analyze, and organize data.
Validation of gene expression using nanostring
The correlations of BXD white adipose tissue (WAT; subcutane-ous fat) Tph1 mRNA and phenotypes were analyzed by using database (http://www.genenetwork.org/). The comparison of Tph1 mRNA levels and total 2000 phenotypes correlated with Tph1 in the WAT expressed by the volcano plot. The X axis rep-resents Spearman’s Rho, with positive values representing posi-tive correlations and negaposi-tive values representing negaposi-tive cor-relations, and the y-axis representing inversed P values. The gray horizontal solid line on the y-axis are statistically signifi-cant with a P value of less than 0.5, while the vertical solid line on the x-axis has a blue or red color with only Rho values great-er than 0.5 (right) or less than –0.5 (left). Expressed in color can be viewed as having a positive or negative correlation. Marked
in red is the metabolic phenotype. The result was obtained with-out bias using the whole withwith-out excluding one value from the entire BXD data.
Statistics
All values are expressed as the mean±standard error of the
Table 1. List of Primers Used for Real Time Quantitative
Poly-merase Chain Reaction
Gene Sequence Actb Forward Reverse 5´-GGTACCACCATGTACCCAGG-3´ 5´-GAAAGGGTGTAAAACGCAGC-3´ Tph1 Forward Reverse 5´-ACCATGATTGAAGACAACAAGGAG-3´ 5´-TCAACTGTTCTCGGCTGATG-3´ Ucp1 Forward Reverse 5´-CTTTGCCTCACTCAGGATTGG-3´ 5´-ACTGCCACACCTCCAGTCATT-3´ Cidea Forward Reverse 5´-GCCGTGTTAAGGAATCTGCTG-3´ 5´-TGCTCTTCTGTATCGCCCAGT-3´ Dio2 Forward Reverse 5´-TTGGGGTAGGGAATGTTGGC-3´ 5´-TCCGTTTCCTCTTTCCGGTG-3´ Pgc1a Forward Reverse 5´-GCCCAGGTACGACAGCTATG-3´ 5´-ACGGCGCTCTTCAATTGCTT-3´ Prdm16 Forward Reverse 5´-AGCCCTCGCCCACAACTTGC-3´ 5´-TGACCCCCGGCTTCCGTTCA-3´ Adipoq Forward Reverse 5´-CTCCACCCAAGGGAACTTGT-3´ 5´-GGACCAAGAAGACCTGCATC-3´ Pparg Forward Reverse 5´-GGTGTGATCTTAACTGCCGGA-3´ 5´-GCCCAAACCTGATGGCATTG-3´ Cd36 Forward Reverse 5´-TGGCCAAGCTATTGCGACAT-3´ 5´-ACACAGCGTAGATAGACCTGC-3´ Dgat1 Forward Reverse 5´-GGATCTGAGGTGCCATCGTC-3´ 5´-ATCAGCATCACCACACACCA-3´ Fasn Forward Reverse 5´-AAGCGGTCTGGAAAGCTGAA-3´ 5´-AGGCTGGGTTGATACCTCCA-3´ Acaca Forward Reverse 5´-CAGTAACCTGGTGAAGCTGGA-3´ 5´-GCCAGACATGCTGGATCTCAT-3´ Hsl Forward Reverse 5´-GCAGTGGTGTGTAACTAGGAT-3´ 5´-CGCTGAGGCTTTGATCTTGC-3´ Atgl Forward Reverse 5´-TAGGAGGAATGGCCTACTGAA-3´ 5´-GGCTGCAATTGATCCTCCTCT-3´
Actb, beta-actin; Tph1, tryptophan hydrxylase 1; Ucp1, uncoupled protein 1; Cidea, cell death-inducing DNA fragmentation factor alpha-like effector A; Dio2, iodothyronine deiodinase 2; Pgc1a, peroxisome proliferator-activated
receptor gamma coactivator 1-alpha; Prdm16, PR/SET domain 16; Adipoq, adiponectin; Pparg, peroxisome proliferator-activated receptor gamma;
Cd36, cluster of differentiation 36; Dgat1, diacylglycerol O-acyltransferase
1; Fasn, fatty acid synthase; Acaca, acetyl-coA carboxylase alpha; Hsl, hor-mone sensitive lipase; Atgl, adipose triglyceride lipase.
5 4 3 2 1 0 50 40 30 20 10 0 25 20 15 10 5 0 2.0 1.5 1.0 0.5 0 600 400 200 0 100 80 60 40 20 0 −log10 (P value) Body weight (g) Body fat (%)
Tissue weight (g) Blood glucose (mg/dL)
Lean body (%) HFD
Spearman’s rank correlation coefficient (Rho)
Age (wk) HFD WT-SCD Tph1 FKO-SCD WT-HFD Tph1 FKO-HFD −1.0 −0.5 0 0.5 1.0 4 5 6 7 8 9 10 11 12 13 14 15 16 17 18 19 20 SCD iWAT 30 60 90 120 SCD iWAT WT FKOTph1 eWAT WT Tph1FKO BAT WT FKOTph1 WT WT Tph1 FKO Tph1 FKO HFD
eWAT Time (min)
20 wk
BAT
HFD
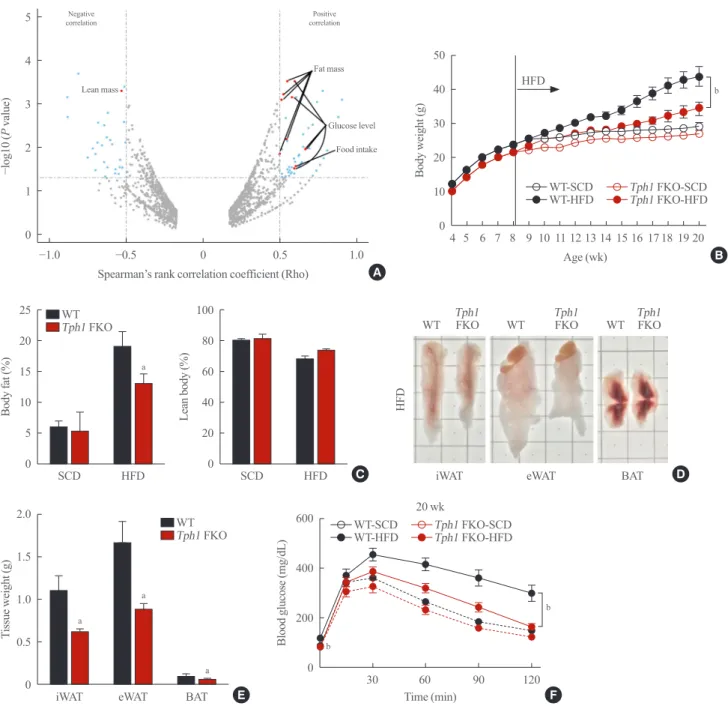
Fig. 1. Tryptophan hydroxylase 1 (Tph1) knockout (FKO) protects against high-fat diet (HFD)-induced obesity. (A) Volcano plot for mRNA
expression of adipose tissue from the BXD strains. (B) Bodyweight curves in wild type (WT) and Tph1 FKO mice fed standard chow diet (SCD) or HFD for 12 weeks. Bodyweight of WT and Tph1 FKO mice were measured weekly from week 4 to week 20; n=5 in each group fed SCD, n=8 in each group fed HFD. (C). Body fat and lean body mass of mice after 12 weeks of HFD feeding. (D, E) Gross appearance and fat mass of visceral, inguinal and brown fat of 20-week-old WT and Tph1 FKO mice (left) fed on HFD. Adipose tissue weight (right); n=7 in each group. (F) Glucose tolerance tests. Blood glucose concentrations were measured at the indicated time points after fasted for 16 hours; n=10 in each group fed HFD. iWAT, inguinal white adipose tissue; eWAT, epidydimal white adipose tissue; BAT, brown adipose tis-sue. aP<0.05; bP<0.01 indicated significance.
A B C E F D Negative correlation Lean mass Positive correlation Fat mass Glucose level Food intake a a a a b b b WT-SCD Tph1 FKO-SCD WT-HFD Tph1 FKO-HFD
mean. Statistical significance was determined by Student’s t test or two-way analysis of variance (ANOVA) with Bonferroni’s post hoc test. Two-way ANOVA was performed in body weight (Figs. 1B, 4B), glucose tolerance test (Fig. 1F, Supplemental
Fig. S3B), ITT (Supplemental Figs. S2A, S3C), and energy ex-penditure assays (Fig. 2A, Supplemental Figs. S1E, S2B). P<0.05 was considered statistically significant.
5,500 5,000 4,500 4,000 3,500 3,000 2,500 4,000 3,500 3,000 2,500 2,000 25 20 15 10 VO 2 (mL/kg/hr) VCO 2 (mL/kg/hr) Heat (kcal/hr/kg)
Light cycle Light cycle Light cycle
b a a
b a b
Dark cycle Dark cycle Dark cycle
VO2 VCO2 Heat
7:00 AM 7:00 PM 7:00 AM 7:00 AM 7:00 PM 7:00 AM 7:00 AM 7:00 PM 7:00 AM
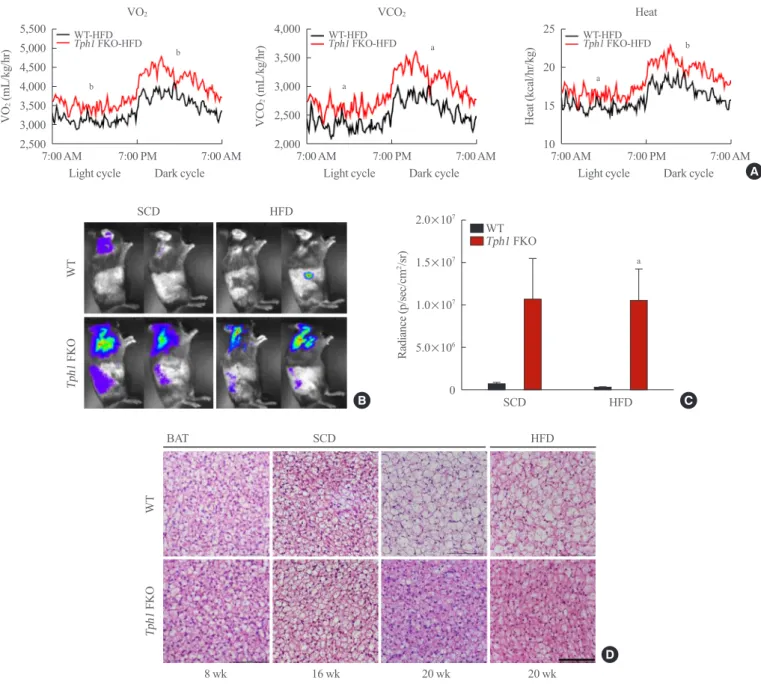
Fig. 2. Tryptophan hydroxylase 1 (Tph1) knockout (FKO) increased energy expenditure. (A) Oxygen (O2) consumption (left), carbon
diox-ide (CO2) production (middle) and heat production (right) in wild type (WT) and Tph1 FKO mice fed on high-fat diet (HFD) for 12 weeks; n=8 in each group fed HFD. (B, C) In vivo luciferase assay of WT and Tph1 FKO mice. Tph1 FKO mice show increased uncoupled protein 1 (UCP1) activity. (D) Histological analysis of brown adipose tissue (BAT) at the indicated age. Adipose tissue sections were stained with H&E (scale bar, 100 μm). SCD, standard chow diet. aP<0.05; bP<0.01 indicated significance.
A
WT-HFD WT-HFD WT-HFD
Tph1 FKO-HFD Tph1 FKO-HFD Tph1 FKO-HFD
2.0×10⁷ 1.5×10⁷ 1.0×10⁷ 5.0×10⁶ 0 Radiance (p/sec/cm 2/sr) SCD WT Tph1 FKO HFD B C a WT Tph1 FKO SCD HFD D WT Tph1 FKO BAT SCD HFD
RESULTS
Serotonin depletion in adipose tissue reduced weight gain and body fat mass in mice fed high-fat diet
To investigate whether serotonin is associated with body weight and composition, we analyzed RNA expression in WAT of the BXD family from GeneNetwork. Tph1 mRNA expression has
shown a positive correlation with fat mass and glucose levels and a negative correlation with lean mass (Fig. 1A). We hypoth-esized that if serotonin increase by TPH1 in WAT has a positive correlation with increased fat mass, serotonin depletion in WAT may reduce fat mass and body weight gain. Previously, we gen-erated inducible Tph1 knockout (adipocyte protein [aP2]-Cre-ERT2+/−/Tph1 flox/flox) mice and reported that serotonin depletion
at the adult stage prevents HFD induced obesity [10]. In this study, we investigated the role of peripheral serotonin in mature adipocytes in the basal status as well as overnutrition status. For this, we generated adipocyte-specific Tph1 knockout (Adipoq-Cre+/−/Tph1 flox/flox, Tph1 FKO) mice and analyzed the
pheno-types of these mice at young and mature adult stages (Supple-mental Fig. S1A, B). The Ap2 gene can be expressed in adipo-cyte progenitors and other tissues [16,17]. Notably, Adipoq gene expression is more specific in mature adipocytes than the Ap2 gene expression [18]. In young adults (8 weeks of age), Tph1 FKO mice did not show significant difference in body weight compared to WT mice (Fig. 1B). However, inn mature adults (20 weeks of age), Tph1 FKO mice demonstrated lower body weight and fat mass compared to the WT group when fed a HFD (Fig. 1B, Supplemental Fig. S1C, D). These results are consistent with the correlation analysis of the BXD reference group (Fig. 1A).
To explain the result, we measured the energy expenditure in these mice groups. As expected, Tph1 FKO mice with SCD feeding showed increased energy expenditure (increase VO2,
VCO2, and HP) compared to WT mice fed SCD (Supplemental
Fig. S1E). Under HFD conditions, after 12 weeks on HFD, these differences observed between Tph1 FKO and WT mice are greater than those observed under SCD conditions. Tph1 FKO fed the HFD showed reduced weight gain and lower body fat mass compared to WT mice (Fig. 1B-D). Notably, Tph1 FKO mice fed the HFD reported an improvement in glucose tolerance and insulin resistance when compared to WT mice fed the HFD (Fig. 1F, Supplemental Fig. S2A).
Serotonin depletion in adipocytes increased thermogenesis in brown adipose tissue
Tph1 FKO mice fed the HFD demonstrated increased energy expenditure (Fig. 2A, Supplemental Fig. S2B) compared to WT. To elucidate this phenotype, we generated in vivo reporter sys-tem for brown adipose tissue (BAT) activity using Ucp1-lucifer-ase reporter mice [15]. Fig. 2B shows increUcp1-lucifer-ased luciferUcp1-lucifer-ase activ-ity in the BAT area of Tph1 FKO and WT mice. Tph1 FKO mice fed the SCD and HFD showed significantly increased lu-ciferase activity compared to WT mice fed the SCD and HFD (Fig. 2C). Then, we analyzed the histologic changes in BAT by aging. At 8 weeks of age, brown adipocytes in Tph1 FKO mice and WT mice appeared identical (Fig. 2D). This is consistent with their body weight at 8 weeks of age (Fig. 1B). As the mice grew older, from 8 to 20 weeks of age, the size of adipose cells and lipid droplets increased. However, Tph1 FKO BAT
main-tained a similar size of adipose cells at 20 weeks of age, even after 12 weeks of HFD (Fig. 2D).
Serotonin regulated beige adipocytes formation and lipid accumulation in WAT
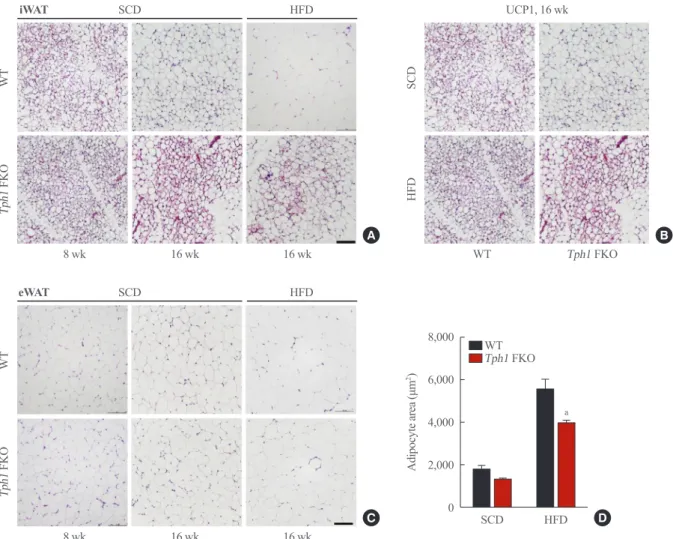
Previously, we reported that serotonin depletion in the subcuta-neous adipose tissue induced beige adipocyte formation in mice fed the HFD [10]. We observed similar changes after depleting serotonin in mature subcutaneous adipose tissue after HFD (Fig. 3A). Interestingly, serotonin depletion also increased beige adi-pocyte formation in the subcutaneous adipose tissue of mice fed the SCD (Fig. 3B). In visceral adipose tissue, Tph1 FKO mice fed HFD demonstrated a reduced adipose cell size and lipid droplets compared to WT mice fed on the HFD (Fig. 3C, D). Under the SCD conditions, Tph1 FKO mice did not indicate significant differences in the visceral adipose tissue compared to WT mice (Fig. 3C).
Serotonin regulated lipogenesis in adipose tissue through Htr2a
Previously, we identified the role of HTR2A in 3T3-L1 adipo-cytes [10]. In 3T3-L1 cell lines, HTR2A agonist increased lipo-genesis gene expression in differentiated 3T3-L1 adipocytes [10]. Using these in vitro data, we suggested that HTR2A may regulate lipogenesis in WAT. To evaluate this hypothesis, we performed both in vitro and in vivo studies. We observed the lip-id accumulation process in the in vitro system. We stained dif-ferentiated 3T3-L1 adipocytes with lipid (green, BODIPY 493/503) and serotonin (red, 5-HT). Fig. 4A shows the presence of serotonin and lipid droplets in differentiated 3T3-L1 adipo-cytes. Interestingly, we observed 5-HT and BODIPY copositive adipocytes (white arrowhead, Fig. 4A). The yellow staining im-plied that serotonin is related to lipid accumulation. According-ly, the lipogenic gene and Htr2a gene expressions, in 3T3-L1 adipocytes, were increased during differentiation (Supplemental Fig. S3A).
Next, we generated adipocyte-specific Htr2a knockout (Adi-poq-Cre+/−/Htr2a flox/flox, Htr2a FKO) mice. Htr2a FKO mice fed
the HFD demonstrated a lower body weight gain and improved glucose tolerance compared to WT mice fed the HFD (Fig. 4B, Supplemental Fig. S3B, C). As expected, the adipose cell size and lipid droplets were decreased not only in the visceral adi-pose tissue but also in subcutaneous and BAT of Htr2a FKO mice (Fig. 4C, D, Supplemental Fig. S3D, E). The gene expres-sion analysis also showed reduced lipogenic gene expresexpres-sion in Htr2a FKO mice (Fig. 4E). These in vivo data strongly
suggest-ed that HTR2A in WAT regulates lipogenesis.
DISCUSSION
Recent studies have reported that serotonin regulates energy metabolism in peripheral tissues such as the adipose tissue and liver [9-11,19]. Regarding the HFD condition, HFD increases serotonin levels in the adipose tissue [10]. The inhibition of se-rotonin synthesis increased energy expenditure and thermogen-esis in BAT of mice fed the HFD [9,10]. In the liver, gut-derived serotonin regulates lipid accumulation [11,19]. These data con-sistently show a strong association between serotonin and lipid metabolism.
In this study, we investigated the role of serotonin in mature
adipocytes under basal and overnutrition conditions. When we depleted serotonin levels genetically, the mice demonstrated re-sistance to obesity, increased energy expenditure, and elevated BAT activity (Figs. 1B-E, 2A-D). The WAT of HFD-fed mice maintained similar sizes of cell and lipid droplets to adipocytes in SCD-fed mice (Fig. 3C), suggesting that high serotonin leads to obesity-prone adipocytes by increasing lipogenesis and re-ducing thermogenesis.
In terms of energy metabolism, we observed an increased HP in the mice fed SCD as well as HFD (Fig. 2A, Supplemental Fig. S1E). Under low serotonin conditions, UCP1 activity in BAT and beige adipocyte were increased in the subcutaneous adipose tissue of both SCD- and HFD-fed Tph1 FKO mice (Figs. 2C, 2D, 3A, 3B). This implied that basal serotonin in
ma-Fig. 3. Representative images of adipose tissues of tryptophan hydroxylase 1 (Tph1) knockout (FKO) mice. (A) Histological analysis of
iWAT at the indicated age. Adipose tissue was stained with H&E. (B) Immunostaining of UCP1 in iWAT (scale bar, 100 μm). (C) Histologi-cal analysis of eWAT at the indicated age. Adipose tissue sections were stained with H&E (sHistologi-cale bar, 100 μm). (D) The adipocyte size was analyzed using ImageJ software (NIH). iWAT, inguinal white adipose tissue; UCP1, uncoupled protein 1; eWAT, epididymal white adipose tissue; SCD, standard chow diet; HFD, high-fat diet; WT, wild type. aP<0.05 indicated significance.
A C B D WT WT SCD Tph1 FKO Tph1 FKO HFD iWAT eWAT SCD SCD UCP1, 16 wk 8 wk 8 wk WT 16 wk 16 wk Tph1 FKO 16 wk 16 wk HFD HFD 8,000 6,000 4,000 2,000 0 Adipocyte area (μm 2) SCD WT Tph1 FKO HFD a
50 40 30 20 10 0 Body weight (g) Age (wk) HFD WT-SCD Htr2a FKO-SCD WT-HFD Htr2a FKO-HFD 8 9 10 11 12 13 14 15 16
Fig. 4. Inhibition of adipose tissue-specific serotonin receptor 2A (HTR2A) signaling reduces lipid accumulation in white adipose tissue
(WAT). (A) Representative images of immunofluorescence staining of differentiated 3T3-L1 adipocytes with BODIPY (green), anti-5-hy-droxytryptophan (5-HT) antibody (red), and 4′,6-diamidino-2-phenylindole (DAPI; blue). White arrow indicates BODIPY and 5-HT co-positive cells. (B) Body weight curves in wild type (WT) and Htr2a FKO mice fed standard chow diet (SCD) or high-fat diet (HFD) for 12
weeks. (C) Histological analysis of epididymal white adipose (eWAT) in of WT and Htr2a FKO mice fed SCD or HFD. (D) The adipocyte
sizes were analyzed using the ImageJ program. (E) mRNA expression level of fatty acid synthesis (Acaca, Fasn, Scd1), triglyceride synthe-sis (Dgat1, Dgat2, Gpam, Mogat1), and Plin1. Acaca, acetyl-coA carboxylase alpha; Fasn, fatty acid synthase; Scd1, stearoyl-CoA desatu-rase 1; Dgat1, diacylglycerol O-acyltransferase 1; Dgat2, diacylglycerol O-acyltransferase 2; Gpam, glycerol-3-phosphate acyltransferase, mitochondrial; Mogat1, monoacylglycerol O-acyltransferase 1; Plin1, perilipin 1. aP<0.05; bP<0.001 indicated significance.
A B b C D E SCD HFD WT Htr2a FKO 8,000 6,000 4,000 2,000 0 1.5 1.0 0.5 0 1.5 1.0 0.5 0 5 4 3 2 1 0 2.5 2.0 1.5 1.0 0.5 0 1.5 1.0 0.5 0 1.5 1.0 0.5 0 1.5 1.0 0.5 0 2.5 2.0 1.5 1.0 0.5 0 Adipocyte size (μm 2)
Relative expression Relative expression Relative expression Relative expression
Relative expression Relative expression Relative expression Relative expression
SCD SCD SCD SCD SCD SCD SCD SCD SCD WT WT Htr2a FKO Htr2a FKO HFD HFD HFD HFD HFD HFD HFD HFD HFD a a a a a a a a eWAT
Acaca Dgat1 Dgat2 Fasn
ture adipocytes suppresses thermogenic activity in BAT and beige adipocyte formation in WAT. Furthermore, this finding expands the clinical importance of peripheral serotonin. If sero-tonin suppresses energy dissipation even under basal conditions, the anti-obesity effect of serotonin inhibition may be observed irrespective of the serotonin levels in adipose tissue. Intriguing-ly, Tph1 FKO mice demonstrated an increased food intake dur-ing both SCD and HFD feeddur-ing (Supplemental Figs. S1E, S2B). However, we failed to elucidate the exact underlying mecha-nism which could explain this behavioral change. The second-ary effects could be attributed to the increased energy expendi-ture or unknown alterations in the lipid-brain axis due to sero-tonin deficiency. Nonetheless, Tph1 FKO mice demonstrate re-sistance to obesity despite the increased food intake.
With regard to lipogenesis in WAT, we focused on HTR2A. Several studies, including our group, have shown that HTR2A has a role in lipogenesis in 3T3-L1 cells [10,20]. In this study, we generated Htr2a FKO mice and observed that serotonin de-pleted WAT demonstrated reduced adipose cell sizes and lipid droplets (Fig. 4C, D), suggesting that HTR2A mediates the lipo-genic changes in WAT. Moreover, these changes were only ob-served in the WAT of HFD-fed Htr2a FKO mice. The WAT of SCD-fed mice was similar to the WAT of WT mice. This im-plied that elevated serotonin, not basal serotonin, regulates lipo-genesis in WAT under overnutrition conditions.
We reported that HTR3 is the responsible receptor that regu-lates thermogenesis in BAT [10]. Concerning the formation of beige adipocytes in the subcutaneous adipose tissue, we ob-served several UCP1 positive adipocytes in the subcutaneous adipose tissue of Tph1 FKO mice (Fig. 3B). This implied that the inhibition of serotonin synthesis induced beige adipocyte formation. However, the exact process of beige adipocyte for-mation after serotonin depletion remains unclear, necessitating further evaluation of the role of serotonin in the fate of pre-adi-pocyte, UCP1 positive adipocyte recruitment, and activation. Furthermore, we plan to investigate the responsible receptors regulating this change in the subcutaneous adipose tissue.
In conclusion, adipocyte-derived serotonin regulates lipogen-esis and thermogenlipogen-esis in the adipose tissue. Inhibition of sero-tonin synthesis in mature adipocytes reduced lipid accumulation in visceral WAT, induced beige formation in subcutaneous WAT and increased thermogenesis in BAT. In addition, serotonin in-creased lipogenesis through HTR2A signaling in visceral adi-pose tissue. Therefore, HTR2A inhibition, as well as TPH1 in-hibitor, might be an effective treatment strategy for obesity, es-pecially in case of visceral obesity.
CONFLICTS OF INTEREST
No potential conflict of interest relevant to this article was re-ported.
ACKNOWLEDGMENTS
This research was supported by the Basic Science Research Pro-gram through the National Research Foundation of Korea (NRF) funded by the Ministry of Education (2016R1A6A3A04010466 to Chang-Myung Oh, 2019M3A9A8066460 to Sangkyu Park, and 2016M3A9B6902871 to Hail Kim). BXD family mice data were taken from GeneNetwork database (www.genenetwork. org).
AUTHOR CONTRIBUTIONS
Conceptualization: C.M.O., S.P., H.K. Acquisition, analysis, and interpretation of data: K.E.S., C.M.O., J.N. Drafting the work and revising: K.E.S., C.M.O., J.N., S.P., H.K. Final approval of the manuscript: S.P., H.K.
ORCID
Ko Eun Shong https://orcid.org/0000-0002-2677-8537 Chang-Myung Oh https://orcid.org/0000-0001-6681-4478 Sangkyu Park https://orcid.org/0000-0001-5525-2860 Hail Kim https://orcid.org/0000-0002-6652-1349
REFERENCES
1. Van Gaal LF, Mertens IL, De Block CE. Mechanisms linking obesity with cardiovascular disease. Nature 2006;444:875-80.
2. Flegal KM, Kit BK, Orpana H, Graubard BI. Association of all-cause mortality with overweight and obesity using stan-dard body mass index categories: a systematic review and meta-analysis. JAMA 2013;309:71-82.
3. Walther DJ, Peter JU, Bashammakh S, Hortnagl H, Voits M, Fink H, et al. Synthesis of serotonin by a second tryptophan hydroxylase isoform. Science 2003;299:76.
4. Gershon MD, Tack J. The serotonin signaling system: from basic understanding to drug development for functional GI disorders. Gastroenterology 2007;132:397-414.
5. Young RL, Lumsden AL, Martin AM, Schober G, Pezos N, Thazhath SS, et al. Augmented capacity for peripheral
sero-tonin release in human obesity. Int J Obes (Lond) 2018;42: 1880-9.
6. Li P, Tiwari HK, Lin WY, Allison DB, Chung WK, Leibel RL, et al. Genetic association analysis of 30 genes related to obesity in a European American population. Int J Obes (Lond) 2014;38:724-9.
7. Kwak SH, Park BL, Kim H, German MS, Go MJ, Jung HS, et al. Association of variations in TPH1 and HTR2B with gestational weight gain and measures of obesity. Obesity (Silver Spring) 2012;20:233-8.
8. Li T, Guo K, Qu W, Han Y, Wang S, Lin M, et al. Important role of 5-hydroxytryptamine in glucocorticoid-induced insu-lin resistance in liver and intra-abdominal adipose tissue of rats. J Diabetes Investig 2016;7:32-41.
9. Crane JD, Palanivel R, Mottillo EP, Bujak AL, Wang H, Ford RJ, et al. Inhibiting peripheral serotonin synthesis reduces obesity and metabolic dysfunction by promoting brown adi-pose tissue thermogenesis. Nat Med 2015;21:166-72.
10. Oh CM, Namkung J, Go Y, Shong KE, Kim K, Kim H, et al. Regulation of systemic energy homeostasis by serotonin in adipose tissues. Nat Commun 2015;6:6794.
11. Choi W, Namkung J, Hwang I, Kim H, Lim A, Park HJ, et al. Serotonin signals through a gut-liver axis to regulate he-patic steatosis. Nat Commun 2018;9:4824.
12. Yadav VK, Ryu JH, Suda N, Tanaka KF, Gingrich JA, Schutz G, et al. Lrp5 controls bone formation by inhibiting serotonin synthesis in the duodenum. Cell 2008;135:825-37.
13. Eguchi J, Wang X, Yu S, Kershaw EE, Chiu PC, Dushay J, et al. Transcriptional control of adipose lipid handling by IRF4. Cell Metab 2011;13:249-59.
14. Rio DC, Ares M Jr, Hannon GJ, Nilsen TW. Purification of RNA using TRIzol (TRI reagent). Cold Spring Harb Protoc 2010;2010:pdb.prot5439.
15. Galmozzi A, Sonne SB, Altshuler-Keylin S, Hasegawa Y, Shinoda K, Luijten IHN, et al. ThermoMouse: an in vivo model to identify modulators of UCP1 expression in brown adipose tissue. Cell Rep 2014;9:1584-93.
16. Shan T, Liu W, Kuang S. Fatty acid binding protein 4 ex-pression marks a population of adipocyte progenitors in white and brown adipose tissues. FASEB J 2013;27:277-87.
17. Lee KY, Russell SJ, Ussar S, Boucher J, Vernochet C, Mori MA, et al. Lessons on conditional gene targeting in mouse adipose tissue. Diabetes 2013;62:864-74.
18. Chakrabarti P. Promoting adipose specificity: the adiponec-tin promoter. Endocrinology 2010;151:2408-10.
19. Sumara G, Sumara O, Kim JK, Karsenty G. Gut-derived se-rotonin is a multifunctional determinant to fasting adapta-tion. Cell Metab 2012;16:588-600.
20. Kinoshita M, Ono K, Horie T, Nagao K, Nishi H, Kuwabara Y, et al. Regulation of adipocyte differentiation by activation of serotonin (5-HT) receptors 5-HT2AR and 5-HT2CR and involvement of microRNA-448-mediated repression of KLF5. Mol Endocrinol 2010;24:1978-87.