The Positive Association between Peripheral Blood Cell Counts
and Bone Mineral Density in Postmenopausal Women
Hack-Lyoung Kim,
1,2Hwa Young Cho,
3In Young Park,
1Jin Man Choi,
1Min Kim,
1Ho Jin Jang,
1and Se-Min Hwang
41Department of Internal Medicine, Armed Forces Seoul Hospital, Seoul; 2Department of Internal Medicine, Seoul National University Hospital, Seoul;
3Department of Internal Medicine, Hanyang University Guri Hospital, Guri; 4Department of Preventive Medicine, The Armed Forces Medical Commands, Seongnam, Korea.
Received: October 11, 2010 Revised: November 29, 2010 Accepted: November 29, 2010
Corresponding author: Dr. Hack-Lyoung Kim, Department of Internal Medicine, Armed Forces Seoul Hospital, 165 Sogyeok-dong, Jongno-gu, Seoul 110-200, Korea.
Tel: 82-2-397-3709, Fax: 82-2-397-3999 E-mail: khl2876@gmail.com
∙ The authors have no financial conflicts of interest.
© Copyright:
Yonsei University College of Medicine 2011
This is an Open Access article distributed under the terms of the Creative Commons Attribution Non-Commercial License (http://creativecommons.org/ licenses/by-nc/3.0) which permits unrestricted non-commercial use, distribution, and reproduction in any medium, provided the original work is properly cited.
Purpose: Accumulating evidence has shown a close connection between hemato-poiesis and bone formation. Our aim was to evaluate the association between pe-ripheral blood cell counts and bone mineral density (BMD) in a sample of
post-menopausal women. Materials and Methods: Three hundreds thirty eight healthy
postmenopausal women who underwent BMD measurement during their health check-up were investigated. BMD was measured by dual energy X-ray asorptiome-try at L1-L4 spine, femoral neck and total proximal femur. BMD was expressed as a T-score: among T-scores obtained from three different sites (L1-L4 spine, femo-ral neck and total proximal femur), the lowest T-score was considered to be the subject’s T-score. Results: The prevalence of osteopenia and osteoporosis diag-nosed by T-score in the study participants were 49.4% (167/338) and 5.0% (17/338), respectively. Peripheral blood white blood cell (WBC), red blood cell (RBC) and platelet counts had significant positive correlations with T-scores (p<0.001) upon simple linear regression analysis. A multiple linear regression analysis, after con-trolling of confounders including age, body weight, systolic blood pressure, alka-line phosphatase and creatinine, showed that WBC (β=0.127; standard error=0.043;
p=0.014), RBC (β=0.192; standard error=0.139; p<0.001) and platelet (β=0.097;
standard error=0.001; p=0.050) counts still had significant positive association with T-scores. Conclusion: The study results showed a positive relationship between blood cell counts and bone mineral density in postmenopausal women, supporting the idea of a close connection between hematopoiesis and bone formation. The study results also suggest that blood cell counts could be a putative marker for esti-mating BMD in postmenopausal women.
Key Words: Association, blood cells, bone density, postmenopause
INTRODUCTION
Osteoporosis is a condition characterized by decreased bone mass and strength with increased fragility that predisposes the bone to fractures.1 Osteoporosis is
test. Among these women, 338 healthy postmenopausal women were included in this study and the remaining 286 were excluded based on the following criteria: 1) premeno-pausal, 2) currently being treated with hormonal replacement therapy and/or any medication for osteoporosis (calcium, vi-tamin D and its derivatives, bisphosphonate or calcitonin) and/or thiazide diuretics, 3) history of hematologic disorder, liver cirrhosis, chronic renal failure, current infection or thy-roid disease, which may affect peripheral blood cell counts or BMD and 4) unavailable information for the study vari-ables. Approval for the study protocol was obtained from the Institutional Review Board of The Armed Forces Medi-cal Commands (Seongnam, Korea). Informed consent was not obtained due to the routine nature of the information collected.
Data collection
At the hospital, a family physician performed a health check-up which included a record check for medical and medica-tion history, and recorded informamedica-tion about social habits (alcohol intake, cigarette smoking and regular exercise) us-ing a standardized questionnaire. Patients were considered to partake in alcohol when they had at least two drinks per week; they were considered to be getting regular exercise if they exercised at least three times per week for at least 30 minutes at a time. A gynecologist gathered the history of menstruation, hormonal replacement therapy and any other treatments for osteoporosis. A trained nurse measured sys-tolic and diassys-tolic blood pressure, body weight and height, and performed blood sampling after an overnight fast (≥12 hours). In addition to a complete blood count, serum levels of albumin, creatinine and total cholesterol were measured on the same day in every study subject.
The BMD of the lumbar spine (L1-L4), femoral neck and total proximal femur was measured by Dual energy X-ray absorpiometry (DXA) using the Prodigy Advance (GE Lu-nar Health Care, Madison, WI, USA). The machine was cali-brated daily with a standard phantom that was provided by the manufacturer. To evaluate BMD for the lumbar spine, the mean BMD value for L1 to L4 was used, unless the individ-ual values for one or more of these vertebrae were spuriously elevated by osteophytes or sclerotic degenerative changes. The measurements were within the precision standard of ≤1.0%. According to the WHO recommendations, T-scores were automatically calculated by software as the number of standard deviations below the average for young adults at peak bone density.10 T-scores were obtained at three
differ-most prevalent among postmenopausal women due to es-trogen deficiency and is a major health problem in that pop-ulation.1
Stable bone mass is maintained through the controlled balance between bone resorption and bone formation. Bone resorption is carried out by osteoclasts that originate from
the monocyte-macrophage lineage.1,2 New bone is formed
by osteoblasts, cells of fibroblast-stromal cell lineage that produce several bone matrix proteins and synthesize a lattice for subsequent mineralization.1,2 Osteoblasts also tightly
reg-ulate osteoclastogenesis via their expression of receptor acti-vator of NF-κB ligand and osteoprotegerin.1,2
Hematopoiesis is the process by which multipotent matopoietic stem cells (HSCs) generate and replenish he-matopoietic precursors and mature blood cells. The HSC is the central cell to hematopoiesis; it is located in the bone marrow cavity.3 Bone marrow, the soft tissue in the cavities
of bones, provides a specific microenvironment for the main-tenance, proper functioning and self-renewal of HSCs.3 In
addition to hematopoietic tissue, bone marrow hosts other types of tissue, such as the bone marrow stroma. It also supports hematopoiesis by providing an appropriate micro-environment and gives rise to different kinds of skeletal cells that contribute to bone remodeling.3 Within the stromal
com-partments, cells of osteoblastic lineage can interact with HSCs. It has been proposed that these are the main cell types responsible for regulating HSCs. They are located just next to the HSCs and support them by secreting various growth factors and adhesion molecules for hematopoiesis.4-9
In spite of this given recent progress in understanding the HSC niche through the abundant evidence supporting the linkage between osteogenesis and hematogenesis, no study showing the direct interactions between the two systems has yet been performed. Therefore, the current study was carried out to investigate the association between peripheral blood cell counts and bone mineral density (BMD), which may re-flect hematopoietic and osteogenic function, respectively.
MATERIALS AND METHODS
Subjects
Of the 1,417 women who visited the Armed Forces Seoul Hospital (Seoul, Korea) for a health check-up between Jan-uary 2005 and December 2009, 624 underwent BMD mea-surement because they wanted to check their bone health or because they agreed with doctor’s recommendation for the
determine which independent variables were associated with the BMD (Table 3). Variables that were significant (p<0.05) in the simple linear regression models (Table 2) were considered confounding factors corrected for in the multivariate analysis. Height, body mass index and body fat were not taken into account in the analysis because of eventual problems with multicollinearity.11 As expected, a
significant linear correlation was observed between T-scores and age, body weight and alkaline phosphatase (p<0.001). Systolic blood pressure and serum creatinine were also as-sociated with T-scores (p<0.05). The WBC (β=0.127; stan-ent sites (lumbar spine, femoral neck and total proximal
fe-mur), and the lowest value was used as the T-score for each subject. Subjects were grouped into three categories: normal bone mass with a T-score greater than -1.0, osteopenia with a score between -1.0 and -2.5, and osteoporosis with a T-score of less than -2.5. All DXA measurements were per-formed on the same machine, by the same operator, and an-alyzed with the same software.
Statistical analysis
Data are presented as mean values with standard deviations or percentages. Pearson’s correlation was used to determine the correlation between variables and T-scores. Simple and multiple linear regression analyses were used to estimate the association of variables of interest, including peripheral blood cell counts and T-scores. One-way analysis of vari-ances was used to compare blood cell counts according to three groups of subjects (normal, osteopenia and osteoporo-sis). A two-tailed p-value of <0.05 was considered statisti-cally significant. All data were analyzed using Statistical Package for the Social Sciences for Windows 13.0 (Chica-go, IL, USA).
RESULTS
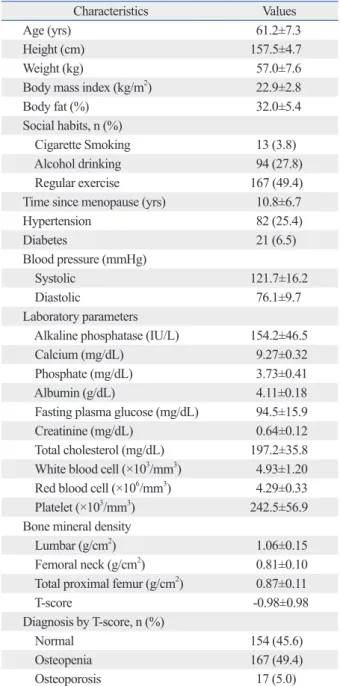
The baseline characteristics of the study participants are shown in Table 1. The mean age was 61.2±7.3 years and the mean T-score was -0.98±0.98. Time from menopause was an average of 10.8±6.7 years. The prevalences of os-teopenia and osteoporosis as diagnosed by the T-score were 49.4% (n=167) and 5.0% (n=17), respectively.
The linear correlation between peripheral blood cell counts and T-scores is shown in the scatter plots in Fig. 1. Pearson’s correlation coefficients for the white blood cell (WBC) counts, red blood cell (RBC) counts, platelet counts and T-scores were 0.297, 0.266 and 0.248, respectively (all p<0.001).
Upon simple linear regression analysis (Table 2), age, height, weight, body mass index, body fat, systolic blood pressure, alkaline phosphatase and creatinine were found to be associated with T-scores (p<0.05). The WBC, RBC and platelet counts were also significantly associated with T-scores (all p<0.001). Social habits (including cigarette smok-ing, alcohol drinking and regular exercise), diastolic blood pressure, serum albumin, fasting blood glucose and serum total cholesterol were not associated with T-scores (p>0.05).
Multiple linear regression analyses were performed to
Table 1. Baseline Characteristics of Study Participants (n=338)
Characteristics Values
Age (yrs) 61.2±7.3
Height (cm) 157.5±4.7
Weight (kg) 57.0±7.6
Body mass index (kg/m2) 22.9±2.8
Body fat (%) 32.0±5.4
Social habits, n (%)
Cigarette Smoking 13 (3.8)
Alcohol drinking 94 (27.8)
Regular exercise 167 (49.4)
Time since menopause (yrs) 10.8±6.7
Hypertension 82 (25.4) Diabetes 21 (6.5) Blood pressure (mmHg) Systolic 121.7±16.2 Diastolic 76.1±9.7 Laboratory parameters
Alkaline phosphatase (IU/L) 154.2±46.5
Calcium (mg/dL) 9.27±0.32
Phosphate (mg/dL) 3.73±0.41
Albumin (g/dL) 4.11±0.18
Fasting plasma glucose (mg/dL) 94.5±15.9
Creatinine (mg/dL) 0.64±0.12
Total cholesterol (mg/dL) 197.2±35.8
White blood cell (×103/mm3) 4.93±1.20
Red blood cell (×106/mm3) 4.29±0.33
Platelet (×103/mm3) 242.5±56.9
Bone mineral density
Lumbar (g/cm2) 1.06±0.15
Femoral neck (g/cm2) 0.81±0.10
Total proximal femur (g/cm2) 0.87±0.11
T-score -0.98±0.98
Diagnosis by T-score, n (%)
Normal 154 (45.6)
Osteopenia 167 (49.4)
Osteoporosis 17 (5.0)
Fig. 1. Scatter plots showing the linear associations between blood cell counts and T-scores. r, Pearson’s coefficient; WBC, white blood cell; RBC, red blood cell.
Table 2. Simple Linear Regression Analyses Showing the Relationship between Variables and T-Scores
Variables β (SE) t p R2
Age -0.406 (0.007) -8.133 <0.001 0.164
Height 0.285 (0.011) 5.445 <0.001 0.081
Weight 0.338 (0.007) 6.577 <0.001 0.114
Body mass index 0.232 (0.018) 4.374 <0.001 0.054
Body fat 0.155 (0.010) 2.704 0.007 0.024 Cigarette smoking 0.014 (0.278) 0.256 0.798 0.000 Alcohol drinking 0.021 (0.119) 0.382 0.703 0.000 Regular exercise -0.044 (0.107) -0.815 0.416 0.002 Hypertension 0.080 (0.125) 1.445 0.150 0.006 Diabetes -0.071 (0.222) -1.279 0.202 0.005
Systolic blood pressure -0.113 (0.003) -1.979 0.049 0.013
Diastolic blood pressure 0.016 (0.006) 0.277 0.782 0.000
Alkaline phosphatase -0.139 (0.001) -2.566 0.011 0.019
Calcium 0.067 (0.164) 1.215 0.225 0.005
Phosphate 0.012 (0.128) 0.224 0.823 0.000
Albumin 0.091 (0.288) 1.678 0.094 0.008
Fasting plasma glucose 0.029 (0.003) 0.523 0.601 0.001
Creatinine 0.112 (0.421) 2.053 0.041 0.012
Total cholesterol 0.013 (0.001) 0.231 0.818 0.000
White blood cell 0.297 (0.042) 5.704 <0.001 0.088
Red blood cell 0.266 (0.153) 5.058 <0.001 0.071
Platelet 0.248 (0.001) 4.685 <0.001 0.061
β, standardized regression coefficient; SE, standard error; t, corresponding t values; R2, percent variance explained by each variable. Table 3. Multiple Linear Regression Analysis* Showing the Independent Relationship between Variables and T-Scores
Variables β (SE) t p VIF
Age -0.386 (0.006) -8.106 <0.001 1.101
Weight 0.268 (0.006) 5.563 <0.001 1.128
Systolic blood pressure -0.100 (0.003) -2.037 0.043 1.180
Alkaline phosphatase -0.234 (0.001) -5.008 <0.001 1.062
Creatinine 0.135 (0.362) 2.872 0.004 1.072
White blood cell 0.127 (0.043) 2.485 0.014 1.277
Red blood cell 0.192 (0.139) 3.962 <0.001 1.135
Platelet 0.097 (0.001) 1.971 0.050 1.169
*model, adjusted R2=0.382.
β, standardized regression coefficient; SE, standard error; t, corresponding t values; VIF, variance inflation factor. 0 2 4 6 8 10 12 -5 -3 -1 1 3 T-score W BC co un t (× 10 3/m m 3) r=0.297 (p<0.001) 3 4 5 6 -5 -3 -1 1 3 T-score RB C co un t (× 10 6 /m m 3 ) r=0.266 (p<0.001) 0 200 100 300 400 500 -5 -3 -1 1 3 T-score Pl at ele t c ou nt (× 10 3/m m 3) r=0.248 (p<0.001)
addition, loss of osteoblasts was associated with a dramatic reduction of bone marrow cellularity that resulted in extra-medullary hematopoeisis, consistent with the loss of the abil-ity of the bone to support hematopoiesis.8 Moreover,
en-hanced signaling of the parathyroid hormone (PTH)/PTH-related peptide receptor in osteoblasts was reported to be associated with an increase in osteoblast numbers and en-hanced bone marrow HSC cellularity.4 The results of these
studies provided convincing support for the direct role of osteoblasts in adult hematopoiesis. Therefore, bone metab-olism and hematopoiesis appear to be closely associated and directly linked by osteoblast activity.
In addition, there are structural changes of the bone mar-row that may cause stem cell dysfunction during hematopoi-esis. Loss of bone mass leads to a disruption of the micro-architecture of the bone marrow, and the marrow space is replaced with fat tissue instead of HSCs.18,19 An in vitro
study showed that the mesenchymal stem cells, the osteo-blast precursor cells, from osteoporotic patients had de-creased function when compared to similar cell types from normal subjects, and the cells had a higher adipogenic ex-pression capacity.20,21 Therefore, bone marrow stem cell
dis-orders can be associated with bone loss and inappropriate hematopoiesis. Although the cause and effect relationship is not known, these findings are consistent with our assumption that bone loss and bone marrow stem cell dysfunction are closely linked. Our theories are plainly illustrated in Fig. 3.
There have been several studies showing the association between BMD and certain types of peripheral blood cell counts. As a marker of protein nutrition and immune sys-tem activation, lymphocyte count had a positive linear as-sociation with BMD in postmenopausal women.22,23 In this
dard error=0.043; p=0.014), RBC (β=0.192; standard er-ror=0.139; p<0.001) and platelet (β=0.097; standard error= 0.001; p=0.050) counts maintained a significant association with T-scores.
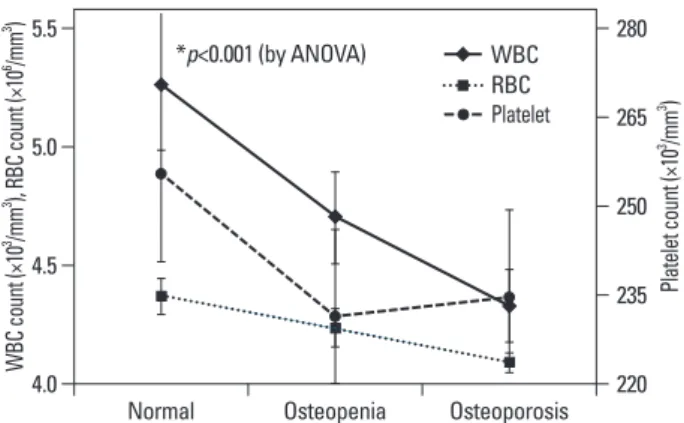
Fig. 2. shows the mean values of peripheral blood cell counts according to the three groups of subjects by BMD (normal, osteopenia and osteoporosis). The blood cell counts decreased gradually along with the BMD (p<0.001), indi-cating a positive relationship between blood cell counts and bone density.
DISCUSSION
The results of the present study indicate that peripheral blood WBC, RBC and platelet counts are independently as-sociated with BMD in Korean postmenopausal women. This is the first report to show a significant relationship be-tween peripheral blood cell counts and BMD. These findings support a possible linkage between bone metabolism and hematopoiesis. As we did not perform any studies to look into the mechanisms, elucidating the exact mechanism by which decreased blood cell counts are associated with de-creased BMD was difficult in this study. Nonetheless, we can suggest possible several explanations for our results, as described below.
Osteoblasts, the main cells involved in the formation of bone, play a central role in hematopoiesis.4 Osteoblasts are
located at the endosteal bone surface, which is located just next to the HSCs in the bone marrow.4,9 They control HSC
survival and differentiation by producing various hemato-poietic growth factors, such as interleukin (IL)-6, IL-7, c-kit ligand, granulocyte macrophage colony-stimulating factor, stromal cell-derived factor-1, and macrophage inflammatory protein-1.12,13 They also express adhesion molecules such as
integrins and N-cadherins, which are known to have hema-topoietic progenitor-binding properties that facilitate the teractions between osteoblasts and HSCs, resulting in an in-crease in the number of HSCs in the bone marrow.14,15 An
important role for osteoblasts in the regulation of HSCs was demonstrated by a series of ex vivo studies,5,6,16 and in
vivo evidence of the role of osteoblasts in hematopoiesis
has been provided by studies of targeted ablation of osteo-blasts.8,17 The mice deficient in Cbfa1/Runx2, a
transcrip-tion factor crucial for osteoblast progression, did not devel-op osteoblasts and had empty bone marrow, showing that osteoblasts are required to initiate bone hematopoiesis.17 In
Fig. 2. Blood cell counts according to three subject groups by BMD (i.e.,
nor-mal, osteopenia and osteoporosis). As BMD decreases blood cell counts also gradually decrease. *all three p-values for white blood cell, red blood cell and platelet counts are <0.001, estimated by one-way analysis of vari-ances (ANOVA). BMD, bone mineral density; WBC, white blood cell; RBC, red blood cell.
4.0 220 235 250 265 280 4.5 5.0 5.5 W BC co un t (× 10 3 /m m 3 ), R BC co un t (× 10 6 /m m 3 ) Pl at ele t c ou nt (× 10 3 /m m 3 )
Normal Osteopenia Osteoporosis *p<0.001 (by ANOVA) WBC
RBC Platelet
cell counts might provide additional information to aid in the understanding of the association between bone marrow stem cell function and BMD. Furthermore, other potential confounders including bone fracture history, reproductive history, income level, education background and calcium intake (all known to affect BMD in Korean adults31) were
not considered in this study. Lastly, only postmenopausal women were included, so the findings cannot reliably ap-plied to the general population.
In conclusion, the results of this study show a positive re-lationship between blood cell counts and BMD in Korean postmenopausal women. The study results suggest that there may be a close relationship between hematopoiesis and bone formation. Peripheral blood cell counts are easily obtained in any clinical setting, and may, at least in part, play a role as a putative marker of bone density, especially in postmeno-pausal women. Further investigations are needed to clarify the underlying mechanisms and explain this association.
REFERENCES
1. Raisz LG. Pathogenesis of osteoporosis: concepts, conflicts, and prospects. J Clin Invest 2005;115:3318-25.
2. Manolagas SC, Jilka RL. Bone marrow, cytokines, and bone re-modeling. Emerging insights into the pathophysiology of osteopo-rosis. N Engl J Med 1995;332:305-11.
3. Adams GB, Scadden DT. The hematopoietic stem cell in its place. Nat Immunol 2006;7:333-7.
4. Calvi LM, Adams GB, Weibrecht KW, Weber JM, Olson DP, Knight MC, et al. Osteoblastic cells regulate the haematopoietic stem cell niche. Nature 2003;425:841-6.
5. Taichman RS, Emerson SG. Human osteoblasts support hemato-poiesis through the production of granulocyte colony-stimulating factor. J Exp Med 1994;179:1677-82.
6. Taichman RS, Reilly MJ, Emerson SG. Human osteoblasts sup-port human hematopoietic progenitor cells in vitro bone marrow cultures. Blood 1996;87:518-24.
7. Visnjic D, Kalajzic I, Gronowicz G, Aguila HL, Clark SH, Lichtler
study, however, there was no significant association between lymphocyte counts and BMD (data not shown). A study
conducted by Laudisio, et al.24 showed that hemoglobin
levels were positively associated with BMD in the elderly, and that anemia is one of the risk factors for decreased BMD, which was consistent with our results. However, their study did not explain the exact mechanisms of reduced BMD in participants with low hemoglobin levels.
In our study, together with WBC count, serum creatinine was also significantly associated with BMD upon multiple regression analysis, which was consistent with the findings of a previous report,25 which indicated a relationship between
renal dysfunction and bone metabolism.
The BMD is influenced by many factors such as age, body weight, co-morbid conditions, and current use of medications and biochemical markers,1,26-29 some of which can influence
blood cell counts. For example, aging not only causes bone loss but also impairs bone marrow hematopoietic function30
and decreases blood cell count. To minimize the effects of these potential confounders and to show the independent association between blood cell counts and BMD, subjects with these factors were excluded from study participation and multiple regression was used to adjust for these factors. Besides lacking study of the mechanisms, this investiga-tion has several other limitainvestiga-tions. Given that the data in this study was obtained using a cross-sectional design, there is the possibility of a temporal association between blood cell counts and BMD. Longitudinal studies are needed to better characterize the relationship between blood cell counts and BMD. In addition, calcium and vitamin D intake or serum 25(OH)D3 level were not analyzed, and these may have had
an effect on BMD. Moreover, the absence of parathyroid hormone (PTH) level data is another limitation of this study. PTH affects both bone density and bone marrow
hemato-poiesis.4 Data for PTH levels related to BMD and blood
Osteoblast dysfunction
Inadequate bone formation
Decreased bone density Inadequate hematopoiesis
Decreased blood cell counts
Disruption of bone marrow micro-structure
20. Rodríguez JP, Garat S, Gajardo H, Pino AM, Seitz G. Abnormal osteogenesis in osteoporotic patients is reflected by altered mesen-chymal stem cells dynamics. J Cell Biochem 1999;75:414-23. 21. Rodríguez JP, Montecinos L, Ríos S, Reyes P, Martínez J.
Mesen-chymal stem cells from osteoporotic patients produce a type I col-lagen-deficient extracellular matrix favoring adipogenic differenti-ation. J Cell Biochem 2000;79:557-65.
22. Di Monaco M, Di Monaco R, Manca M, Cavanna A. Positive as-sociation between total lymphocyte count and femur bone mineral density in hip-fractured women. Gerontology 2002;48:157-61. 23. Di Monaco M, Vallero F, Di Monaco R, Mautino F, Cavanna A.
Total lymphocyte count and femoral bone mineral density in post-menopausal women. J Bone Miner Metab 2004;22:58-63. 24. Laudisio A, Marzetti E, Pagano F, Bernabei R, Zuccalá G.
Haemo-globin levels are associated with bone mineral density in the elderly: a population-based study. Clin Rheumatol 2009;28:145-51. 25. Jassal SK, von Muhlen D, Barrett-Connor E. Measures of renal
function, BMD, bone loss, and osteoporotic fracture in older adults: the Rancho Bernardo study. J Bone Miner Res 2007;22: 203-10.
26. Manolagas SC. Birth and death of bone cells: basic regulatory mechanisms and implications for the pathogenesis and treatment of osteoporosis. Endocr Rev 2000;21:115-37.
27. Zhai G, Hart DJ, Valdes AM, Kato BS, Richards JB, Hakim A, et al. Natural history and risk factors for bone loss in postmenopausal Caucasian women: a 15-year follow-up population-based study. Osteoporos Int 2008;19:1211-7.
28. NIH Consensus Development Panel on Osteoporosis Prevention, Diagnosis, and Therapy. Osteoporosis prevention, diagnosis, and therapy. JAMA 2001;285:785-95.
29. Kim KC, Shin DH, Lee SY, Im JA, Lee DC. Relation between obesity and bone mineral density and vertebral fractures in Korean postmenopausal women. Yonsei Med J 2010;51:857-63.
30. Chatta GS, Dale DC. Aging and haemopoiesis. Implications for treatment with haemopoietic growth factors. Drugs Aging 1996; 9:37-47.
31. Shin CS, Choi HJ, Kim MJ, Kim JT, Yu SH, Koo BK, et al. Prev-alence and risk factors of osteoporosis in Korea: a community-based cohort study with lumbar spine and hip bone mineral densi-ty. Bone 2010;47:378-87.
AC, et al. Conditional ablation of the osteoblast lineage in Col2.3deltatk transgenic mice. J Bone Miner Res 2001;16:2222-31. 8. Visnjic D, Kalajzic Z, Rowe DW, Katavic V, Lorenzo J, Aguila
HL. Hematopoiesis is severely altered in mice with an induced os-teoblast deficiency. Blood 2004;103:3258-64.
9. Wu JY, Scadden DT, Kronenberg HM. Role of the osteoblast lin-eage in the bone marrow hematopoietic niches. J Bone Miner Res 2009;24:759-64.
10. WHO scientific group on the prevention and management of os-teoporosis. Prevention and management of osteoporosis: report of a WHO scientific group. WHO technical report series, 921 Gene-va: WHO Library; 2000.
11. Taaffe DR, Cauley JA, Danielson M, Nevitt MC, Lang TF, Bauer DC, et al. Race and sex effects on the association between muscle strength, soft tissue, and bone mineral density in healthy elders: the Health, Aging, and Body Composition Study. J Bone Miner Res 2001;16:1343-52.
12. Aguila HL, Rowe DW. Skeletal development, bone remodeling, and hematopoiesis. Immunol Rev 2005;208:7-18.
13. Taichman RS. Blood and bone: two tissues whose fates are inter-twined to create the hematopoietic stem-cell niche. Blood 2005; 105:2631-9.
14. Hughes DE, Salter DM, Dedhar S, Simpson R. Integrin expres-sion in human bone. J Bone Miner Res 1993;8:527-33.
15. Zhang J, Niu C, Ye L, Huang H, He X, Tong WG, et al. Identifica-tion of the haematopoietic stem cell niche and control of the niche size. Nature 2003;425:836-41.
16. Taichman RS, Emerson SG. The role of osteoblasts in the hemato-poietic microenvironment. Stem Cells 1998;16:7-15.
17. Komori T, Yagi H, Nomura S, Yamaguchi A, Sasaki K, Deguchi K, et al. Targeted disruption of Cbfa1 results in a complete lack of bone formation owing to maturational arrest of osteoblasts. Cell 1997;89:755-64.
18. Chappard D, Legrand E, Audran M, Basle MF. [Histomorphomet-ric measurement of the architecture of the trabecular bone in os-teoporosis: comparative study of several methods]. Morphologie 1999;83:17-20.
19. Shih TT, Chang CJ, Hsu CY, Wei SY, Su KC, Chung HW. Corre-lation of bone marrow lipid water content with bone mineral den-sity on the lumbar spine. Spine (Phila Pa 1976) 2004;29:2844-50.