Antioxidant and Antimicrobial Activities of Quinoa
(Chenopodium quinoa Willd.) Seeds Cultivated in Korea
Jin Hwa Park, Yun Jin Lee, Yeon Ho Kim, and Ki Sun YoonDepartment of Food and Nutrition, Kyung Hee University, Seoul 02453, Korea pISSN 2287-1098ㆍeISSN 2287-8602
Received 9 June 2017; Accepted 3 August 2017; Published online 30 September 2017 Correspondence to Ki Sun Yoon, Tel: +82-2-961-0264, E-mail: [email protected]
Copyright © 2017 by The Korean Society of Food Science and Nutrition. All rights Reserved.
This is an Open Access article distributed under the terms of the Creative Commons Attribution Non-Commercial License (http://creativecommons.org/licenses/by-nc/4.0) which permits unrestricted non-commercial use, distribution, and reproduction in any medium, provided the original work is properly cited.
ABSTRACT: The objective of this study was to investigate the antioxidant and antimicrobial properties of quinoa culti-vated in Korea and to compare it with imported quinoa from the USA and Peru. The highest amount of total flavonoid contents (TFC) with 20.91 mg quercetin equivalents/100 g was measured in quinoa seed extract cultivated in Korea, while the total phenolic contents (TPC) were significantly higher in quinoa from the USA (16.28 mg gallic acid equiv-alents/100 g). In addition, quinoa extracts cultivated in Korea displayed a superior antioxidant ability in both, ferric re-ducing antioxidant power and 1,1-diphenyl-2-picrylhydrazyl values. There was a high correlation between TFC and anti-oxidant activity and a low correlation between TPC and antianti-oxidant activity. The antimicrobial activity of the quinoa ex-tracts was determined using a disc diffusion assay and optical density method. In both assays, the quinoa seed exex-tracts did not have strong antimicrobial activity against foodborne bacteria, including Staphylococcus aureus, Listeria monocytogenes, Bacillus cereus, Escherichia coli, Salmonella Typhimurium, and Campylobacter jejuni.
Keywords: quinoa extracts, flavonoid contents, phenolic contents, antioxidant activity, antimicrobial activity
INTRODUCTION
Nowadays, people are showing an interest in foods that contain bioactive or functional components, which will result in additional benefits to their health status (1). A growing concern of diet and health has led to the devel-opment of healthier food products; in addition, consum-er demands increasingly focus on minimally processed food products, with less use of synthetic additives with-out compromising food safety. Although synthetic anti-oxidants and antimicrobials have been approved in many countries, the recent trend has been to use natural pres-ervatives due to the adverse health effects of synthetic ones (2,3). Synthetic antioxidants such as butylated hy-droxytoluene and butylated hydroxyanisole, are com-monly used in processed foods and have been reported to have some side effects, including being carcinogenic. The term “natural antioxidants and antimicrobials” im-plies that the materials have been derived from natural sources, such as plants, animals, and microbes (4). There-fore, alternative sources for safe, effective and acceptable natural antioxidants and antimicrobials are being con-tinuously explored.
Quinoa (Chenopodium quinoa Willd.) is a seed crop that has been traditionally cultivated in the Andean region for
more than 5,000 years. It grows at many different alti-tudes, from sea level to the height of Bolivian Altiplano at around 4,000 m above sea level and under various cli-mate conditions. Quinoa has a broad genetic diversity, which allows it to adapt to various tough environments, including highlands, salinity, drought, and frost (5). Qui-noa and quiQui-noa products are rich not only in macronu-trients, such as protein, polysaccharides, and fats, but al-so in micronutrients such as polyphenols, vitamins, and minerals (6,7). Polyphenols, including phenolic acids, fla-vonoids, and tannins make up bioactive secondary plant metabolites that contribute to diverse physiological prop-erties, including antimicrobial, antioxidant, anti-inflam-matory, antitumor, and anti-carcinogenic effects (8).
The antioxidant components such as polyphenols and the antioxidant activity of quinoa seeds cultivated in var-ious countries (Bolivia, Chile, Peru, USA, and Japan) have been investigated (6,9-13). However, there have been few studies on the antimicrobial activities of quinoa seed (10, 14). Also, there are no investigations on the antioxidant and antimicrobial effects of quinoa seeds cultivated in Korea.
The objectives of this study were 1) to evaluate the nu-tritional advantages of quinoa seeds cultivated in Korea; 2) to evaluate the usefulness of quinoa cultivated in
Ko-rea as a food stuff through quantitative determination of the antioxidant components; and 3) to compare antioxi-dants and antimicrobial activities of quinoa cultivated in Korea with those of imported quinoa from the USA and Peru.
MATERIALS AND METHODS
Plant materials
Quinoa (Chenopodium quinoa) cultivated in Korea was sup-plied by Hongcheon-river quinoa farming union (Hong-cheon, Korea). It was harvested during the summer of 2015. Imported quinoa cultivated in Peru and USA were purchased from a local store in Seoul, Korea. Imported quinoa samples harvested in 2016 were used. Both sam-ples were stored in the refrigerator until analyzed. Proximate analysis
The chemical composition of quinoa, including crude ash, crude protein, crude fat, and moisture content were de-termined according to AOAC Official Methods (15). Ash was determined by incinerating the sample overnight in a muffle furnace (FX-12, Daihan Scientific Co., Ltd., Se-oul, Korea) overnight at 600oC. The protein content (ni-trogen×6.25) was determined using the Kjeldahl meth-od. For total fat, the Soxhlet extraction method with ether as solvent was used. The direct oven method (100
oC for 24 h) was used to determine moisture and total
carbohydrates were calculated by subtracting the total percent values of other measurements from 100.
Extract preparation
Quinoa seeds were extracted using the procedure of Miranda et al. (10) with some modifications. Ten grams of ground quinoa seeds were mixed with 100 mL of 70% (v/v) ethanol. The mixtures were then left in a shaking incubator (HB-201SF, Hanbaek Scientific Technology Co., Ltd., Bucheon, Korea), prior to filtration (Whatman no. 1) for 24 h and were then centrifuged at 3,500 g for 10 min at 5oC (VS-550, Vision Scientific Co., Ltd., Bucheon, Korea). The clarified extract was collected and then eva-porated to dryness using a rotary evaporator (N-1200A, Eyela, Shanghai, China) at 40oC. Finally, the extract was reconstituted in sterile distilled water, freeze dried using a freeze dryer (FD8508, IlShin BioBase, Seoul, Korea), and refrigerated for further use.
Preparation of the standard curve and determination of the total flavonoid content
The total flavonoid content (TFC) was measured accord-ing to the method by Al-saeedi and Hossain (16). To de-termine the total flavonoids, a quercetin standard was used to prepare the calibration standard curve. A 250 μL
aliquot of appropriately diluted extract solution (with ethanol) or standard solution of quercetin (0, 20, 40, 60, 80, and 100 μg/mL) was taken in a test tube, to which 125 μL of distilled water and 75 μL of 5% sodium nitrate solution were added. The mixture was kept at room temperature for 6 min. Then, 150 μL of 10% aluminum chloride was added to each test tube and kept in a dark place for 1 h. Finally, the solution was diluted with 500 μL of 4% sodium hydroxide and 275 μL of distilled water. The absorbance of the extract solution and differ-ent concdiffer-entrations of quercetin standard were measured using an enzyme-linked immunosorbent assay (ELISA) reader (Powerwave XS, BioTek Instruments Inc., Wi-nooski, VT, USA) at 510 nm. The standard calibration curve was prepared by plotting the concentration versus absorbance of quercetin. Finally, The TFC was calculated using an established formula and was expressed as milli-grams of quercetin equivalents (QE) per 100 g quinoa sample (mg QE/100 g dry material).
Preparation of standard curve and determination of total phenolic content
The total phenolic content (TPC) was measured using the Folin-Ciocalteu assay with slight modifications (16,17). To determine the total flavonoids, gallic acid standard was used to prepare the calibration curve. A 250 μL ali-quot of appropriately diluted extract solution (with dis-tilled water) or standard solution of gallic acid (0, 20, 40, 60, 80, and 100 μg/mL) was placed in a test tube, to which 250 μL of 1 N Folin-Ciocalteu reagent solution was added. The mixture was kept at room temperature for 3 min. Then, 725 μL of 10% sodium carbonate solution was added to each test tube and kept in a dark place for 1 h. The absorbance of the extract solution and different concentrations of quercetin standard were measured us-ing the ELISA reader at 725 nm. The standard calibration curve was prepared by plotting the concentration versus absorbance of gallic acid. Finally, the TPC was calculated using an established formula and was expressed as milli-grams of gallic acid equivalents (GAE) per 100 g of qui-noa sample (mg GAE/100 g dry material).
Ferric reducing antioxidant power assay
The ferric reducing antioxidant power (FRAP) assay was conducted according to the method of Guo et al. (18) and Sethiya et al. (19) with slight modifications. The FRAP reagent contained 5 mL of 10 mM 2,4,6-tripyridy-S-tri-azine (TPTZ, Sigma-Aldrich Co., St. Louis, MO, USA) solution in 40 mM HCl plus 5 mL of 20 mM ferric chlor-ide and 50 mL of 300 mM acetate buffer (pH 3.6) was freshly prepared and warmed at 37oC. A 150 μL aliquot of appropriately diluted extract solution (with distilled water) or standard solution of iron (II) sulfate solution (0, 0.2, 0.4, 0.6, 0.8, and 1 μg/mL) was placed in a test
tube, with 2,580 μL of FRAP reagent solution. The mix-ture was kept at 37oC for 15 min. The absorbance of the extract solution and different concentrations of iron (II) sulfate standard were measured using the ELISA reader at 593 nm. The standard calibration curve was prepared by plotting concentration versus absorbance of iron (II) sulfate. Finally, the FRAP value was calculated using an established formula and expressed as mM Fe (II) per kg quinoa sample (mM Fe2+/kg dry material).
DPPH radical scavenging assay
The radical scavenging activity of the quinoa was assessed using the modified 1,1-diphenyl-2-picrylhydrazyl (DPPH) radical scavenging assays of Brighente et al. (20) and Brand-Williams et al. (21). A 200 μL aliquot of appropri-ately diluted extract solution (with distilled water) or standard solution of ascorbic acid (0, 0.005, 0.01, 0.025, 0.05, 0.1, 0.2, 2, and 20 mg/mL) was placed in a test tube, to which 800 μL of 0.2 mM DPPH solution was added. The mixture was shaken vigorously and allowed to stand for 15 min in a dark place at room temperature. The absorbance of the extract solution and different con-centrations of ascorbic acid standard were measured us-ing the ELISA reader at 525 nm. Finally, the antioxidant activity of the extract was calculated using the following formula:
RSA (radical scavenging activity, %)= A0A−A1×100
0
where A0 is absorbance of pure DPPH and A1 is
absorb-ance of pure DPPH in the presence of extract.
The IC50 (concentration providing 50% inhibition)
val-ue was also calculated for the dose inhibition curve in linear range by plotting the extract concentration versus the corresponding scavenging effect.
Bacterial strains and growth conditions
Six bacterial strains, namely Staphylococcus aureus (ATCC 13565), Bacillus cereus (ATCC 11778), Salmonella Typhi-murium (ATCC 13311), and Campylobacter jejuni (ATCC 33291) were purchased from the Korean Culture Center of Microorganisms (KCCM, Seoul, Korea). Listeria mono-cytogenes (ATCC 15313) and Escherichia coli (EHEC: NCCP 13721) were obtained from the Korean Research In-stitute of Bioscience & Biotechnology (KRIBB, Daejeon, Korea) and the Ministry of Food and Drug Safety (MFDS, Cheongju, Korea), respectively. Stock cultures were maintained at −80oC in broth containing 20% glycerol (Sigma-Aldrich Co.). The following broths were used to culture the bacteria: tryptic soy broth (TSB, DifcoTM, Sparks, MD, USA) for S. aureus and E. coli, nutrient broth (NB; DifcoTM) for B. cereus, brain heart infusion broth (BHI; BD, Sparks, MD, USA) for S. Typhimurium,
Brucella broth (BD) with 0.16% agar (BD) for C. jejuni, and TSB with 0.6% yeast extract (Oxoid, Hampshire, Eng-land) for L. monocytogenes. For each experiment, the stock culture of each pathogen was thawed at room tempera-ture. Then, 0.01 mL of thawed stock culture of the path-ogen was inoculated into a 25 mL Erlenmeyer flask con-taining 10 mL of NB, sealed with a silicone cap and incu-bated aerobically at 36oC for 24 h on a rotary shaker (VS- 8480SR, Vision Scientific Co.). C. jejuni, however, was inoculated into Bolton broth (BB; Oxoid) and incubated in a microaerophilic chamber (miniMACS, Miltenyi Bio-tec Inc., Auburn, CA, USA) composed of an atmosphere containing 5% oxygen, 10% carbon dioxide, and 85% ni-trogen at 42oC for 24 h. Viable cell counts of all patho-gens ranged from 9.0 to 10.0 log CFU/mL at the end of the incubation period.
Antimicrobial activity of quinoa by the disc diffusion assay For the disc diffusion assay (22,23), 1 mL of each over-night culture was diluted with 0.1% sterilized peptone water (BD) to 8.0∼8.3 log CFU/mL. Each bacterial con-centration [optical density (OD) of bacteria inocula] was adjusted spectrophotometrically using the ELISA reader and was also confirmed by plate counts. Each bacterial suspension (200 μL) was spread onto a Muller-Hinton agar (MHA) plate (Oxoid), while a MHA plate supple-mented with 5% horse blood was used for C. jejuni. Twenty μL of 50% (w/v) quinoa extract were individ-ually applied to 6 mm sterile discs (Advantec, Tokyo, Japan). A negative control was prepared with sterilized distilled water. When the negative control discs were dry, all the discs with extracts were transferred to the MHA plate. The inoculated plates were then incubated aerobi-cally at 37oC for 24 h while those for C. jejuni were incu-bated microaerobically at 42oC. After incubation, the di-ameter of the inhibition zones was measured in millime-ters using digimatic calipers (CD-15APX, Mitutoyo, Ka-wasaki, Japan), including the diameter of the discs. The strain sensitivity to each quinoa extract was classified by the diameter of the inhibition zones as follows: Not sensi-tive for a total diameter smaller than 8 mm, Sensisensi-tive for a total diameter 9∼14 mm, Very sensitive for a total di-ameter of 15∼19 mm, and Extremely sensitive for a total diameter larger than 20 mm (24). Each assay was per-formed in triplicate on three separate experimental runs. Antimicrobial activity of quinoa determined by the OD method
The antimicrobial activity of quinoa was also assessed using the slightly modified OD method of Ponce et al. (24). A 1 mL of each overnight culture was diluted with 0.1% sterilized peptone water (BD) to 7 log CFU/mL. Test tubes with 0.4 mL of 20% (w/v) quinoa extract were inoculated with diluted inoculum, and the final bacterial
Table 1. Proximate analysis of quinoa seeds from three
coun-tries of origin (unit: %)
Country of origin
Korea USA Peru
Protein 15.83±0.05a 10.65±0.15c 13.89±0.05b
Moisture 9.90±0.05a 9.57±0.09b 9.88±0.03a
Fat 4.73±0.15b 6.01±0.14a 6.16±0.13a
Ash 3.40±0.09a 3.07±0.06b 1.60±0.10c
Total carbohydrate 66.14±0.17b 70.70±0.12a 68.47±0.11b Means in a row with different letters (a-c) are significantly dif-ferent by Duncan’s multiple range test at P <0.05.
Table 2. Total flavonoid and phenolic contents of quinoa seeds cultivated in Korea, USA, and Peru
Quinoa extract TFC (mg QE/100 g dry material) TPC (mg GAE/100 g dry material) Korea 20.91±0.87a 14.50±0.12c USA 13.24±0.73b 16.28±0.17a Peru 11.51±0.60c 15.33±0.10b
TFC, total flavonoid contents; QE, quercetin equivalents; TPC, total phenolic contents; GAE, gallic acid equivalents.
Means in a column with different letters (a-c) are significantly different by Duncan’s multiple range test at P <0.05.
concentration was 6 log CFU/mL. Tubes treated with qui-noa extract without microorganisms were used as sterili-ty controls. Inoculated tubes were incubated aerobically at 37oC for 24 h, while those for C. jejuni were incubated microaerobically at 42oC. After incubation, the OD of the broths was measured using an ELISA reader at 600 nm. The antimicrobial activity of each quinoa extract was as-sessed to compare the OD value with the control (25). When the differences in the OD values between each quinoa extract with microorganism and control (extract without microorganism) were less than 0.05, it could be interpreted as the extracts having antimicrobial activity (25).
Statistical analysis
Each experiment was replicated at least twice at different times. For each replication, three to five measurements were performed for each parameter. All data were ex-pressed as mean value±standard deviation, and the data were analyzed with the SAS software, version 9.3 (SAS Institute, Cary, NC, USA). The analysis of variance was performed using a one-way ANOVA and significant dif-ferences were determined using Duncan’s multiple range test at P<0.05. Pearson’s correlation coefficient (r) and P-value were used to show correlations and their signifi-cance at P<0.05.
RESULTS AND DISCUSSION
Proximate analysis
The results of the proximate analysis of the quinoa seeds from Korea, USA, and Peru are presented in Table 1. Car-bohydrates (over 60%) were the predominant compo-nent of all quinoa seeds, followed by protein, moisture, fat, and ash. There were significant differences for each nutritional composition of quinoa seeds from the three different countries (P<0.05). Quinoa seeds cultivated in Korea contained a higher amount of protein (15.83%) than those from Peru (13.89%) and USA (10.65%). The moisture content was also higher in quinoa seeds culti-vated in Korea (9.90%) and Peru (9.88%) than in the
USA (9.57%). However, a lower fat content was observed for the quinoa seeds cultivated in Korea (4.73%) as com-pared to the USA (6.01%) and Peru (6.16%). Quinoa seeds cultivated in Korea had the highest ash content (3.4%), followed by those from the USA (3.07%) and Peru (1.60%). The values reported in this study for the three quinoa seeds were within the range of the results previously published (6,10), except the ash content of quinoa seeds cultivated in Peru, which was lower than those reported in other studies (26-28).
TFC and TPC
Polyphenols are bioactive secondary plant metabolites that are widely present in commonly consumed foods of plant origin. The three main types of polyphenols are fla-vonoids, phenolic acids, and tannins, which act as pow-erful antioxidants in vitro (6). The results of the TFC and TPC are shown in Table 2. The TFC and TPC in the qui-noa extracts were significantly different according to their origin (P<0.05). The highest amount of TFC with 20.91 mg QE/100 g was measured in quinoa seed ex-tract cultivated in Korea, followed by those from the USA (13.24 mg QE/100 g) and Peru (11.51 mg QE/100 g). A previous study reported that the total flavonoid content of quinoa cultivated from Peru, Chile, Bolivia, and Japan were 11.6∼55.5 mg QE/100 g (6), 7.77∼14.37 mg QE/ 100 g (10), 3.3∼53.3 mg QE/100 g, and 9.9∼87.3 mg QE/100 g (11), respectively.
On the other hand, the amount of TPC was signifi-cantly higher in quinoa from the USA (16.28 mg GAE/ 100 g) than that from Peru (15.33 mg GAE/100 g) and Korea (14.50 mg GAE/100 g). Miranda et al. (10) re-ported the TPC value of quinoa seeds from Chile was be-tween 3.72 and 16.55 mg GAE/100 g. Alvarez-Jubete et al. (29) also reported that the total phenolic content of quinoa from Bolivia was 71.7 mg/100 g. There are slight-ly different ranges of TFC and TPC from previous studies, which are probably due to the different extract solvents as well as the different origins of quinoa seeds. Bhaduri (14) reported that TFC, TPC, and the antioxidant activ-ity of quinoa seed extracts varied with different solvents (hexane, acetone, methanol, ethanol, ethyl acetate, and
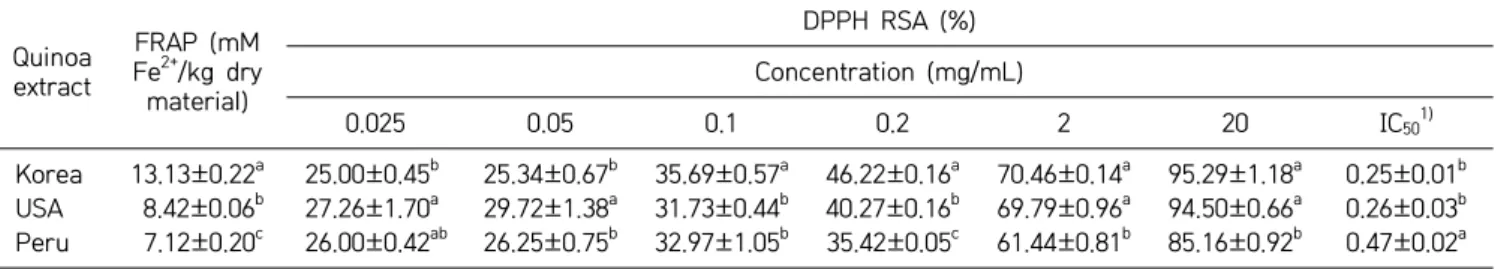
Table 3. Antioxidant activities of quinoa seeds cultivated in Korea, USA, and Peru Quinoa extract FRAP (mM Fe2+/kg dry material) DPPH RSA (%) Concentration (mg/mL) 0.025 0.05 0.1 0.2 2 20 IC501) Korea 13.13±0.22a 25.00±0.45b 25.34±0.67b 35.69±0.57a 46.22±0.16a 70.46±0.14a 95.29±1.18a 0.25±0.01b USA 8.42±0.06b 27.26±1.70a 29.72±1.38a 31.73±0.44b 40.27±0.16b 69.79±0.96a 94.50±0.66a 0.26±0.03b Peru 7.12±0.20c 26.00±0.42ab 26.25±0.75b 32.97±1.05b 35.42±0.05c 61.44±0.81b 85.16±0.92b 0.47±0.02a Means in a column with different letters (a-c) are significantly different by Duncan’s multiple range test at P <0.05. FRAP, ferric reducing antioxidant power; DPPH RSA, 1,1-diphenyl-2-picrylhydrazyl (DPPH) radical scavenging assay. 1)Concentration of the extract in mg/mL that was able to scavenge half of the DPPH radical.
water). Extracts from water and methanol showed sig-nificantly higher TFC, TPC, and antioxidant activity com-pared to other solvents used for extraction.
Antioxidant activities of quinoa seed extract
In this study, the antioxidant activity of quinoa seed ex-tract was evaluated using ferric reducing antioxidant pow-er and DPPH free radical-scavenging assays. The FRAP and DPPH assays are simple, rapid, inexpensive tests, and are very useful as routine analyses of antioxidant ac-tivity of natural products. The FRAP assay depends on the reduction of ferric TPTZ [Fe (III)-TPTZ] to ferrous TPTZ [Fe (II)-TPTZ] by a reductant (antioxidants or other reducing agents) at a low pH (30). Fe (II)-TPTZ has an intensive blue color and can be monitored at 593 nm. The DPPH radical is a commonly used substrate to quickly evaluate the antioxidant activity due to its stabil-ity in radical form and simplicstabil-ity of the assay (31). The principle behind this assay is in the color change of the DPPH solution from purple to yellow as the radical is quenched by the antioxidant (32). The intensity of the color is quantitatively measured by a spectrophotometer at 517 nm.
The FRAP and DPPH values for the quinoa seed extract cultivated from Korea, USA, and Peru are presented in Table 3. The quinoa seed extract cultivated from Korea exhibited the highest FRAP value with 13.13 mM Fe2+/kg dry material, followed by USA (8.42 mM Fe2+/kg dry ma-terial), and Peru (7.12 mM Fe2+/kg dry material). The FRAP values of quinoa seed extracts cultivated from USA and Peru were similar to the values previously reported by Nsimba et al. (33), whereas the FRAP value of quinoa seed extract cultivated from Korea in the present study was about three times higher compared to data by Paśko et al. (12).
The DPPH value of quinoa seed extract from Korea at a concentration of 0.2 mg/mL was significantly higher (46.22%) than those from the USA (40.27%) and Peru (35.42%). The DPPH values in this study were lower than the values found in the literature. Nsimba et al. (33) reported that the DPPH radical scavenging activity of quinoa cultivated from Bolivia and Japan were 72.1% and
59.2%, respectively. Bhaduri (14) determined that the antioxidant activity of the quinoa seed extracts from six solvents varied from 66.56 to 82.71%, with the highest activity for the water extract.
The IC50 value (concentration of the extract in mg/mL
that was able to scavenge half of the DPPH radical) was lowest in quinoa seed extracts cultivated from Korea (0.25 mg/mL), followed by the USA (0.26 mg/mL) and Peru (0.47 mg/mL), compared to ascorbic acid (0.02 mg/ mL) as control. Nsimba et al. (33) reported that the IC50
value of the quinoa seed extracts cultivated from Bolivia and Japan was in the range of 0.1∼22.4 mg/mL, with the strongest antioxidant potency for ethyl acetate fractions (Bolivia, 0.3 mg/mL; Japan, 0.1 mg/mL). On the other hand, Bhaduri (14) showed that the IC50 of quinoa seed
extracts varied from 0.014∼0.017 mg/mL. Since the qui-noa seed extract cultivated from Korea showed the low-est IC50 value among the quinoa seed extracts cultivated
from other countries, indicating that quinoa cultivated from Korea has a strong proton donating ability, it could serve as a free radical scavenger and neutralize the reac-tive oxygen species that originate due to prolonged oxi-dative stress in living organisms.
Data variations are to be expected in the antioxidant capacity of quinoa seed extracts, since many factors in-cluding genetics, agrotechnical processes, and environ-mental conditions can influence the presence of phenolic compounds (33,34). In addition, a comparison of the re-sults of different studies can be difficult due to the varia-bility in the experimental conditions amongst the meth-ods used (35,36). It is possible that storage conditions may influence the nutrition composition and antioxidant capacity of grains. In the present study, we analyzed qui-noa seeds cultivated in 2015 (Korea) or 2016 (USA and Peru), which were stored in the refrigerator before anal-ysis of their nutrition composition and antioxidant capac-ities. Although we could not claim that all samples had the same storage conditions before analysis, our study demonstrates that nutrients and antioxidant activity of quinoa seeds cultivated in Korea are comparable to those from imported quinoa seeds. To our knowledge, no data on the effect of storage conditions on nutrition
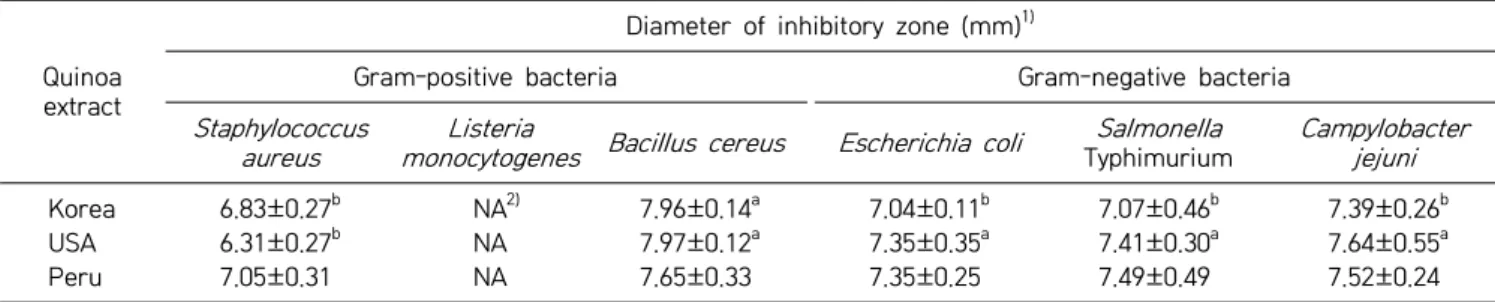
composi-Table 5. Antimicrobial activity of quinoa seed extracts cultivated in Korea, USA, and Peru by the disc diffusion assay Quinoa
extract
Diameter of inhibitory zone (mm)1)
Gram-positive bacteria Gram-negative bacteria
Staphylococcus
aureus monocytogenesListeria Bacillus cereus Escherichia coli TyphimuriumSalmonella
Campylobacter jejuni
Korea 6.83±0.27b NA2) 7.96±0.14a 7.04±0.11b 7.07±0.46b 7.39±0.26b
USA 6.31±0.27b NA 7.97±0.12a 7.35±0.35a 7.41±0.30a 7.64±0.55a
Peru 7.05±0.31 NA 7.65±0.33 7.35±0.25 7.49±0.49 7.52±0.24
Means (n=3) in a row with different letters are significantly different by Duncan’s multiple range test at P <0.05. 1)Diameter of inhibitory zone (mm) including disc diameter of 6 mm.
2)NA: no activity was observed.
Table 4. Pearson’s correlation coefficients (r) of TFC, TPC and antioxidant activities of quinoa seed extracts
Trait TFC TPC FRAP DPPH
TFC 1.000 −0.773* (0.598)1) 0.992* (0.984) 0.939* (0.882)
TPC 1.000 −0.744* (0.554) −0.548 (0.300)
FRAP 1.000 0.964* (0.929)
DPPH 1.000
TFC, total flavonoid contents; TPC, total phenolic contents; FRAP, ferric reducing antioxidant power assay; DPPH, 1,1-di-phenyl-2-picrylhydrazyl radical scavenging assay.
*Correlation is significant at the 0.05 level (2-tailed). 1)Pearson’s correlation coefficient of determination (r2).
tion and antioxidant capacity of quinoa seeds have previ-ously been reported in the literature. Thus, further stud-ies are required to investigate the effect of storage con-ditions on the nutrition composition and antioxidant ca-pacity of quinoa seeds.
Correlations between TFC, TPC, and antioxidant activities (FRAP and DPPH assays) of quinoa seed extracts
The correlation between the TFC, TPC, and antioxidant activities (FRAP and DPPH assays) of quinoa seed ex-tracts was studied using the Pearson correlation coeffi-cient (Table 4). The TFC showed a significantly (P<0.05) high positive correlation with FRAP (r=0.992) and DPPH (r=0.939) assays. However, the correlation between TPC and FRAP, DPPH assays was found to be weak with a negative relation (r =−0.548∼−0.744). The low corre-lation values between the total phenolic acid and the an-tioxidant activity suggest that the major anan-tioxidant com-pounds in quinoa seed extracts might be non-phenolics. Although a relatively high amount of total phenolic con-tent was measured in the quinoa seed extracts, other non-phenolic compounds, such as ascorbic acid, phytic acid, α-tocopherol, β-carotene, and saponins, might be the most probable contributors of the antioxidant activ-ity of quinoa seed extracts in this study. Nsimba et al. (33) also found weak correlations between the TPC and antioxidant activity (DPPH and FRAP assays) in quinoa and amaranth extracts. On the other hand, Alvarez-Jubete
et al. (29) and Tang et al. (9) reported high correlations between TPC and antioxidant activity. The correlation discrepancies found in the literature, could be explained on the basis of differences in the interpretation of the re-sults, by individual methods and/or the presence and evaluation of interfering substances (such as ascorbic ac-id, saccharides, and carotenoids) (36,37). Furthermore, the antioxidant activity of a substance can vary from method to method depending on factors such as anti-oxidant solubility, oxidation state, medium pH, and type of oxidation-prone substrate (36).
Antimicrobial activity of quinoa by the disc diffusion assay Six microorganisms were tested for their sensitivity to three different extracts of quinoa seeds. The antimicro-bial potential was initially determined by the agar disk- diffusion method, and the quinoa extracts were tested at a 50% concentration. Table 5 presents the diameters of inhibition zones (clear zones around disks) exerted by the quinoa seed extracts towards the tested microorgan-isms. The bacterium that showed the highest inhibition zone was B. cereus (7.65∼7.96 mm). However, the inhib-ition zone was less than 8 mm and can be interpreted as the plant extracts having no sensitivity against the mi-croorganisms (24). In particular, no inhibition ability was observed against L. monocytogenes, and there was no sig-nificant difference in the antimicrobial activity among the origin of the quinoa seeds.
Our results are slightly different from those of another study by Miranda et al. (10), in which six diverse sour-ces of quinoa seeds had antimicrobial activity against E. coli (8.29∼14.79 mm) and S. aureus (8.53∼15.03 mm). Chaturvedi et al. (38) determined the antimicrobial ac-tivity of pseudo cereals (amaranth and buckwheat) malt-ed with plain water against eight species of Gram-pos-itive (S. aureus, Streptococcus pyogenes, and B. cereus) and Gram-negative bacteria (E. coli, Proteus vulgaris, Shigella spp., Klebseilla pneumonia, and Psedomonas aeruginosa). The malted extracts of amaranth and buckwheat had moder-ate antimicrobial activities against B. cereus (8.1 mm and 9.1 mm) and E. coli (8.0 mm and 10.3 mm), but no
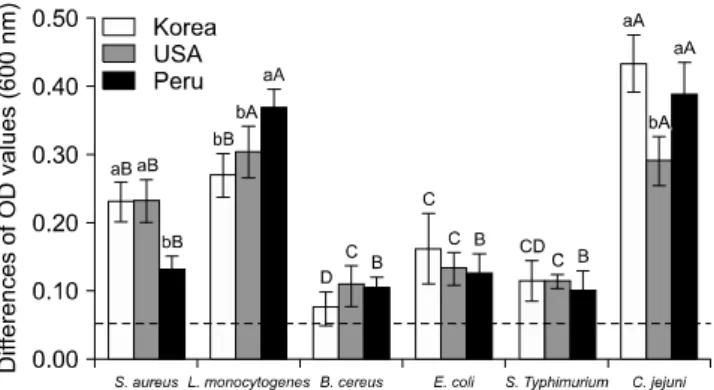
anti-Fig. 1. Antimicrobial activity of quinoa seed extracts (20%) culti-vated in Korea, USA, and Peru determined by the optical density method. Antimicrobial activity is present when difference of opti-cal density (OD) value is lower than 0.05. Means in each bacteria (Staphylococcus aureus, Listeria monocytogenes, Bacillus cer-eus, Escherichia coli, Salmonella Typhimurium, and Campylo-bacter jejuni) with different letters (a,b) are significantly differ-ent by Duncan’s multiple range test at P<0.05. Means in each quinoa extract (Korea, USA, and Peru) with different letters (A- D) are significantly different by Duncan’s multiple range test at P<0.05.
microbial activities were observed against S. aureus. Antimicrobial activity of quinoa determined by the OD method
The OD method (turbidimetry) is a rapid and easy-to- achieve procedure to determine the minimum inhibitory concentration and the minimum bactericidal concentra-tion of antibiotics that produce similar results to the more laborious and time-demanding microdilution meth-od (24). The antimicrobial activity of each quinoa extract was assessed to compare the OD value of 20% quinoa extracts and sterility. Fig. 1 shows the differences of the OD values of each quinoa extract against six target mi-croorganisms. The quinoa seed extracts showed no anti-microbial activities against food-borne bacteria, regard-less of origin of quinoa seeds and type of bacteria (Gram- positive or Gram-negative). When the differences in the OD values between each quinoa extract with microorgan-ism and control are less than 0.05, it can be interpreted as the extracts having antimicrobial activity (25). How-ever, in the present study, all of the differences in the OD values were higher than 0.05. Our results are thus slightly different from those of another study by Bhaduri (14), in which the quinoa seed extracts from all six sol-vents (hexane, acetone, methanol, ethanol, ethyl acetate, and water) exhibited antimicrobial activities towards both Gram-positive bacteria Enterococcus faecalis and Staphylo-coccus epidermidis, and P. aeruginosa, one of two Gram-neg-ative bacteria used. The extracts from methanol, ethyl acetate, and water had significant antimicrobial activities against E. coli at a concentration of 200 μg/mL.
In conclusion, our data indicate that quinoa seed ex-tracts cultivated in Korea had better antioxidant ability than those from the USA and Peru. The main
antioxi-dant compounds in quinoa extracts might be flavonoid but non-phenolic. However, quinoa seed extracts did not have strong antimicrobial activity against foodborne bac-teria, both Gram-positive and -negative microorganisms.
AUTHOR DISCLOSURE STATEMENT
The authors declare no conflict of interest.
REFERENCES
1. Cofrades S, Serrano A, Ayo J, Carballo J, Jiménez-Colmenero F. 2008. Characteristics of meat batters with added native and preheated defatted walnut. Food Chem 107: 1506-1514. 2. Ajila CM, Naidu KA, Bhat SG, Prasada Rao UJS. 2007.
Bioac-tive compounds and antioxidant potential of mango peel ex-tract. Food Chem 105: 982-988.
3. Ali SS, Kasoju N, Luthra A, Singh A, Sharanabasava H, Sahu A, Bora U. 2008. Indian medicinal herbs as sources of anti-oxidants. Food Res Int 41: 1-15.
4. Hygreeva D, Pandey MC, Radhakrishna K. 2014. Potential ap-plications of plant based derivatives as fat replacers, antioxi-dants and antimicrobials in fresh and processed meat prod-ucts. Meat Sci 98: 47-57.
5. Jacobson S. 2003. The worldwide potential for quinoa (Che-nopodium quinoa Willd.). Food Rev Int 19: 167-177.
6. Repo-Carrasco-Valencia R, Hellström JK, Pihlava JM, Mattila PH. 2010. Flavonoids and other phenolic compounds in Andean indigenous grains: quinoa (Chenopodium quinoa), kañiwa (Chenopodium pallidicaule) and kiwicha (Amaranthus caudatus). Food Chem 120: 128-133.
7. Vega-Gálvez A, Miranda M, Vergara J, Uribe E, Puente L, Martínez EA. 2010. Nutrition facts and functional potential of quinoa (Chenopodium quinoa willd.), an ancient Andean grain: a review. J Sci Food Agric 90: 2541-2547.
8. Benavente-García O, Castillo J. 2008. Update on uses and properties of citrus flavonoids: new findings in anticancer, cardiovascular, and anti-inflammatory activity. J Agric Food Chem 56: 6185-6205.
9. Tang Y, Li X, Zhang B, Chen PX, Liu R, Tsao R. 2015. Charac-terisation of phenolics, betanins and antioxidant activities in seeds of three Chenopodium quinoa Willd. genotypes. Food Chem 166: 380-388.
10. Miranda M, Delatorre-Herrera J, Vega-Gálvez A, Jorquera E, Quispe-Fuentes I, Martínez EA. 2014. Antimicrobial poten-tial and phytochemical content of six diverse sources of qui-noa seeds (Chenopodium quiqui-noa Willd.). Agric Sci 5: 1015-1024. 11. Hirose Y, Fujita T, Ishii T, Ueno N. 2010. Antioxidative prop-erties and flavonoid composition of Chenopodium quinoa seeds cultivated in Japan. Food Chem 119: 1300-1306.
12. Paśko P, Bartoń H, Zagrodzki P, Gorinstein S, Fołta M, Zachwieja Z. 2009. Anthocyanins, total polyphenols and an-tioxidant activity in amaranth and quinoa seeds and sprouts during their growth. Food Chem 115: 994-998.
13. Gorinstein S, Lojek A, Číž M, Pawelzik E, Delgado‐Licon E, Medina OJ, Moreno M, Salas IA, Goshev I. 2008. Comparison of composition and antioxidant capacity of some cereals and pseudocereals. Int J Food Sci Tech 43: 629-637.
14. Bhaduri S. 2016. An assessment of antioxidant and anti-pro-liferative activities of super grain quinoa. J Food Process Technol 7: 549.
Association of Official Analytical Communities, Gaithers-burg, MD, USA. p 1-26.
16. Al-Saeedi AH, Hossain MA. 2015. Total phenols, total flavo-noids contents and free radical scavenging activity of seeds crude extracts of pigeon pea traditionally used in Oman for the treatment of several chronic diseases. Asian Pac J Trop Dis 5: 316-321.
17. Wootton-Beard PC, Moran A, Ryan L. 2011. Stability of the total antioxidant capacity and total polyphenol content of 23 commercially available vegetable juices before and after in vitro digestion measured by FRAP, DPPH, ABTS and Folin- Ciocalteu methods. Food Res Int 44: 217-224.
18. Guo C, Yang J, Wei J, Li Y, Xu J, Jiang Y. 2003. Antioxidant activities of peel, pulp and seed fractions of common fruits as determined by FRAP assay. Nutr Res 23: 1719-1726. 19. Sethiya NK, Trivedi A, Mishra S. 2014. The total antioxidant
content and radical scavenging investigation on 17 phyto-chemical from dietary plant sources used globally as func-tional food. Biomed Prev Nutr 4: 439-444.
20. Brighente I, Dias M, Verdi L, Pizzolatti M. 2007. Antioxidant activity and total phenolic content of some Brazilian species. Pharm Biol 45: 156-161.
21. Brand-Williams W, Cuvelier M, Berset C. 1995. Use of a free radical method to evaluate antioxidant activity. LWT-Food Sci Technol 28: 25-30.
22. Klančnik A, Piskernik S, Jeršek B, Možina SS. 2010. Evalua-tion of diffusion and diluEvalua-tion methods to determine the anti-bacterial activity of plant extracts. J Microbiol Methods 81: 121- 126.
23. Kurekci C, Padmanabha J, Bishop-Hurley SL, Hassan E, Al Jassim RA, McSweeney CS. 2013. Antimicrobial activity of essential oils and five terpenoid compounds against Campylo-bacter jejuni in pure and mixed culture experiments. Int J Food Microbiol 166: 450-457.
24. Ponce A, Fritz R, Del Valle C, Roura S. 2003. Antimicrobial activity of essential oils on the native microflora of organic Swiss chard. LWT-Food Sci Technol 36: 679-684.
25. Choi KM, Yeon SI, Shin JS, Yong DE, Lee KW, Kim DS. 2006. Serotype and antimicrobial susceptibility of Streptococcus pneumoniae. Infect Chemother 38: 179-185.
26. Kozioł M. 1992. Chemical composition and nutritional
eval-uation of quinoa (Chenopodium quinoa Willd.). J Food Compost Anal 5: 35-68.
27. Dini A, Rastrelli L, Saturnino P, Schettino O. 1992. A com-positional study of Chenopodium quinoa seeds. Mol Nutr Food Res 36: 400-404.
28. Wright K, Pike O, Fairbanks D, Huber C. 2002. Composition of Atriplex hortensis, sweet and bitter Chenopodium quinoa seeds. J Food Sci 67: 1383-1385.
29. Alvarez-Jubete L, Wijngaard H, Arendt EK, Gallagher E. 2010. Polyphenol composition and in vitro antioxidant activ-ity of amaranth, quinoa buckwheat and wheat as affected by sprouting and baking. Food Chem 119: 770-778.
30. Xu B, Chang S. 2007. A comparative study on phenolic pro-files and antioxidant activities of legumes as affected by ex-traction solvents. J Food Sci 72: S159-S166.
31. Bozin B, Mimica-Dukic N, Samojlik I, Goran A, Igic R. 2008. Phenolics as antioxidants in garlic (Allium sativum L., Alliac-eae). Food Chem 111: 925-929.
32. Karagözler AA, Erdağ B, Emek YÇ, Uygun DA. 2008. Antiox-idant activity and proline content of leaf extracts from Dorys-toechas hastata. Food Chem 111: 400-407.
33. Yawadio Nsimba R, Kikuzaki H, Konishi Y. 2008. Antioxi-dant activity of various extracts and fractions of Chenopodium quinoa and Amaranthus spp. seeds. Food Chem 106: 760-766. 34. Yu L, Perret J, Harris M, Wilson J, Haley S. 2003. Antioxidant
properties of bran extracts from “Akron” wheat grown at dif-ferent locations. J Agric Food Chem 51: 1566-1570.
35. Huang D, Ou B, Prior RL. 2005. The chemistry behind anti-oxidant capacity assays. J Agric Food Chem 53: 1841-1856. 36. Stratil P, Klejdus B, Kubáň V. 2006. Determination of total
content of phenolic compounds and their antioxidant activi-ty in vegetables evaluation of spectrophotometric methods. J Agric Food Chem 54: 607-616.
37. Gallardo C, Jiménez L, García-Conesa M. 2006. Hydroxycin-namic acid composition and in vitro antioxidant activity of se-lected grain fractions. Food Chem 99: 455-463.
38. Chaturvedi N, Sharma P, Vishnoi D. 2013. Appraisal of anti-microbial activity of malted psedocereals: Amaranthus cruentus (amaranth) and Fagopyrum csculentum (buckwheat). Int J Res Pharm Sci 3: 183-190.