13
대용량 리튬 이온 배터리용 Active 방전시험기의 개발
Development of active discharge tester for high capacity lithium-ion battery
박준형a, 가니 도가라 유나나b, 박찬원c*
Joon-Hyung Parka, Gani Dogara Yunanab, Chan Won Parkc*
a Korea Hydro & Nuclear Power Co., Ltd, (38120) 1655, Bulguk-ro, Yangbuk-myeon, Gyeongju-si, Gyeongsangbuk-do, Republic of Korea b Topfield, Co., Ltd, (24461) #101, 882, Baksa-ro, Seo-myeon, Chuncheon-si, Gangwon-do, Republic of Korea c Dept. of electrical and electronics engineering, (24341) #321, Engineering Dept. BLDG #1, 1, Kangwondaehak-gil,
Chuncheon-si, Gangwon-do, Republic of Korea
Received 29 August 2020; Revised 14 October 2020; Accepted 22 October 2020
Abstract
Lithium-ion batteries have a small volume, light weight and high energy density, maximizing the utilization of mobile devices. It is widely used for various purposes such as electric bicycles and scooters (e-Mobility), mass energy storage (ESS), and electric and hybrid vehicles. To date, lithium-ion batteries have grown to focus on increasing energy density and reducing production costs in line with the required capacity. However, the research and development level of lithium-ion batteries seems to have reached the limit in terms of energy density. In addition, the charging time is an important factor for using lithium-ion batteries. Therefore, it was urgent to develop a high-speed charger to shorten the charging time.
In this thesis, a discharger was fabricated to evaluate the capacity and characteristics of Li-ion battery pack which can be used for e-mobility. To achieve this, a smart discharger is designed with a combination of active load, current sensor, and temperature sensor. To carry out this thesis, an active load switching using sensor control circuit, signal processing circuit, and FET was designed and manufactured as hardware with the characteristics of active discharger. And as software for controlling the hardware of the active discharger, a Raspberry Pi control device and a touch screen program were designed. The developed discharger is designed to change the 600W capacity battery in the form of active load.
Keywords: Lithium-ion battery, Discharger, Discharge tester, MOSFET, Raspberry Pi, Load resistor
a Li-ion battery pack was developed. It was intended to develop device that combines active load, current sensor and temperature sensor and use it to evaluate the characteristics of lithium-ion batteries. Existing discharge technology includes a method of switching a variable load with a mechanical switch and an electronic load method using expensive IGBTs[5].
In order to perform this thesis, we designed and fabricated active load switching using sensor control circuit, signal processing circuit, and FET as hardware with the characteristics of active discharge. In addition, Raspberry Pi controller and touch screen program were designed as software for controlling the hardware of the active discharger. The developed discharger is designed to enable various settings with a 600W capacity battery as an active load[6].
1. Introduction
Lithium-ion batteries have a small volume, light weight, and high energy density to maximize the utilization of mobile devices. And it is widely used for various purposes such as electric bicycles, scooters (e-Mobility), energy storage system(ESS), and electric and hybrid vehicles[1, 2].
One of important factors in the use of lithium-ion batteries is the charging time. It was an urgent task to develop a fast charger that can shorten the battery charging time[3, 4]. Therefore, it is necessary to design and manufacture a systematic and ready-to-use discharger[4]. In this thesis, a discharger for evaluating the capacity and characteristics of
* Corresponding author. Tel.: +82-33-250-6294 fax: +82-33-259-5674 E-mail address: [email protected] (Chan Won Park).
2. Active Discharger Configuration with Hardware and
Software Design
2.1 Introduction of Li-ion battery
During repeated charging and discharging lithium-ion batteries, the volume change of graphite occurs and the structural deformation gradually increases, thereby decreasing the life[7]. When lithium ions are inserted into graphite, the volume of graphite also increases by about 10%[1]. Due to such chemical and electrical changes, heat is generated in the battery during charging and discharging, and the temperature rises according to the discharge rate[8, 9]. As the number of charging and discharging cycles of a lithium ion battery increases, the life of the battery becomes shorter[10-14]. Researches to improve the electrochemical properties of these lithium ion batteries are being conducted not only in terms of physical properties, but also in terms of use such as charging and discharging.
In this thesis, an 18650 battery with 14s4p structure is used, and it is widely used in the e-mobility product line[1] The performance was tested with a 14s4p type 18650 battery pack that supplies 51.8V by connecting 14 batteries with 3.7V nominal voltage in series and 4 batteries in parallel in order to increase the capacity for e-mobility equipment.
2.2 System Configuration of Active Discharger
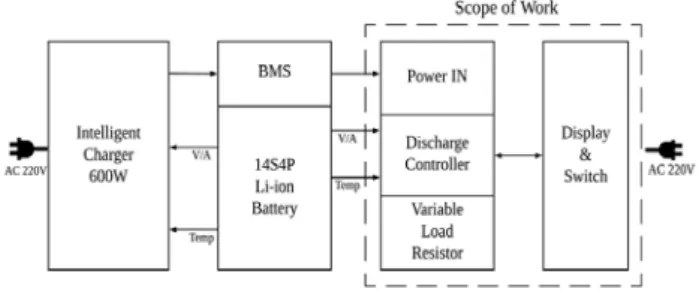
The developed discharger is part of a fast charger development project that charges a 14s4p lithium-ion battery with high speed. 500 charging and discharging cycle experiment was performed. The purpose was to check the life characteristics of the battery through 500 cycle charging and discharging, and to check whether fast charging affects the life of the battery. And the scope of work of the discharger in the whole project including charger is shown in Fig. 1. It is divided into Power input, Discharge Controller, Variable Load Resistor and Display&Switch.
Fig. 1 The scope of work of the discharger
When a command for discharge is input in the Display&Switch module, the Discharge Controller discharges by controlling the current from the 14s4p Li-ion Battery to the Variable Load Resistor according to the discharge rate setting. The Discharger Controller monitors the voltage, current and discharge temperature of the battery to prevent the battery from overheating. Raspberry Pi was used as the main controller, and 10-inch color TFT LCD touch display panel was used to input various discharge settings and to display information such as voltage and current. In addition, it was possible to set the over-discharge prevention with voltage and current limit with a touch screen. The interface board is configured to drive the switching operation of the load resistor and interfaced with the controller. The resistor-switching board is equipped with multiple load resistors and FET arrays to facilitate the role of an active load.
Fig. 2 shows the configuration of the active discharger hardware.
Fig. 2 Configuration of the active discharger hardware
The battery temperature can be monitored by connecting the external 8-channel (NTC) input terminal to the temperature sensor installed at each cell location of the battery to prevent damage during discharge. Forced-air cooling fans and a USB memory device were installed.
The power supply of the circuit is unstable with one supply power supply (SMPS) because this discharger is concerned about sudden current change and switching and noise generation due to pulse change. Therefore, the power for Raspberry Pi control board (SMPS1) and the power for A/D converter (SMPS2) are separated so that noise interference does not occur at least.
15
Fig. 3 Circuit configuration of the discharger
All control functions of the touch control input and discharge functions are performed on the Raspberry Pi control board. The sensor signal conditioning board for voltage, current, and temperature was connected to the Raspberry Pi board. The variable load resistance was connected to the FET switching board to adjust the load, and cooling fans were installed to prevent heat generation of the load resistance.
The small voltage output obtained from the voltage, current, and temperature sensors is amplified by an amplifier composed of OPA2350, and adjusted to a level sufficiently recognized by the ADC (ADS1115IDG). The value converted to digital information is logically converted into a 74LVC064 buffer inverter, and is connected in serial communication with a Raspberry Pi board through a dual bus buffer (PCA9600D) through an optocoupler (ACSL6420) for isolation by potential difference. In addition, in order to improve the stability of the operation signal and immunity to noise, the signal transmission of the circuit was stabilized by connecting pull-up resistors at each signal transmission step of each component. The Raspberry Pi board determines the discharge current based on information from the sensor and controls the gate signal of the switching FET device that matches this value. The output gate signal controls the current connected to 8 load resistors by switching the power FET (IRF468P) through the gate driver.
The actual manufactured circuit board is shown in Fig. 4.
Fig. 4 I/O ADC circuit board with separate optocoupler board
In Fig. 4, an optocoupler board is separately installed. For the purpose of communication stability, isolation of potential difference between the communication line and the circuit is enhanced.
Fig. 5 shows the load resistor and cooling fans. The 8 load resistors are installed in four sets with different resistance for active control.
Fig. 5 Load resistors of 4 sets with different types.
2.3 Control Software
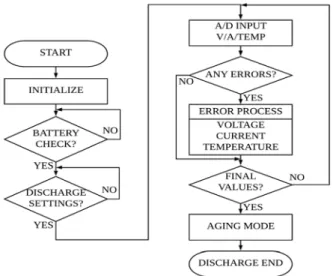
The software has an algorithm that controls hardware composed of sensor circuits, MPUs, and peripheral circuits and controls smooth discharge. The software is a regular interrupt program during the main program, and performs various sensor recognition and control functions. The interrupter acquires the data of each cycle sensor and sends it to the MPU. In the initial input stage, the set value is continuously monitored, and when the set value is exceeded, appropriate voltage current adjustment is performed with an indication. At the same time, the temperature of the load resistance inside the discharger cabinet was monitored to operate the internal cooling fan according to the set temperature. When the parameters of the battery reached the set value, it entered the aging mode so that the discharge could be terminated with the optimal cell balance.
At the start of the discharger, it initializes various parts and communication conditions set, and interrupt settings. The interrupter program acquires sensor data every 5ms and transmits it to the Raspberry Pi board. Fig. 7 and Fig. 8 show the flowchart of the communication program and interrupter program respectively.
Fig. 7 Communication Program Fig. 8 Interrupter Program
2.4 Design and Calculation of Cooling Fan Capacity
The cooling capacity was calculated to remove the heat of 600W within a temperature rise range about 10°C with a cooling fan air volume of 4.41 CMM or more. And three cooling fans with a capacity of 6.0 CMM were installed at the bottom.
2.5 Fabrication and Operation of Discharger
The cabinet consists of three floors. As shown in Fig. 9, the cabinet is equipped with an LCD screen that can be input and controlled on the front, 8 temperature sensor input terminals, a battery power connection, and a main power MCCB and 3 cooling fans at the bottom. Fig. 10 shows 2 sets of SMPS at the top inside the cabinet, the middle MOSFET, and the load resistor 8ea at the bottom.
14s4p battery pack
battery power and sensors connector
Fig. 9 Front View
SMPS 1,2
MOSFET
Load Resistor
Fig. 10 Rear View
3. Experiment and Consideration
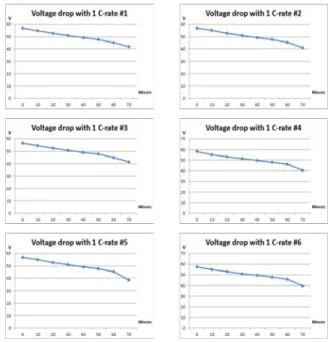
3.1 Voltage drop characteristics according to discharge rate The voltage measurement according to the discharge was performed at discharge rates of 0.5C, 1.0C and 2.0C with a 14s4p battery pack in the discharger. For each discharge rate, six discharge experiments were conducted and when voltage of the 18650 battery reached 42V, which corresponds to each cell voltage 3.0V, discharge was stopped.
Fig. 11, 12 and 13 show the voltage drop results.
Fig. 11 Discharge voltage drop of 14s4p battery with 0.5C rate
17
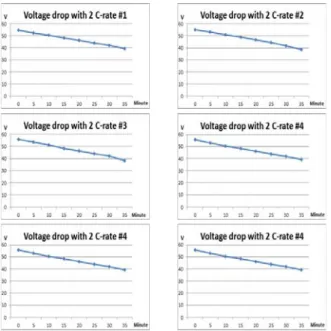
Fig. 13 Discharge voltage drop of 14s4p battery with 2C rate
The voltage drop graph shows similar pattern with 0.5C, 1.0C and 2.0C respectively. Within the target voltage drop and the discharger was stopped to discharge for battery protection. The discharge capacity was 300W, 600W and 1200W respectively with 0.5C, 1.0C and 2.0C rate. The discharge current was maintained at the target level exactly during discharge and dropped to 0 Amp after reaching the target voltage.
3.2
Temperature Rise according to Discharge RateThe battery temperature rise results by the discharge rate of 0.5C, 1.0C and 2.0C are shown in Fig 14.
Fig. 14 Temperature rise curve with 0.5C, 1.0C and 2.0C discharge rate
Since the amount of heat generated by discharge inside the battery is small, it seems that the ambient temperature outside has a greater effect than the heat inside the battery in 0.5C rate test. It can be seen that the temperature difference between before and after the start of the discharge is insignificant within 2 to 3°C.
3.3 Temperature Rise of Discharger Cabinet
The actual temperature rise of the discharger cabinet according to the design analysis of the cooling fan capacity was confirmed. Fig. 15 shows a thermal imaging camera measurement. The temperature rise was within the designed range with cooling fan capacity analysis. The thermal camera is FLIR i7 model and it has ± 2% accuracy with thermal sensitivity of 0.1 and temperature range from 20 to 250 .
4. Conclusion
In this thesis, the experimental results of discharging a 14p4s Li-ion battery pack with discharge rates of 0.5C, 1.0C and 2.0C are summarized. As a result of the experiment, it was discharged accurately at each set discharge rate. In the case of the voltage characteristic, the voltage of the 14s4p battery pack was discharged to 40V to protect the lithium ion battery, and the battery voltage was linearly reduced. In the current characteristic, the battery pack was discharged to the load resistor through MOSFET control with a constant current (CC) and discharged until the set voltage was reached for about 2 hours, 1 hour and 30 minutes depending on the discharge rate respectively. The overall temperature of the cabinet showed a temperature rise within 10°C, indicating that there was no difficulty in using it without deteriorating performance.
In conclusion, the developed discharger was used for 500 charge and discharge cycle tests of a 600W class lithium-ion battery together with a fast charger developed separately from this thesis, which worked well. As it is possible to identify the discharge characteristics of batteries with this discharger and predict the life span of batteries, it is expected to be used as a necessary device for the development research of various high capacity Li-ion batteries as well as e-mobility batteries.
References
[1] INI R&C, 2019, 2019년 이차전지 산업경쟁력 조사, Korea Trade Commission.
[2] Korea Energy Economics Institute, 2019, A Study for the Vitalization of Electric Vehicle Charging Service Industry in Korea, Korea Trade Commission.
[3] IEA, viewed 21 Mar 2020, Global EV Outlook 2019, <https://www.iea.org/reports/global-ev-outlook-2019>.
[4] Myriam Neaimeh, Shawn D. Salisbury., 2005, Analysing the usage and evidencing the importance of fast chargers for the adoption of battery electric vehicles, Energy Policy 108 (2017): 474-486. [5] Balophg, Laszio, 2018, Fundamentals of MOSFET and IGBT Gate
Driver Circuits, Texas Instruments.
[6] Raspberry Pi, viewed 2 Apr 2020, Raspberry Pi 3 Model B, <https://www.raspberrypi.org/products/raspberry-pi-3-model-b>. [7] A. Pfrang, A. Kersys., 2018, Long-term cycling induced jelly roll
deformation in commercial 18650 cells, Journal of Power Sources 392 (2018): 168-175.
[8] S. Panchal, M. Mathew., 2018, Electrochemical thermal modeling and experimental measurements of 18650 cylindrical lithium-ion battery during discharge cycle for an EV., Applied Thermal Engineering 135 (2018): 123-132.
[9] Tianfen Gao, Zhirong Wang., 2019, Hazardous characteristics of charge and discharge of lithium-ion batteries, International Journal of Heat and Mass Transfer 141 (2019): 419-431.
[10] Martin Novak, Jan Chysky., 2020, Data from long time testing of 18650 lithium polymer batteries, Data in brief 29 (2020): 105137 [11] M.F.H. Rani, Z.M. Razlan., 2020, Comparative study of surface temperature of lithium-ion polymer cells at different discharging rates by infrared thermography and thermocouple, International Journal of Heat and Mass Transfer 153 (2020): 119595. [12] Yang Li, Mingbiao Chen., 2019, Thermal equilibrium characteristic
of large-size lithium-ion pouch battery: resting time between charge and discharge, Energy Procedia 158 (2019): 2623-2630.
[13] Thomas S. Brydena, Alexander Hollanda., 2018, Lithium-ion degradation at varying discharge rates, Energy Procedia 151 (2018): 194-198.
[14] Ti Dong, Peng Peng., 2018, Numerical modeling and analysis of
the thermal behavior of NCM lithium-ion batteries subjected to very high C-rate discharge/charge operations, International Journal of Heat and Mass Transfer 117 (2018): 261-272.