저작자표시-비영리-변경금지 2.0 대한민국 이용자는 아래의 조건을 따르는 경우에 한하여 자유롭게 l 이 저작물을 복제, 배포, 전송, 전시, 공연 및 방송할 수 있습니다. 다음과 같은 조건을 따라야 합니다: l 귀하는, 이 저작물의 재이용이나 배포의 경우, 이 저작물에 적용된 이용허락조건 을 명확하게 나타내어야 합니다. l 저작권자로부터 별도의 허가를 받으면 이러한 조건들은 적용되지 않습니다. 저작권법에 따른 이용자의 권리는 위의 내용에 의하여 영향을 받지 않습니다. 이것은 이용허락규약(Legal Code)을 이해하기 쉽게 요약한 것입니다. Disclaimer 저작자표시. 귀하는 원저작자를 표시하여야 합니다. 비영리. 귀하는 이 저작물을 영리 목적으로 이용할 수 없습니다. 변경금지. 귀하는 이 저작물을 개작, 변형 또는 가공할 수 없습니다.
Motion effect on the measurement of
stiffness on ultrasound elastography:
A moving liver fibrosis phantom study
Hyun Joo Shin
Department of Medicine
Motion effect on the measurement of
stiffness on ultrasound elastography:
A moving liver fibrosis phantom study
Directed by Professor Myung-Joon Kim
The Doctoral Dissertation
submitted to the Department of Medicine
the Graduate School of Yonsei University
in partial fulfillment of the requirements for the degree
of Doctor of Philosophy
Hyun Joo Shin
This certifies that the Doctoral
Dissertation of Hyun Joo Shin is
approved.
Thesis Supervisor : Myung-Joon Kim
---Thesis Committee Member#1 : Choon-Sik Yoon
---Thesis Committee Member#2 : Kwanseop Lee
---Thesis Committee Member#3: Kwan Sik Lee
---Thesis Committee Member#4: Jong-Chul Park
The Graduate School
Yonsei University
ACKNOWLEDGEMENTS
First, I would like to express my deepest gratitude to my thesis supervisor, Professor Myung-Joon Kim, for supporting my efforts with total commitment and for his guidance during my entire research and the steps needed for publication. I truly appreciate his encouragement of this project and also of my career as a radiologist. His belief gave me confidence during this project and has helped me mature as a pediatric radiologist.
I appreciate the encouragement and support given by Professors Choon-Sik Yoon and Kwanseop Lee for this study. Their painstaking attention to detail helped me improve the entire research process. They are both dedicated and warm-hearted pediatric radiologists and I would like express my deepest respect to these professors for more than just their professional insight on this study. Also, I would like to thank Professors Kwan Sik Lee and Jong-Chul Park, for their valuable advice in assuring the quality of this manuscript. Their support significantly improved this study and I learned a lot from them.
I would also like to sincerely thank Professor Mi-Jung Lee. Her professional and empathic approach toward pediatric patients showed me how to work with passion and also showed me how to enjoy the research process with courage.
And last but not least, I express my love and gratitude to my parents who have unconditionally supported me and believed in me, in everything I do. They have made it possible for me to be a good doctor, a good wife and a beloved mother of two children. To my husband, thank you for always helping me and supporting me emotionally. To my children, my lovely daughter, Eun-Yool, and my little son, Eun-Chan, thank you for being my kids. Your presence has given me strength and made be grateful to God. Finally, I thank God, who has guided me always, and kept me on his path.
<TABLE OF CONTENTS>
ABSTRACT ···1
I. INTRODUCTION ···4
II. MATERIALS AND METHODS···6
1. Ultrasound elastography···6
2. Phantoms and motion simulation ···7
3. Statistical analysis ···10
III. RESULTS ···11
1. Comparison of the elasticities between moving and static status ···11
(A) With the phantoms in an upright position at the lowest velocity of
30 rpm ···11
(B) Increasing velocity to 60 rpm with the phantoms in an upright
position ···11
(C) With the phantoms laid on their sides at the velocity of 30 rpm
···12
2. Evaluation of the depth less affected by motion···16
3. Measurement failure ···19
IV. DISCUSSION ···21
V. CONCLUSION ···26
REFERENCES ···28
LIST OF FIGURES
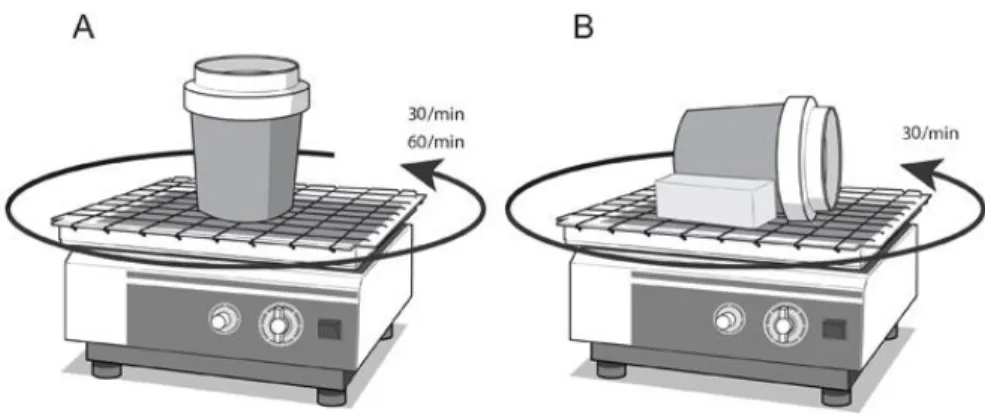
Figure 1. To simulate regular motion, the liver fibrosis elasticity
phantoms of 3 and 16.9 kPa were put on the table of the Orbital
Shaker ··· 9
LIST OF TABLES
Table 1. Comparison of the elasticities between moving and
static status··· 13
Table 2. Evaluation of the depth less affected by the motion··· 17
Table 3. Measurement failure during the twenty repeats of
ABSTRACT
Motion effect on the measurement of stiffness on ultrasound
elastography: A moving liver fibrosis phantom study
Hyun Joo Shin
Department of Medicine
The Graduate School, Yonsei University
(Directed by Professor Myung-Joon Kim)
Purpose
The recommended method for measurement of tissue elasticity using ultrasound elastography is the breath-hold technique. However, for infants and young children, and even sometimes for adults, sustaining a breath-hold is not easy. To utilize the advantages of ultrasound elastography in these populations, it is essential to know how motion affects the measurement of elasticity. Therefore, the purpose of this study was to evaluate the effect of motion on tissue elasticity measurement on ultrasound elastography using moving liver fibrosis phantoms.
Materials and Methods
Ultrasound elastography was performed with both convex and linear transducers of supersonic shear wave imaging (SSI) and acoustic radiation force impulse imaging (ARFI). Liver elasticity phantoms of custom-made stiffnesses
of 3.0 and 16.9 kPa were used, and the Orbital Shaker was used to make regular circular and horizontal motions. The elasticities were measured at depths of 2, 3, 4, and 5 cm with measurements repeated 20 times for each depth. Motion velocities were 30 and 60 rpm with the phantoms in an upright position on the shaker to replicate the respiratory rates of children. To simulate different directional motion, we laid the phantoms on their side on the table of shaker at 30 rpm. The Wilcoxon signed-rank test was used to compare values between moving and static status. The Mann-Whitney U and Kruskal-Wallis tests were used to compare the differences between moving and static status between all depths. The number of measurement failures was counted during the acquisitions.
Results
In SSI, the convex transducer was less affected by motion at 30 rpm with the 3 kPa phantom. At 30 rpm, SSI showed a tendency for elasticity values to increase during movement than in static status, regardless of the direction of the motion. Otherwise, most values from SSI were different between moving and static status in the higher velocity motion (60 rpm), or in the higher stiffness phantom (16.9 kPa). In ARFI, when using the convex transducer, measurements made at 4 cm depth were less affected by motion. With the linear transducer, measurements made at 2 cm depth were less affected by motion when using the 3 kPa phantom. There were frequent measurement failures using ARFI,
especially in moving status.
Conclusion
Motion affected the measurement of elasticity differently according to machine, phantom stiffness, acquisition depth, transducer, and velocity and direction of the motion. The convex transducer of SSI was more stable for the slowly moving (represents normal respiratory rates, except for neonates), low stiffness phantom (represents normal liver). However, using SSI, the values in moving status were significantly different in the higher velocity motion or in the stiffer phantom (such as in liver fibrosis), even though values could be easily obtained without measurement failures. With ARFI, measurements made at specific depths were shown to be more stable during motion according to which transducer was applied. However, there were frequent measurement failures using ARFI, especially in moving status. This study supported that the different setting was needed according to the purpose of examination and condition of the patients for measurement of elasticity.
---Key words : ultrasound, elastography, shear wave velocity, movement
Motion effect on the measurement of stiffness on ultrasound
elastography: A moving liver fibrosis phantom
Hyun Joo Shin
Department of Medicine
The Graduate School, Yonsei University
(Directed by Professor Myung-Joon Kim)
I. INTRODUCTION
Ultrasound elastography is a technique that measures tissue stiffness. It is widely used to quantitatively measure the stiffness of organs such as the liver, kidney and spleen for various clinical conditions.1-4In addition, it is also used to
evaluate tumor, and to differentiate malignant tumors from benign tumors using
differences in cellular component and tissue stiffness.5-7 Ultrasound
elastography has many benefits because it is noninvasive, simple to perform and poses no risk of radiation exposure to both adults and children. However, measured values of ultrasound elastography can be affected by the type of machine or transducer chosen, the acquisition depth, and various clinical conditions of the patients themselves.8-10 Among them, one of the possible
reasons for differences in elasticity values is the motions made by the patient. Motion made by the patient is the most important factor to influence ultrasound examination results, especially for the abdominal organs. The term,
‘motion’ includes both voluntary and involuntary motions. Voluntary motion is more problematic for pediatric patients, as it takes longer to perform ultrasound examinations and younger patients have a harder time staying still. Involuntary motion, such as respiratory motion and cardiac and vascular pulsations, is more complicated in pediatric patients, because respiratory or heart rates are normally much faster in neonate and infants, compared to that of adults. For example, in the healthy pediatric population, the normal respiratory rates range from 30-60 breaths/min for infants, to 12-16 breaths/min for adolescents. Then, there are patients who are not part of the pediatric population, but for whom involuntary motion becomes a problem. Many adult patients have the same difficulties in holding their breath because of old age and cardiac or respiratory problems.
A recently published consensus recommended the breath-hold technique for ultrasound elastography examinations.11 However, for infants and
young children, and even sometimes for adults, sustaining a breath-hold for a few seconds is not easy - almost impossible. Therefore, to utilize the advantages of ultrasound elastography in these populations, it is essential to know how motion affects the measurement of shear wave velocities (SWVs). To our knowledge, there have been few studies which have focused on the effect of motion on the measurement of SWV.
Therefore, the purpose of this study was to evaluate the effect of motion on the measurement of SWV on ultrasound elastography, using moving liver fibrosis elastography phantoms.
II. MATERIALS AND METHODS 1. Ultrasound elastography
To perform ultrasound elastography, two different machines were used. One was supersonic shear wave imaging (SSI, Aixplorer, SuperSonic Imagine, Aix-en-Provence, France). For SSI, 1-6 MHz low frequency convex and 2-10 MHz high frequency linear transducers were used. SWVs were measured 20 times each for 2, 3, 4 and 5 cm depths. A round region-of-interest (ROI) was drawn on the gray scale image of ultrasound, and the mean value in kPa was automatically presented as the representative value. The value was selected when the color within the ROI was homogeneous.
The second machine to be used was acoustic radiation force impulse imaging (ARFI, ACUSON S3000, Siemens Healthcare, Erlangen, Germany). For ARFI, 1-6 MHz low frequency convex and 4-9 MHz high frequency linear transducers were used. Measurements were repeated 20 times each for 2, 3, 4, and 5 cm depths. However, values were not obtained at 5 cm depth with the linear transducer, because the ROI box could not be positioned more than 4 cm deep with the linear transducer of the machine used. The mean value in m/sec was selected as the representative value for this machine. The values in m/sec were then converted to values in kPa using the equation; E = 3*(SWV)2, for
which the E is Young’s modulus in kPa, and SWV is in m/sec.8,10In addition,
repeats of measurement, and failure was assumed when measured values appeared as X.XX m/sec, instead of as any nominal values.
2. Phantoms and motion simulation
Liver fibrosis elasticity phantoms (The Shear Wave Liver Fibrosis Phantom, model 039, CIRS, Norfolk, Virginia, USA) of two known custom-made stiffnesses of 3.0 and 16.9 kPa were used. To simulate regular motion, the Orbital Shaker (SH30, 11.8" X 11.8" Platform with Timer, FinePCR, Korea) was used. This shaker is frequently used in laboratories to mix fluids because of its regular, horizontal and circular motion.
First, the phantom was put on the table of the shaker in an upright position (1) at a velocity of 30 rpm. After that, the velocity was (2) increased to 60 rpm with the phantom in the same position to replicate the diverse respiratory rates of young children. (3) Next, to simulate different anteroposterior directional motion toward the transducers, the phantom was laid on its side on the table of the shaker at a velocity of 30 rpm (Fig 1). Because the phantoms were cylindrical in shape, two sponges were put on each side of the phantom to secure it during motion. This attempt to replicate different directional motion was done because when performing real-life SWE for the liver, not only supero-inferior directional motion, but also antero-posterior directional motion is applied toward the transducers due to diaphragmatic motion. Even though the combined circular motion of the Orbital Shaker was
different from pure respiratory motion, we tried to imitate the diverse velocities and compound directions of continuous respiration as much as possible.
Figure 1. To simulate regular motion, the liver fibrosis elasticity phantoms of 3 and 16.9 kPa were put on the table of the Orbital Shaker. (A) The phantom was put on the table in an upright position at the velocity of 30 rpm and at the increased velocity of 60 rpm, to measure the SWVs during horizontal circular motion in an effort to replicate the respiratory rates of children. (B) Next, the phantoms were laid on their sides on the table, to create different directional motion at the velocity of 30 rpm, in an effort to replicate different directional motion toward the transducers as is seen with respiration.
3. Statistical analysis
Statistical analysis was done using SPSS version 20.0.0 (IBM Corp., Armonk, NY, USA). From the twenty measurements, median values with quartile 1 (Q1) and quartile 3 (Q3) were calculated for each condition. The Wilcoxon signed-rank test was used to compare the values between moving and static status for each depth. In addition, the Mann-Whitney U test and the Kruskal-Wallis test were used to compare the differences between moving and static status between all depths, to find out which depth was less affected by motion. The Dunn-procedure was used for the post-hoc analysis after the Kruskal-Wallis test. A p-value less than 0.05 was considered to be statistically significant.
III. RESULTS
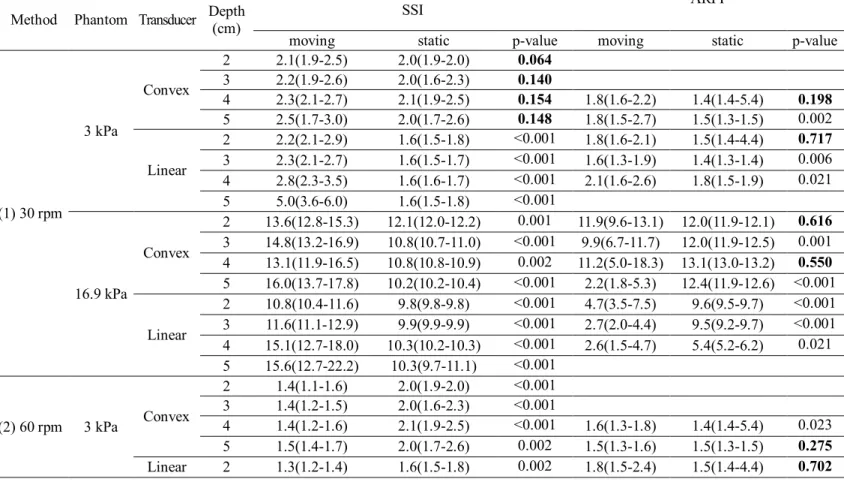
1. Comparison of the elasticities between moving and static status (Table 1)
A. With the phantoms in an upright position at the lowest velocity of 30 rpm SWVs were not significantly different between moving and static status when the convex transducer of SSI was used on the 3 kPa phantom. In addition, with SSI, the elasticities in moving status tended to be higher than those in static status on both phantoms.
When using the convex transducer of ARFI, elasticity values were unexpectedly not obtained in 2 and 3 cm depths of the 3 kPa phantom. In 4 cm depth using the convex transducer of ARFI, the values were not significantly different between moving and static status, regardless of phantom stiffness. In addition, the values were not different for the 2 cm depth of the 3 kPa phantom with the linear transducer and the 2 cm depth of the 16.9 kPa phantom with the convex transducer of ARFI. There was no tendency for velocities to increase in moving status compared to static status using ARFI. Other values were all significantly different between moving and static status using SSI and ARFI.
B. Increasing velocity to 60 rpm with the phantoms in an upright position
Most of the values from SSI were significantly different between moving and static status, except for those attained at 3 cm depth of the 3 kPa
phantom with the linear transducer and at 2 cm depth of the 16.9 kPa phantom with the convex transducer.
Using ARFI, the values were also not different between moving and static status for the 2 cm depth of the 3 kPa phantom with the linear transducer and for the 2 cm depth of the 16.9 kPa phantom with the convex transducer. There was no tendency for velocities to increase in moving status compared to static status for both SSI and ARFI.
C. With the phantoms laid on their sides at the velocity of 30 rpm
The values attained with the use of the convex transducer of SSI were not significantly different between moving and static status in all depths of the 3 kPa phantom, as were the values found with the phantom in an upright position. In comparison, most of the values found with SSI for the 16.9 kPa phantom were significantly different according to transducer and depth. Values tended being higher in moving status, compared to those of static status using SSI, similar to the trend observed when the phantoms were in an upright position.
Using ARFI, the values were not significantly different for the 4 cm depth using the convex and linear transducers on the 3 kPa phantom. In addition, the values were not different for the 2 cm depth of the 3 kPa phantom with the linear transducer, and for the 3 cm depth of the 16.9 kPa phantom with the convex transducer in ARFI.
Table 1.
Comparison of the elasticities between moving and static status
Method Phantom Transducer Depth (cm) SSI
ARFI
moving static p-value moving static p-value
(1) 30 rpm 3 kPa Convex 2 2.1(1.9-2.5) 2.0(1.9-2.0) 0.064 3 2.2(1.9-2.6) 2.0(1.6-2.3) 0.140 4 2.3(2.1-2.7) 2.1(1.9-2.5) 0.154 1.8(1.6-2.2) 1.4(1.4-5.4) 0.198 5 2.5(1.7-3.0) 2.0(1.7-2.6) 0.148 1.8(1.5-2.7) 1.5(1.3-1.5) 0.002 Linear 2 2.2(2.1-2.9) 1.6(1.5-1.8) <0.001 1.8(1.6-2.1) 1.5(1.4-4.4) 0.717 3 2.3(2.1-2.7) 1.6(1.5-1.7) <0.001 1.6(1.3-1.9) 1.4(1.3-1.4) 0.006 4 2.8(2.3-3.5) 1.6(1.6-1.7) <0.001 2.1(1.6-2.6) 1.8(1.5-1.9) 0.021 5 5.0(3.6-6.0) 1.6(1.5-1.8) <0.001 16.9 kPa Convex 2 13.6(12.8-15.3) 12.1(12.0-12.2) 0.001 11.9(9.6-13.1) 12.0(11.9-12.1) 0.616 3 14.8(13.2-16.9) 10.8(10.7-11.0) <0.001 9.9(6.7-11.7) 12.0(11.9-12.5) 0.001 4 13.1(11.9-16.5) 10.8(10.8-10.9) 0.002 11.2(5.0-18.3) 13.1(13.0-13.2) 0.550 5 16.0(13.7-17.8) 10.2(10.2-10.4) <0.001 2.2(1.8-5.3) 12.4(11.9-12.6) <0.001 Linear 2 10.8(10.4-11.6) 9.8(9.8-9.8) <0.001 4.7(3.5-7.5) 9.6(9.5-9.7) <0.001 3 11.6(11.1-12.9) 9.9(9.9-9.9) <0.001 2.7(2.0-4.4) 9.5(9.2-9.7) <0.001 4 15.1(12.7-18.0) 10.3(10.2-10.3) <0.001 2.6(1.5-4.7) 5.4(5.2-6.2) 0.021 5 15.6(12.7-22.2) 10.3(9.7-11.1) <0.001 (2) 60 rpm 3 kPa Convex 2 1.4(1.1-1.6) 2.0(1.9-2.0) <0.001 3 1.4(1.2-1.5) 2.0(1.6-2.3) <0.001 4 1.4(1.2-1.6) 2.1(1.9-2.5) <0.001 1.6(1.3-1.8) 1.4(1.4-5.4) 0.023 5 1.5(1.4-1.7) 2.0(1.7-2.6) 0.002 1.5(1.3-1.6) 1.5(1.3-1.5) 0.275 Linear 2 1.3(1.2-1.4) 1.6(1.5-1.8) 0.002 1.8(1.5-2.4) 1.5(1.4-4.4) 0.702
3 1.6(1.3-2.0) 1.6(1.5-1.7) 0.750 1.4(1.4-1.6) 1.4(1.3-1.4) 0.038 4 2.3(1.8-2.8) 1.6(1.6-1.7) 0.002 1.7(1.3-2.1) 1.8(1.5-1.9) 0.481 5 3.6(2.4-5.2) 1.6(1.5-1.8) <0.001 16.9 kPa Convex 2 12.9(11.4-15.2) 12.1(12.0-12.2) 0.086 10.7(9.6-13.3) 12.0(11.9-12.1) 0.232 3 13.1(11.6-14.6) 10.8(10.7-11.0) <0.001 8.4(7.1-11.1) 12.0(11.9-12.5) <0.001 4 14.1(11.6-17.0) 10.8(10.8-10.9) <0.001 5.9(3.7-12.0) 13.1(13.0-13.2) 0.001 5 17.7(15.7-20.3) 10.2(10.2-10.4) <0.001 2.2(1.5-3.3) 12.4(11.9-12.6) 0.002 Linear 2 12.4(10.9-14.0) 9.8(9.8-9.8) 0.001 3.7(1.6-7.5) 9.6(9.5-9.7) <0.001 3 12.8(11.5-14.1) 9.9(9.9-9.9) <0.001 5.8(4.0-7.6) 9.5(9.2-9.7) <0.001 4 15.2(13.7-18.4) 10.3(10.2-10.3) <0.001 2.6(1.7-6.2) 5.4(5.2-6.2) 0.006 5 21.1(15.8-25.2) 10.3(9.7-11.1) <0.001 (3) Phantom laid on its side 3 kPa Convex 2 1.9(1.7-2.1) 2.0(1.9-2.0) 0.643 3 2.1(1.7-2.7) 2.0(1.6-2.3) 0.268 4 2.2(2.0-2.7) 2.1(1.9-2.5) 0.303 1.6(1.5-1.8) 1.4(1.4-5.4) 0.126 5 2.3(1.7-2.9) 2.0(1.7-2.6) 0.266 1.6(1.4-2.1) 1.5(1.3-1.5) 0.004 Linear 2 1.8(1.3-2.3) 1.6(1.5-1.8) 0.304 1.6(1.6-2.0) 1.5(1.4-4.4) 0.837 3 1.8(1.5-2.9) 1.6(1.5-1.7) 0.055 1.8(1.6-2.0) 1.4(1.3-1.4) <0.001 4 2.3(1.8-3.1) 1.6(1.6-1.7) <0.001 1.8(1.4-2.4) 1.8(1.5-1.9) 0.526 5 3.8(2.6-5.0) 1.6(1.5-1.8) <0.001 16.9 kPa Convex 2 12.8(11.2-14.1) 12.1(12.0-12.2) 0.117 9.0(7.9-11.9) 12.0(11.9-12.1) 0.008 3 13.2(12.8-14.4) 10.8(10.7-11.0) <0.001 10.9(9.8-13.2) 12.0(11.9-12.5) 0.279 4 15.8(14.3-17.1) 10.8(10.8-10.9) <0.001 7.9(4.7-14.1) 13.1(13.0-13.2) 0.021 5 19.2(15.3-22.0) 10.2(10.2-10.4) <0.001 9.8(2.7-13.9) 12.4(11.9-12.6) 0.067 Linear 2 11.1(10.4-11.9) 9.8(9.8-9.8) <0.001 3.5(1.7-7.8) 9.6(9.5-9.7) <0.001 3 13.1(11.3-14.5) 9.9(9.9-9.9) <0.001 5.0(3.8-8.6) 9.5(9.2-9.7) <0.001
4 15.7(13.2-18.1) 10.3(10.2-10.3) <0.001 2.1(1.6-5.0) 5.4(5.2-6.2) 0.006 5 19.1(15.0-25.8) 10.3(9.7-11.1) <0.001
The values are presented as median (Q1-Q3) in kPa.
P-values were obtained using the Wilcoxon signed-rank test, and marked boldly if the value was larger than 0.05.
The values attained in 2, 3 cm depths of the 3 kPa phantom using the convex transducer of ARFI were unexpectedly not obtained during the experiment, and measuring elasticities at 5 cm depth using the linear transducer of ARFI was impossible with our machine.
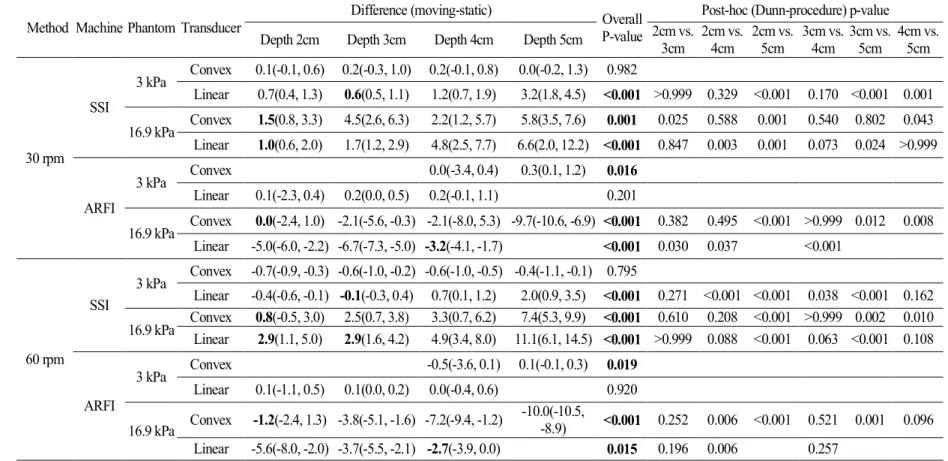
2. Evaluation for the depth less affected by motion (Table 2)
Using the convex transducer of SSI on the 3 kPa phantom, the differences between moving and static status were not significantly different between all depths, regardless of the velocities and directions of the motion (p=0.982, 0.795, 0.587, respectively). In other conditions with SSI, the differences were shown to be lower in 2-3 cm depths.
Using the linear transducer of ARFI on the 3 kPa phantom, the differences between moving and static status were not significantly different between all depths, regardless of the velocities and directions of the motion (p=0.201, 0.920, 0.077, respectively). When using the the convex transducer of the ARFI on the 16.9 kPa phantom, the most of the differences were small in 2 cm depth. However, when using the linear transducer of ARFI on the 16.9 kPa phantom, the differences were shown to be small in 4 cm depth.
Table 2. Evaluation of the depth less affected by the motion
Method Machine Phantom Transducer Difference (moving-static) OverallP-value Post-hoc (Dunn-procedure) p-value Depth 2cm Depth 3cm Depth 4cm Depth 5cm 2cm vs. 3cm 2cm vs. 4cm 2cm vs. 5cm 3cm vs. 4cm 3cm vs. 5cm 4cm vs. 5cm
30 rpm SSI 3 kPa Convex 0.1(-0.1, 0.6) 0.2(-0.3, 1.0) 0.2(-0.1, 0.8) 0.0(-0.2, 1.3) 0.982 Linear 0.7(0.4, 1.3) 0.6(0.5, 1.1) 1.2(0.7, 1.9) 3.2(1.8, 4.5) <0.001 >0.999 0.329 <0.001 0.170 <0.001 0.001 16.9 kPa Convex 1.5(0.8, 3.3) 4.5(2.6, 6.3) 2.2(1.2, 5.7) 5.8(3.5, 7.6) 0.001 0.025 0.588 0.001 0.540 0.802 0.043 Linear 1.0(0.6, 2.0) 1.7(1.2, 2.9) 4.8(2.5, 7.7) 6.6(2.0, 12.2) <0.001 0.847 0.003 0.001 0.073 0.024 >0.999 ARFI 3 kPa Convex 0.0(-3.4, 0.4) 0.3(0.1, 1.2) 0.016 Linear 0.1(-2.3, 0.4) 0.2(0.0, 0.5) 0.2(-0.1, 1.1) 0.201 16.9 kPa Convex 0.0(-2.4, 1.0) -2.1(-5.6, -0.3) -2.1(-8.0, 5.3) -9.7(-10.6, -6.9) <0.001 0.382 0.495 <0.001 >0.999 0.012 0.008 Linear -5.0(-6.0, -2.2) -6.7(-7.3, -5.0) -3.2(-4.1, -1.7) <0.001 0.030 0.037 <0.001 60 rpm SSI 3 kPa Convex -0.7(-0.9, -0.3) -0.6(-1.0, -0.2) -0.6(-1.0, -0.5) -0.4(-1.1, -0.1) 0.795 Linear -0.4(-0.6, -0.1) -0.1(-0.3, 0.4) 0.7(0.1, 1.2) 2.0(0.9, 3.5) <0.001 0.271 <0.001 <0.001 0.038 <0.001 0.162
16.9 kPa ConvexLinear 0.8(-0.5, 3.0)2.9(1.1, 5.0) 2.5(0.7, 3.8)2.9(1.6, 4.2) 3.3(0.7, 6.2)4.9(3.4, 8.0) 11.1(6.1, 14.5) <0.001 >0.999 0.088 <0.001 0.063 <0.001 0.1087.4(5.3, 9.9) <0.001 0.610 0.208 <0.001 >0.999 0.002 0.010
ARFI 3 kPa Convex -0.5(-3.6, 0.1) 0.1(-0.1, 0.3) 0.019 Linear 0.1(-1.1, 0.5) 0.1(0.0, 0.2) 0.0(-0.4, 0.6) 0.920 16.9 kPa Convex -1.2(-2.4, 1.3) -3.8(-5.1, -1.6) -7.2(-9.4, -1.2) -10.0(-10.5, -8.9) <0.001 0.252 0.006 <0.001 0.521 0.001 0.096 Linear -5.6(-8.0, -2.0) -3.7(-5.5, -2.1) -2.7(-3.9, 0.0) 0.015 0.196 0.006 0.257
Phantom laid on its side SSI 3 kPa Convex -0.1(-0.3, 0.1) 0.2(-0.3, 0.8) 0.1(-0.4, 0.8) 0.2(-0.2, 0.6) 0.587 Linear 0.2(-0.5, 0.6) 0.1(-0.2, 1.3) 0.6(0.2, 1.7) 2.0(1.2, 3.3) <0.001 >0.999 0.085 <0.001 0.453 0.001 0.063 16.9 kPa Convex 1.1(-0.9, 2.0) 2.3(2.0, 4.5) 5.0(3.5, 6.2) 9.0(4.8, 11.7) <0.001 0.080 <0.001 <0.001 0.321 0.001 0.145 Linear 1.3(0.6, 2.5) 3.1(1.4, 4.6) 5.2(2.9, 7.8) 9.5(5.2, 15.6) <0.001 0.624 0.006 <0.001 0.211 0.004 0.514 ARFI 3 kPa Convex 0.0(-3.8, 0.3) 0.2(0.0, 0.7) 0.025 Linear 0.1(-3.0, 0.6) 0.4(0.3, 0.7) 0.0(-0.4, 0.5) 0.077 16.9 kPa Convex -3.0(-4.1, -0.4) -1.3(-2.4, 1.2) -5.1(-8.4, 1.0) -2.4(-9.4, 1.5) 0.200 Linear -5.9(-8.1, -1.8) -4.4(-5.8, -0.9) -3.2(-4.0, -0.6) 0.005 0.136 0.002 0.182 The values are presented as median (Q1-Q3) in kPa. P-values were obtained using the Kruskal-Wallis or Mann-Whitney U test.
The values in 2, 3 cm depths of the 3 kPa phantom using the convex transducer of ARFI were unexpectedly not obtained during the experiments, and measuring elasticities at 5 cm depth using the linear transducer of ARFI was impossible with our machine. Abbreviations: SSI supersonic shear wave imaging; ARFI acoustic radiation force impulse
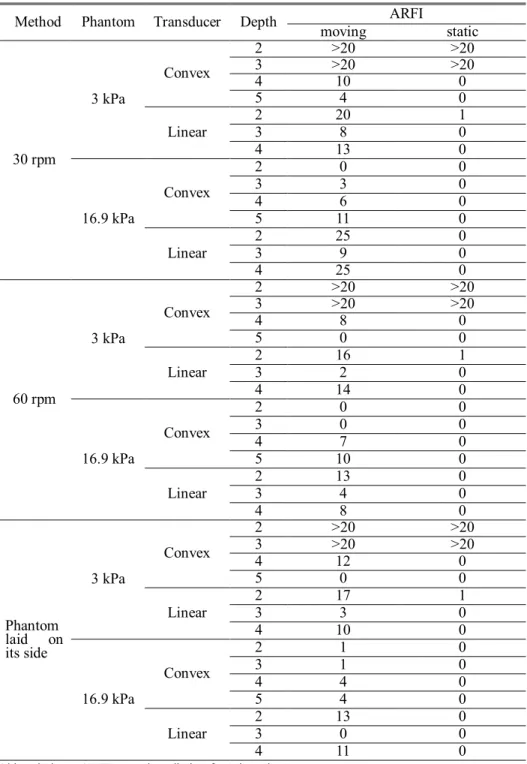
3. Measurement failure (Table 3)
There was no measurement failure using SSI during moving and static status. However, when using ARFI, values were unexpectedly not obtained in 2 and 3 cm depths of the 3 kPa phantom with the convex transducer and higher failure rates were observed during the twenty repeat measurements of the acquisitions. In addition, there were frequent measurement failures using ARFI, especially in moving status.
Table 3. Measurement failure during the twenty repeats of acquisition using ARFI
Method Phantom Transducer Depth ARFI
moving static 30 rpm 3 kPa Convex 2 >20 >20 3 >20 >20 4 10 0 5 4 0 Linear 2 20 1 3 8 0 4 13 0 16.9 kPa Convex 2 0 0 3 3 0 4 6 0 5 11 0 Linear 2 25 0 3 9 0 4 25 0 60 rpm 3 kPa Convex 2 >20 >20 3 >20 >20 4 8 0 5 0 0 Linear 2 16 1 3 2 0 4 14 0 16.9 kPa Convex 2 0 0 3 0 0 4 7 0 5 10 0 Linear 2 13 0 3 4 0 4 8 0 Phantom laid on its side 3 kPa Convex 2 >20 >20 3 >20 >20 4 12 0 5 0 0 Linear 23 173 10 4 10 0 16.9 kPa Convex 2 1 0 3 1 0 4 4 0 5 4 0 Linear 23 130 00 4 11 0
IV. DISCUSSION
We frequently encounter many patients who have difficulties in sustaining breath-holds during ultrasound examinations. The pediatric population - neonates, infants and young children - have a hard time holding their breath for even a brief amount of time. Ultrasound elastography has many benefits for these patients.12 For example, ultrasound elastography can
be simply used to evaluate liver fibrosis stage in biliary atresia, metabolic liver disease and steatohepatitis, without need for biopsy.12-14Moreover, many
adults also have difficulties in holding their breath during the repeated measurements of elasticities. Elder patients and patients who have cardiac and respiratory problems might also have trouble holding their breath. Therefore, to take advantage of the entire benefits of ultrasound elastography, it is crucial to know the effects of continuous motion, such as respiratory and cardiac motions, on elasticity measurement. In addition, knowledge on the effect of motion on different machines, transducers and acquisition depths is useful to fully understand and interpret examination results.
There have been a few studies which have focused on the effect the breathing method has on the measurement of tissue stiffness. Goertz et al.15
studied the influence of specific breathing maneuvers while measuring liver elasticity using ARFI, and concluded that there were no significant differences of elasticity between deep inspiration, deep expiration and during the Valsalva maneuver. Karlas et al.16 measured spleen stiffness in two
different respiratory positions, including breath-hold after expiration and deep inspiration. They found that deep inspiration increased spleen stiffness in both healthy and cirrhotic subjects, and mentioned that standardization of the respiratory position was necessary.16 However, these two studies focused on
the effects of specific breathing maneuvers after breath-holds. To our knowledge, there has been no study about the effect of continuous motion on the measurement of elasticity, such as continuous respiratory motion or cardiac pulsation. In addition, the Society of Radiologists in Ultrasound stated that a shallow breath-hold was needed to obtain the best ultrasound elastography examination results, which means that patients have to hold their breath for a few seconds.11
In this study, we attempted to simulate respiratory motion by using different velocities and directions of motion toward the transducers. The effect of motion on elasticity measurement was different according to the machine. In SSI, first, when motion was applied on the lower stiffness phantom (3 kPa in our study, which represented normal liver stiffness) at a lower velocity (30 rpm), the convex transducer of SSI was less affected by motion, regardless of the acquisition depth and the direction of the motion. Second, for the lower velocity motion, elasticity values showed a tendency to increase during movement than during static status on SSI, regardless of the direction of the motion. Third, most of the elasticity values changed in moving status when the velocity or stiffness was increased to 60 rpm or to
16.9 kPa (the phantom which represented fibrosis of the liver). Fourth, the differences between moving and static status were small in 2-3 cm depths, except for the convex transducer of SSI on 3 kPa phantom which showed no significant differences between all depths.
When using ARFI, we first found that the linear transducer at 2 cm depth of the 3 kPa phantom was less affected by motion, regardless of the velocity and the direction of the motion. Second, during the lower velocity motion (30 rpm), the convex transducer at 4cm depth on the 3 kPa phantom was less affected by motion, regardless of the direction of the motion. Third, the differences between moving and static status on 16.9 kPa phantom were small in 2 cm depth using convex, and 4 cm depth using linear transducers, except for the linear transducer on 3 kPa phantom which showed no significant differences between all depths.
Therefore, we could assume that, in SSI, the convex transducer is more stable for slowly moving subjects with lower stiffness. Even though 30 rpm was the lowest velocity that was applied in this study, most respiratory motion is within 30 breaths/min for the general population, with neonates being the exception. Therefore, we could conclude that most respiratory motion will not influence elasticity values when using the convex transducer of SSI on the lower stiffness phantom. Because we only used 3 and 16.9 kPa preset phantoms, further studies are needed to know which cutoff stiffness is the most appropriate for the convex transducer to produce stable results. In
addition, when the values in moving status were within normal range according to liver fibrosis grade, the values in static status were also within normal range using SSI. However, the values in moving status were significantly different in the higher velocity motion or in the fibrotic liver when using SSI, even though the values were obtained without measurement failures. Gennisson et al.17 also mentioned that SSI was slightly sensitive to
motion because of its ultrafast imaging speed, despite the acquisition of the values being done in less than 30 milliseconds.
For ARFI, there were specific depths that were more stable during motion. When using the convex transducer, the 4 cm depth was less affected by motion. With the linear transducer, the 2 cm depth was less affected by motion when the phantom stiffness was 3 kPa. In a stiffer background, the convex transducer minimized differences between moving and static status in the 2 cm depth, and the linear transducer was better at minimizing the differences in the 4 cm depth. However, it was not easy to obtain nominal values itself in ARFI in moving status, which was different from SSI.
In the most recent study using only convex transducer of SSI showed that the liver elasticities were similar between free breathing and apnea status in homogeneous liver parenchyma of patients, and the values were not different between static and moving status using phantom18. These results
were constant as in our study, using convex transducer of SSI in the lower stiffness phantom at the lower velocity motion. They found out the apnea
influenced by Valsalva maneuver could lead to increased elasticity values than in moving status. Combined with our results, we could also concern that the results with apnea affected by Valsalva maneuver would be more inaccurate, which is the more frequent situation in pediatric patients while forced breath-holding. In addition, our study demonstrated more various effects of motion on linear transducer, ARFI, and about different types of motions which were not considered in the study.
There are several limitations in this study. First, this study was an experimental phantom study. We used 3 and 16.9 kPa phantoms to represent the normal and fibrotic range of liver stiffness. However, the heterogeneity of liver parenchyma can also affect measurements of elasticity in moving status, and these two specific values (3 and 16.9 kPa) could not represent the entire normal and fibrotic range of liver stiffness. But we wanted to know how continuous motion affected the measurement of stiffness using a uniform elasticity phantom and decide to replicate regular motion using the shaker for our initiative study. Second, there were limitations in using the shaker to simulate regular motion, such as respiration. It was not easy to find, or to make a machine that had movements identical to respiratory motion. However, this study was meaningful because it was an initial attempt to evaluate the effect of continuous regular motion itself on the measurement of SWVs by applying different velocities and directions of motion. Further studies are
needed to apply the results in actual clinical practice, and to standardize the conditions of examinations.
V. CONCLUSION
In conclusion, motion affected the measurement of elasticity differently according to machine, phantom stiffness, acquisition depth, transducer, and velocity and direction of the motion. Even though measuring elasticity in static status is precise, we cannot avoid situations in which values need to be measured in moving status. Through this initiative experimental study, the convex transducer of SSI was found to be more stable for slowly moving subjects, as would be seen in respiration, with the normal range of stiffness. However, the values in moving status were significantly different in the higher velocity motion or in a fibrotic background using SSI, even though the values were easily obtained without any measurement failures. For ARFI, more stable measurements were found in several specific depths during motion for both transducers. However, there were frequent measurement failures using ARFI during motion. This study supported that the different setting was needed according to the purpose of examination and condition of the patients for measurement of elasticity. More efforts are necessary to standardize conditions so that the effect of motion can be minimized during measurements of elasticities. Attempts to do so, as with our study, will lead to wide application of ultrasound elastography in patients who have difficulties
in holding their breath during ultrasound examinations, including pediatric patients.
REFERENCES
1. Ferraioli G, Parekh P, Levitov AB, Filice C. Shear wave elastography
for evaluation of liver fibrosis. J Ultrasound Med 2014;33:197-203.
2. Sohn B, Kim MJ. Shear wave velocity measurements using acoustic
radiation force impulse in young children with normal kidneys versus hydronephrotic kidneys. 2014;33:116-21.
3. Ferraioli G, Tinelli C, Lissandrin R, Zicchetti M, Bernuzzi S,
Salvaneschi L, et al. Ultrasound point shear wave elastography assessment of liver and spleen stiffness: effect of training on repeatability of measurements. Eur Radiol 2014;24:1283-9.
4. Lee MJ, Kim MJ, Han KH, Yoon CS. Age-related changes in liver, kidney, and spleen stiffness in healthy children measured with acoustic radiation force impulse imaging. Eur J Radiol 2013;82:e290-4.
5. Ozmen E, Adaletli I, Kayadibi Y, Emre S, Kilic F, Dervisoglu S, et al.
The impact of share wave elastography in differentiation of hepatic hemangioma from malignant liver tumors in pediatric population. Eur J Radiol 2014;83:1691-7.
6. Liu BX, Xie XY, Liang JY, Zheng YL, Huang GL, Zhou LY, et al. Shear wave elastography versus real-time elastography on evaluation thyroid nodules: a preliminary study. Eur J Radiol 2014;83:1135-43. 7. Lin P, Chen M, Liu B, Wang S, Li X. Diagnostic performance of
shear wave elastography in the identification of malignant thyroid
nodules: a meta-analysis. Eur Radiol 2014;
doi:10.1007/s00330-014-3320-9.
8. Wang CZ, Zheng J, Huang ZP, Xiao Y, Song D, Zeng J, et al.
Influence of measurement depth on the stiffness assessment of healthy liver with real-time shear wave elastography. Ultrasound Med Biol
2014;40:461-9.
9. Sporea I, Bota S, Gradinaru-Tascau O, Sirli R, Popescu A.
Comparative study between two point Shear Wave Elastographic techniques: Acoustic Radiation Force Impulse (ARFI) elastography and ElastPQ. Med Ultrason 2014;16:309-14.
10. Shin HJ, Kim MJ, Kim HY, Roh YH, Lee MJ. Comparison of shear
wave velocities on ultrasound elastography between different machines, transducers, and acquisition depths: a phantom study. Eur Radiol 2016; doi:10.1007/s00330-016-4212-y.
11. Barr RG, Ferraioli G, Palmeri ML, Goodman ZD, Garcia-Tsao G,
Rubin J, et al. Elastography Assessment of Liver Fibrosis: Society of Radiologists in Ultrasound Consensus Conference Statement. Radiology 2015;276:845-61.
12. Stefanescu AC, Pop TL, Stefanescu H, Miu N. Transient elastography
of the liver in children with Wilson's disease: Preliminary results. J Clin Ultrasound 2016;44:65-71.
13. Dhyani M, Gee MS, Misdraji J, Israel EJ, Shah U, Samir AE.
Feasibility study for assessing liver fibrosis in paediatric and adolescent patients using real-time shear wave elastography. J Med Imaging Radiat Oncol 2015;59:687-94; quiz 751.
14. Pawlus A, Sokolowska-Dabek D, Szymanska K, Inglot MS,
Zaleska-Dorobisz U. Ultrasound Elastography--Review of Techniques and Its Clinical Applications in Pediatrics--Part 1. Adv Clin Exp Med 2015;24:537-43.
15. Goertz RS, Egger C, Neurath MF, Strobel D. Impact of food intake, ultrasound transducer, breathing maneuvers and body position on acoustic radiation force impulse (ARFI) elastometry of the liver. Ultraschall Med 2012;33:380-5.
16. Karlas T, Lindner F, Troltzsch M, Keim V. Assessment of spleen
stiffness using acoustic radiation force impulse imaging (ARFI): definition of examination standards and impact of breathing maneuvers. Ultraschall Med 2014;35:38-43.
17. Gennisson JL, Deffieux T, Fink M, Tanter M. Ultrasound
elastography: principles and techniques. Diagn Interv Imaging 2013;94:487-95.
18. Pellot-Barakat C, Chami L, Correas JM, Lefort M, Lucidarme O. Does motion affect liver stiffness estimates in shear wave elastography? Phantom and clinical study. Eur J Radiol 2016;85:1645-50.
ABSTRACT (IN KOREAN)
탄성 초음파에서 간의 탄성도 측정 시 움직임이 주는 영향에
대한 동적인 간 섬유화 모형을 이용한 분석
<지도교수 김명준>
연세대학교 대학원 의학과
신현주
목적 탄성 초음파를 사용하여 간의 탄성도를 측정함에 있어서 가장 권유되는 방법은 숨을 참은 상태에서 탄성도를 측정하는 것이다. 하지만 소아 환자에 있어서 이러한 방법은 실제로 적용이 불가능한 경우가 많으며, 나이가 많거나 질병이 있는 성인의 경우에도 호흡을 참는 방법이 어려운 경우가 많아 탄성 초음파의 적용에 제한이 되고 있다. 그러므로 본 연구에서는 동적인 간 섬유화 모형을 이용하여 탄성 초음파를 이용한 간의 탄성도 측정 시 움직임이 주는 영향을 알아보고자 하였다. 재료 및 방법탄성 초음파는 supersonic shear wave imaging (SSI)과 acoustic radiation
force impulse imaging (ARFI)를 사용하였고, 각각에서 곡면 및 선형 탐촉자를 사용하였다. 간 섬유화 모형은 3.0과 16.9 kPa의 탄성도를 가진 모형을 사용하였고 규칙적인 원형 및 수평면의 움직임을 구현하기 위하여 Orbital Shaker를 사용하였다. 탄성도는 각 모형의 2, 3, 4, 5cm 깊이에서 움직이는 상태 및 정적인 상태 각각 20회씩 측정하였다. 먼저 소아의 정상적인 호흡 수를 구현하기 위하여 shaker 위에 모형을 세운 채로 각각 30, 60 rpm의 속도로 움직임을 주어 탄성도를 측정하였고, 다른 방향의 움직임을 구현하기 위하여 shaker 위에 모형을 눕힌 채로 30 rpm의 속도로 움직임을 주어 탄성도를 측정하였다. 움직이는 상태와 정적인 상태에서 측정한
탄성도 수치 간의 비교를 위하여 Wilcoxon signed-rank test를 사용하였고, 각 깊이 간에 움직임과 정적인 상태의 탄성도 차이를
비교하기 위하여 Mann-Whitney U test와 Kruskal-Wallis test를
사용하였다. 또한 각 기계에서 탄성도 측정 시 측정 실패 횟수를 확인하였다. 결과 SSI에서 곡면 탐촉자는 3 kPa 모형이 30 rpm 속도로 움직일 때 움직임에 가장 적게 영향을 받았다. 하지만 60 rpm으로 속도를 증가시키거나 16.9 kPa 모형을 사용하였을 때 측정된 탄성도는 움직임과 정적인 상태의 값이 유의하게 차이가 있는 것으로 나타났다. ARFI는 3 kPa 모형을 사용하였을 때, 곡면 탐촉자의 경우 4 cm, 선형 탐촉자의 경우 2 cm 깊이가 움직임에 가장 영향을 적게 받는 것으로 확인되었다. 하지만 ARFI의 경우, 특히 움직이는 상태에서 탄성도 측정 시 측정 실패가 흔하게 나타났다. 결론 초음파 기계, 간의 굳기 정도, 측정 깊이, 탐촉자 종류 및 움직임의 속도나 방향에 따라 움직이는 상태에서 탄성도 측정이 정적인 상태와 달라지는 결과를 보였다. SSI의 곡면 탐촉자는 정상적인 호흡 수 범위의 움직임과 정상 간의 굳기 정도인 탄성도 모형에서는 움직임에 대하여 안정적인 것으로 나타났다. 하지만 SSI의 경우 간 모형의 굳기가 증가하거나, 움직임의 속도를 증가시키는 경우 움직이는 상태의 탄성도가 정적인 상태와 유의하게 차이 나는 결과를 보였다. AFRI의 경우 사용되는 탐촉자에 따라 움직임에 안정적인 깊이가 달랐다. 하지만 움직이는 상태에서 특히 측정 실패가 많은 결과를 보였다. 이러한 결과는 검사하고자 하는 부위나 환자의 상태에 따라 다른 측정 환경을 적용하는 노력이 필요함을 증명하였다.
---핵심되는 말: 초음파, 탄성도, 움직임