DOI 10.3349/ymj.2007.48.5.795
Purpose: To investigate the influence of 2 phases of short interval intracortical inhibition (SICI) on the cortical silent period (SP). Materials and Methods: Single- and paired-pulse transcranial magnetic stimulations (TMSs) at 1 and 2.5 ms interstimulus intervals (ISIs) were applied to the left motor cortex in 12 healthy subjects while their right hand muscles were moderately activated. Conditioning stimulation intensity was 90% of the active motor threshold (AMT). Test stimula-tion intensities were 120, 140, 160, 180, 200, 220, 240, 260% of the AMT and at 100% of the maximal stimulator output, the order of which was arranged randomly. The rectified electromyography area of motor evoked potential (MEP) and duration of the SP were measured off-line using a computerized program. Results: At high-test stimulation intensities, MEP areas were saturated in both single- and paired-pulse stimulations, except that saturated MEPs were smaller for the paired-pulse TMS at 1 ms ISI than for the other conditions. As the test stimulation intensity increased, SP was progressively prolonged in both single- and paired-pulse stimulations but was shorter in paired-pulse than single-pulse TMS. Overall, the ratio of SP duration/MEP area was comparable between single- and paired-pulse TMS except for the paired-pulse TMS at 1 ms ISI with a test stimulation intensity at 140 - 180% of the AMT, in which the ratio was significantly higher than in the single pulse TMS. Conclusion: These results suggest that 2 phases of SICI modulate MEP saturation and SP duration differently and provide additional evidence supporting the view that 2 phases of SICI are mediated by different inhibitory mechanisms.
Key Words: Transcranial magnetic stimulation, motor cortex, neurophysiology, motor evoked potential
INTRODUCTION
Various inhibitory and excitatory connections in the human motor system can be evaluated by transcranial magnetic stimulation (TMS) using a paired-pulse technique.1 A subthreshold condi-tioning stimulus (CS) preferentially excites inter-neurons,2 by which motor evoked potentials (MEPs) from a following test stimulus (TS) are suppressed (short interval intracortical inhibition; SICI) or facilitated depending on the interstimulus interval (ISI).3 A suprathreshold stimulation produces a pause in ongoing voluntary electromyo-graphy (EMG) activity following MEPs, known as the silent period (SP).4 Since the CS of SICI does not produce MEPs, SICI occurs primarily at the cortical level. In contrast, since the stimulation resulting in the SP is suprathreshold and produces MEPs in the target muscle, the SP process in-volves both cortical and subcortical (or spinal) mechanisms.
Two phases of SICI have recently been observed with maximum inhibition at the ISIs of 1 ms (SICI1) and 2.5 ms (SICI2.5).5,6 The mechanism of SICI1 has not yet been determined, and either neuronal refractoriness or another type of synaptic inhibition has been proposed. SICI2.5 is thought to be related to synaptic inhibition mediated by a GABAergic mechanism.5,6 A subthreshold CS at 1- 3 ms (SICI) usually shortens the SP following test stimulation, with a concurrent reduction in the MEP amplitudes.7,8 SP duration is well correlated to MEP size as well as to stimulation intensity.9,10 Therefore, a concurrent reduction in MEP size causes uncertainty whether a shortening in the SP duration results solely from the effect
Different Modulation of the Cortical Silent Period by Two
Phases of Short Interval Intracortical Inhibition
Suk Yun Kang,1 Hae-Won Shin,1 and Young Ho Sohn1,2
1Department of Neurology, 2Brain Korea 21 Project for Medical Science, Yonsei University College of Medicine, Seoul, Korea.
Received December 28, 2006 Accepted April 2, 2007
This work was supported by the Brain Korea 21 Project for Medical Science, Yonsei University.
Reprint address: requests to Dr. Young Ho Sohn, Department of Neurology, Yonsei University College of Medicine, 250 Seong-sanno, Seodaemun-gu, Seoul, 120-752, Korea. Tel: 82-2-2228-1608, Fax: 82-2-393-0705, E-mail: yhsohn62@yuhs.ac
of SICI, or simply reflects the reduced activation of the corticospinal neurons (i.e., reduced MEP size). To better understand the relationship between SICI and SP, it is necessary to evaluate the effect of 2 phases of SICI separately, and also to investigate SP duration changes when the influence of concurrent MEP changes is excluded.
MATERIALS AND METHODS
Subjects
The study subjects were 12 healthy, right-handed volunteers (age range 26 - 42 yrs, mean 31 yrs; 10 men and 2 women). All subjects gave their informed written consent. The experiment was approved by the institutional review board of our medical center.
EMG recording
EMG activity of the first dorsal interosseus (FDI) muscles of the right hand was recorded using silver-silver chloride surface EMG electrodes placed in a belly-tendon montage. EMG activity was amplified using a conventional EMG machine (Viking IV, Nicolet Biomedicals, Medison, USA) with a bandpass between 10 and 2,000 Hz. The signal was digitized at a frequency of 5 kHz and fed into a laboratory computer for further off-line analysis.
TMS
TMS was delivered through a figure-of-eight shaped coil (each loop measured 70 mm in diam-eter) connected to 2 Magstim 200 magnetic stim-ulators via a BiStim module (Magstim, Whitland, Dyfed, UK) and placed flat on the scalp over the left motor cortex. The intersection of the coil was placed tangentially to the scalp with the handle pointing backward and laterally at a 45 angle away from the midline. With a slightly supra-threshold stimulus intensity, the stimulating coil was moved over the left hemisphere to deter-mine the optimal position for eliciting maximal amplitude MEPs in the FDI. The optimal position of the coil was marked on the scalp with a pen
to ensure coil placement throughout the experi-ment. The resting motor threshold (RMT) was determined to the nearest 1% of the maximum stimulator output and was defined as the minimal stimulus intensity required to produce MEPs of > 50 V in at least 5 out of 10 consecutive trials.μ The active motor threshold (AMT) was determined in the moderately active FDI (between approxi-mately 10% and 20% of the maximal voluntary contraction, as monitored by computerized feedback of the EMG signal) and was defined as the minimum intensity that produced either MEPs of > 100 V or an SP in at least 5 out of 10μ consecutive trials. TMS triggering and data acquisition were controlled using a LabVIEW program (National Instrument, Austin, TX, USA).11 A paired-pulse TMS was performed according to a previously described paired-pulse TMS pro-tocol 3 using a subthreshold CS of 90% of the AMT, followed by a suprathreshold TS while sub-jects continuously activated their FDI. Using the LabVIEW program, TMS was set to elicit stimuli only when the EMG activity of the FDI was maintained within 10% to 20% of the maximal voluntary contraction for at least 1 s.11 Single-test pulse and paired stimuli with ISIs of 1 and 2.5 ms were randomly delivered between 5 and 7 s apart. Six trials were recorded for the single-test and paired pulses. This experiment was repeated with the different TS intensities at 120, 140, 160, 180, 200, 220, 240, 260% of the AMT and at 100% of the maximal stimulator output, the order of which was arranged randomly. Rectified MEP areas were measured off-line using a computerized pro-gram11and expressed as the percent of MEP areas at single-pulse TMS with TS at maximal stimu-lator output.
SP measurement
SP duration was measured in moderately active FDI and was defined as the interval between the magnetic stimulus and the first reoccurrence of rectified voluntary EMG activity. Using the statistical process control chart method,12,13 the reoccurrence of voluntary EMG activity was defined as the returning of EMG amplitudes higher than the value of [mean - 1.77 × mean consecutive difference], from the EMG data measured during
100 ms prior to TMS in 5 or more of 10 consecu-tive measurements, as calculated automatically by a computerized program. This value represents 2 sigma limits below the mean value, corre-sponding to the 95% limit of variability. The best method to measure SP is controversial. Applying the same measurement rule for all data reduces the bias of subjective measurements, which is a well-known limitation for estimating SP.13,14 Statistical analysis
Data are expressed as the means ± standard error of means. A repeated measures analysis of variance (ANOVA) was employed to compare stimulation-intensity-dependent changes in MEP area and SP duration among single- and
paired-pulse TMS at different ISIs. When necessary, post hoc ANOVA with Bonferroni correction was used to compare individual effects among single- and paired-pulse TMS at each TS intensity. Simple regression analysis was used to evaluate the relationship between the MEP area and SP duration.
P-values less than 0.05 were considered signifi-cant.
RESULTS
RMT and AMT were 50.8 ± 1.7% and 34.8 ± 1.4% of the maximal stimulator output, respec-tively. In three subjects whose AMTs were 39% or higher, a 100% maximal stimulator output was used instead of 240 and 260% (for 1 subject) and 260% of the AMT (for 2 subjects). MEP areas at
Fig. 1. (A) Motor evoked potential (MEP) area of the right first dorsal interosseus (FDI) evoked by single- (circle) and paired-pulse TMS with 1 ms (diamond) and 2.5 ms (rectangle) interstimulus intervals (ISIs) at different test stimulation (TS) intensities. MEP areas were significantly suppressed in paired-pulse trials with 1 ms ISI at a TS of 140% or higher of the active motor threshold (AMT) and in paired-pulse trials with 2.5 ms ISI at a TS of 160-200% of the AMT as compared with the control trials (*different from the control trials, p < 0.05). (B) Calculated short-interval intracortical inhibition (SICI, % of conditioned MEP area/test MEP area) at different TS intensities. SICI was significant in paired-pulse trials with 1 ms ISI at a TS of 140% or higher of the AMT and in paired-pulse trials with 2.5 ms ISI at a TS of 160 - 220% of the AMT (*p < 0.05).
A
different stimulation intensities are shown in Fig. 1A. MEP areas became larger as TS intensities were increased up to 200% of the AMT in single-pulse trials and 240% of the AMT in paired-single-pulse trials with both ISIs. The repeated measures ANOVA revealed a significant difference in the MEP area for the factor stimulation intensity. For example, significant increases were found in MEPs as the stimulation intensities were increased (df = 8, F = 166.52, p < 0.0001), for the factor stimulation type (df = 2, F = 11.69, p < 0.001) and for the interaction between the 2 factors (df = 16, F = 2.25, p < 0.005). Individual comparisons using post hoc ANOVA with Bonferroni correction showed MEPs in paired-pulse trials with 1 ms ISI
were significantly smaller than those in the single-pulse trials at TS intensities of 140% and higher, while statistical differences in MEPs between paired-pulse trials with 2.5 ms ISI and single-pulse trials were observed at stimulation intensities of 160 - 200%. Calculated SICI was significant in paired-pulse trials with 1 ms ISI at a TS of 140% or higher of the AMT and in pairedpulse trials with 2.5 ms ISI at a TS of 160 -220% of the AMT (Fig. 1B).
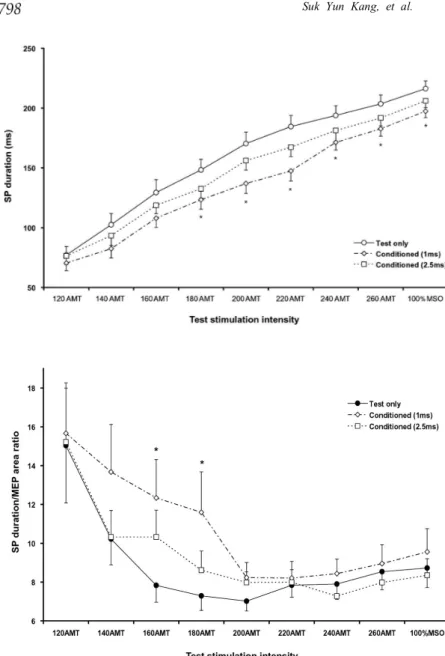
SP duration was significantly prolonged as the stimulation intensity was increased. The repeated measures ANOVA showed SP duration was signi-ficantly different among the factor stimulation intensity (df = 8, F = 268.73, p < 0.0001) and failed to Fig. 2. SP duration evoked by single-(circle) and paired-pulse TMS with 1 ms (diamond) and 2.5 ms (rectangle) inter-stimulus intervals (ISIs) at different test stimulation (TS) intensities. SP durations were significantly shortened in paired-pulse trials at 1 ms ISI at the test intensities of 160% or higher of the active motor threshold (AMT). SP durations in paired-pulse trials with 2.5 ms ISI were not statistically different from the control trials, although they were approximately 10 - 15 ms shorter (*different from control;
p< 0.0167).
Fig. 3. The SP duration/MEP area ratio in single- (circle) and paired- pulse TMS with 1 ms (diamond) and 2.5 ms (rectangle) interstimulus intervals (ISIs) at different test stimulation (TS) intensities. This ratio was significantly higher in paired-pulse trials with 1 ms ISI at 160 and 180% of the AMT (*p < 0.05) and had a tendency to be higher at 140% of the AMT (p < 0.1) than in single-pulse trials.
show significant difference among the factor stimulation type (df = 2, F = 3.22, p = 0.053) as well as their interaction (df = 16, F = 0.88). In individ-ual comparisons with Bonferroni correction, the SP durations in paired-pulse trials with 1 ms ISI were significantly shorter than in control trials at a TS of 180% or higher of the AMT, but paired-pulse trials with 2.5 ms ISI were not different from the single-pulse trials (Fig. 2).
SP durations were significantly correlated to the MEP areas (r2= 0.51, 0.47 and 0.55 in single-pulse and paired-pulse trials with both 1 ms and 2.5 ms ISIs, respectively; p < 0.0001 in all correlations). The repeated measures ANOVA revealed that the SP duration/MEP area ratio was significantly different among the factor stimulation intensity (df = 8, F = 12.56, p < 0.0001), but was similar among the factor stimulation type (df = 2, F = 1.14) and between their interactions (df = 16, F = 0.64). In general, the SP duration/MEP area ratio was comparable among single- and paired-pulse trials, except for paired-pulse trials with 1 ms ISI at a TS of 160 - 180% of the AMT, in which the ratio was significantly higher than for single pulse TMS. This ratio in paired-pulse trials with 1 ms ISI at 140% of the AMT also had a tendency to be higher than in single-pulse trials (p < 0.1) (Fig. 3).
DISCUSSION
MEP areas were saturated at stimulation inten-sities of 200% or higher of the AMT while the SP duration continued to increase to the maximal stimulator output, as shown previously.9 Volun-tary contraction is known to reduce the degree of SICI at both ISIs as compared to a resting condi-tion5,6but has a much greater effect on SICI2.5 than SICI1.5 Similarly, in this study, SICI1 showed a significant reduction in MEP areas as compared with the control trials at most TS intensities, while SICI2.5 exhibited a statistically significant differ-ence only at 160 - 220% of the AMT. Saturated MEP areas were comparable between SICI2.5 and the single-pulse trials but were smaller in SICI1. These findings also suggested different mech-anisms may contribute to SICI1 and SICI2.5.
High intensity stimulation, when it evokes MEP saturation, excites nearly all spinal motor neurons
supplying target muscles.15 However, evoked MEPs remain much smaller than those produced by the peripheral nerve stimulation (i.e., compound muscle action potential), presumably because of phase cancellation of the active potential caused by desynchronization occurring within the corti-cospinal tract or at the spinal cord cells.15 Sub-threshold CS in SICI2.5 stimulates preferentially low-threshold inhibitory interneurons, which exert an inhibitory effect on the excitability of the pyramidal tract neurons (PTN). Since saturated MEPs were not suppressed, synaptic inhibition induced by SICIS appears to no longer affect the degree of phase cancellation of descending cor-ticomotor activation. The mechanisms mediating SICI1 are controversial, however, and axonal refractoriness of excitatory interneurons has been proposed.5 In addition, since higher TS induces more inhibition in SICI1, synaptic inhibition through inhibitory interneurons is thought to contribute to SICI1.6 In contrast to SICI2.5, satu-rated MEPs in SICI1were much smaller than those in single-pulse trials. A reduction in saturated MEP size in SICI1 may result from axonal refrac-toriness, since synaptic inhibition should also disappear at high intensity stimulation as in SICI2.5. Desynchronization of PTN, induced by axonal refractoriness of excitatory interneurons, may contribute to an increase in phase cancella-tion of descending corticospinal accancella-tion potentials, which in turn reduces the saturated MEP size.
In general, SP duration depends on cortical mechanisms because spinal inhibitory mech-anisms are exerted mainly during the early part of the SP (up to 50 ms).4 Multiple mechanisms have been proposed to evoke the cortical SP, including the loss of voluntary drive, activation of inhibitory interneurons, activation of corticospinal recurrent collaterals, and after-hyperpolariza-tion.4,9,16 During the SP, epidural recordings of the corticospinal volleys demonstrated a reduction in D-wave amplitude and a number of late I-waves.17This could indicate that both the reduced excitability of PTN and the activation of inhibitory interneurons may contribute to the development of the cortical SP. Pharmacologically, the cortical SP is influenced by multiple agents, such as Na+ and Ca+channel blockers,18,19GABAergic agents,19,20 and dopamine agonists,21 suggesting the
involve-ment of multiple mechanisms in producing the cortical SP.
Previous research has shown that SP duration is shortened by a subthreshold CS with a reduc-tion in MEP size.7,8 However, the significant cor-relation between the MEP area and SP duration shown in this study renders the previous results unclear whether the shortening of the SP results from the effect of the CS or simply reflects the reduced corticospinal activation (i.e., reduced MEP size). Trompetto et al. observed that if the TS was adjusted to produce similar MEPs, SP duration was lengthened by a subthreshold CS, instead of shortened.8 In this study, the calculated SP duration/MEP area ratio was comparable between single- and paired-pulse trials at a majority of the TS intensities applied. This finding indicates that shortening of the SP induced by a subthreshold CS results mainly from reduced activation of corticospinal neurons. In the primate motor cortex, the activation of the corticospinal collaterals results in inhibitory postsynaptic potential (IPSP) in PTN with a duration of approximately 50 - 150 ms.22 In particular, recurrent collaterals of fast corticospinal axons have a predominantly inhibitory effect on the firing of neurons that have slower conducting axons.23 Neurons with large axons appear to be activated by TMS pulses, and if tonic voluntary contraction is supported by the activity of slow conducting axoned neurons, this could explain the shortening of the SP with reduced MEPs. However, at relatively lower TS intensities, the SP duration/ MEP area ratio was higher in SICI1than in single-pulse trials. Therefore, the mechanism mediating SICI1, either axonal refractoriness of excitatory interneurons or synaptic inhibition involving inhibitory circuits different from those mediating SICI2.5, appears to exert a synergistic effect on inhibitory mechanisms producing the SP at a certain range of TS intensities. This finding supports the viewpoint that different mechanisms may contribute to SICI1and SICI2.5. In this study, SICI was tested with approximately the full range of TS intensities between the ATM and maximal stimulator output and used only the fixed CS intensity at 90% of the ATM. Since SICI also varies according to different CS intensities,24 further studies using different CS intensities are required
to better understand details of the relationship between SICI and SP.
REFERENCES
1. Hallett M. Transcranial magnetic stimulation: a useful tool for clinical neurophysiology. Ann Neurol 1996;40: 344-5.
2. Nakamura H, Kitagawa H, Kawaguchi Y, Tsuji H. Intracortical facilitation and inhibition after transcranial magnetic stimulation in conscious humans. J Physiol 1997;498:817-23.
3. Kujirai T, Caramia MD, Rothwell JC, Day BL, Thompson PD, Ferbert A, et al. Corticocortical inhibi-tion in human motor cortex. J Physiol 1993;471:501-19. 4. Fuhr P, Agostino R, Hallett M. Spinal motor neuron excitability during the silent period after cortical stimu-lation. Electroencephalogr Clin Neurophysiol 1991;81: 257-62.
5. Fisher RJ, Nakamura Y, Bestmann S, Rothwell JC, Bostock H. Two phases of intracortical inhibition revealed by transcranial magnetic threshold tracking. Exp Brain Res 2002;143:240-8.
6. Roshan L, Paradiso GO, Chen R. Two phases of short-interval intracortical inhibition. Exp Brain Res 2003;151: 330-7.
7. Shimizu T, Oliveri M, Filippi MM, Palmieri MG, Pasqualetti P, Rossini PM. Effect of paired transcranial magnetic stimulation on the cortical silent period. Brain Res 1999;834:74-82.
8. Trompetto C, Buccolieri A, Marinelli L, Abbruzzese G. Differential modulation of motor evoked potential and silent period by activation of intracortical inhibitory circuits. Clin Neurophysiol 2001;112:1822-7.
9. Inghilleri M, Berardelli A, Cruccu G, Manfredi M. Silent period evoked by transcranial stimulation of the human cortex and cervicomedullary junction. J Physiol 1993;466:521-34.
10. Orth M, Rothwell JC. The cortical silent period: intrinsic variability and relation to the waveform of the transcranial magnetic stimulation pulse. Clin Neuro-physiol 2004;115:1076-82.
11. Kaelin-Lang A, Cohen LG. Enhancing the quality of studies using transcranial magnetic and electrical stimulation with a new computer-controlled system. J Neurosci Methods 2000;102:81-9.
12. Pfadt A, Wheeler DJ. Using statistical process control to make data-based clinical decisions. J Appl Behav Anal 1995;28:349-70.
13. Garvey MA, Ziemann U, Becker DA, Barker CA, Bartko JJ. New graphical method to measure silent periods evoked by transcranial magnetic stimulation. Clin Neurophysiol 2001;112:1451-60.
14. Nilsson J, Panizza M, Arieti P. Computer-aided determination of the silent period. J Clin Neurophysiol
1997;14:136-43.
15. Magistris MR, Ro¨sler KM, Truffert A, Myers JP. Transcranial stimulation excites virtually all motor neurons supplying the target muscle. A demonstration and a method improving the study of motor evoked potentials. Brain 1998;121:437-50.
16. Tergau F, Wanschura V, Canelo M, Wischer S, Wassermann EM, Ziemann U, et al. Complete suppres-sion of voluntary motor drive during the silent period after transcranial magnetic stimulation. Exp Brain Res 1999;124:447-54.
17. Chen R, Lozano AM, Ashby P. Mechanism of the silent period following transcranial magnetic stimulation. Evidence from epidural recordings. Exp Brain Res 1999; 128:539-42.
18. Schulze-Bonhage A, Knott H, Ferbert A. Effects of carbamazepine on cortical excitatory and inhibitory phenomena: a study with paired transcranial magnetic stimulation. Electroencephalogr Clin Neurophysiol 1996;99:267-73.
19. Ziemann U, Lo¨nnecker S, Steinhoff BJ, Paulus W.
Effects of antiepileptic drugs on motor cortex excita-bility in humans: a transcranial magnetic stimulation study. Ann Neurol 1996;40:367-78.
20. Ziemann U, Lo¨nnecker S, Steinhoff BJ, Paulus W. The effect of lorazepam on the motor cortical excitability in man. Exp Brain Res 1996;109:127-35.
21. Ziemann U, Bruns D, Paulus W. Enhancement of human motor cortex inhibition by the dopamine receptor agonist pergolide: evidence from transcranial magnetic stimulation. Neurosci Lett 1996;208:187-90. 22. Ghosh S, Porter R. Corticocortical synaptic influences
on morphologically identified pyramidal neurones in the motor cortex of the monkey. J Physiol 1988;400:617-29.
23. Phillips CG, Porter R. Corticospinal neurones. Their role in movement. Monogr Physiol Soc 1977;34:v-xii, 1-450.
24. Ilic´ TV, Meintzschel F, Cleff U, Ruge D, Kessler KR, Ziemann U. Short-interval paired-pulse inhibition and facilitation of human motor cortex: the dimension of stimulus intensity. J Physiol 2002;545:153-67.