저작자표시-비영리-변경금지 2.0 대한민국 이용자는 아래의 조건을 따르는 경우에 한하여 자유롭게 l 이 저작물을 복제, 배포, 전송, 전시, 공연 및 방송할 수 있습니다. 다음과 같은 조건을 따라야 합니다: l 귀하는, 이 저작물의 재이용이나 배포의 경우, 이 저작물에 적용된 이용허락조건 을 명확하게 나타내어야 합니다. l 저작권자로부터 별도의 허가를 받으면 이러한 조건들은 적용되지 않습니다. 저작권법에 따른 이용자의 권리는 위의 내용에 의하여 영향을 받지 않습니다. 이것은 이용허락규약(Legal Code)을 이해하기 쉽게 요약한 것입니다. Disclaimer 저작자표시. 귀하는 원저작자를 표시하여야 합니다. 비영리. 귀하는 이 저작물을 영리 목적으로 이용할 수 없습니다. 변경금지. 귀하는 이 저작물을 개작, 변형 또는 가공할 수 없습니다.
Effect of Prostaglandin E
2
on the Expression of
Adhesion Molecules in Mouse Cerebrovascular
Endothelial Cells
by
Tae Yeop Park
Major in Molecular Medicine
Department of Biomedical Sciences
The Graduate School, Ajou University
Effect of Prostaglandin E
2
on the Expression of
Adhesion Molecules in Mouse Cerebrovascular
Endothelial Cells
by
Tae Yeop Park
A Dissertation Submitted to The Graduate School of Ajou
University in Partial Fulfillment of the Requirements for the
Degree of Ph. D. of Biomedical Sciences
Supervised by
Soo Hwan Lee, Ph.D.
Major in Molecular Medicine
Department of Biomedical Sciences
The Graduate School, Ajou University
This certifies that the dissertation
of Tae Yeop Park is approved.
SUPERVISORY COMMITTEE
______________________________________
Eun Joo Baik
_______________________________
Min Soo Noh
_______________________________
Chang-Hyun Moon
_______________________________
Hyun Goo Woo
_______________________________
Soo Hwan Lee
The Graduate School, Ajou University
August, 2013
- ABSTRACT -
Effect of Prostaglandin E
2on the Expression of Adhesion Molecules
in Mouse Cerebrovascular Endothelial Cells
Prostaglandin E2 (PGE2) is known to be the principal pro-inflammatory prostanoid and play
an important role in brain disease through binding to four G protein-coupled receptor (EP1-4). However, there have been contradictory reports on its actions in inflammation processes.
For instance, PGE2 inhibits or stimulates ICAM-1 expression depending on the cell type and
experimental conditions. Furthermore, the effect of PGE2 on ICAM-1 expression in
cerebrovascular endothelial cells is mostly unknown. In this study, it was investigated the
roles of PGE2 in the expression of ICAM-1 in primary cultured mouse brain endothelial cells
and bEnd.3 cells and therein involved signaling pathways. PGE2 induced ICAM-1
expression at the levels of protein and mRNA levels in the time and dose dependent manner and the effects was mediated by EP1/4. In order to delineate the intracellular signaling pathway, cAMP dependent signaling events were investigated. Though dbcAMP and forskolin mimicked the effect of PGE2, PKA inhibitors did not show significant effect on
PGE2-induced ICAM-1 expression. However, involvement of Epac was confirmed by
experiments using specific stimulators and inhibitors, and siRNA technology. PGE2 and
dbcAMP stimulated phosphorylation of Akt and GSK-3β, suggesting the role of PI3K/Akt in
PGE2-induced ICAM-1 expression. This inference was supported by the separate experiment
constructs. PGE2 induced the activation of NF-κB, critical regulator of ICAM-1 expression
and NF-κB inhibitors blocked PGE2 and dbcAMP-induced ICAM-1 expression. Interestingly,
loss of Akt activity results in inhibition of NF-κB activation. Taken together, these data
suggest that PGE2 induces ICAM-1 expression through activation of EP4/cAMP/Epac and
PI3K/NF-κB axis.
Key words : Prostaglandin E2 (PGE2), intercellular adhesion molecule 1 (ICAM-1),
Exchange protein activated by cAMP (Epac), cAMP, NF-κB, bEnd.3 mouse cerebrovascular endothelial cells.
TABLE OF CONTENTS
ABSTRACT ... i
TABLE OF CONTENTS ... iii
LIST OF FIGURE ... v
ABBREVIATIONS ... vii
I. INTORDUCTION ... 1
1. The role of blood-brain barrier ... 1
2. The importance of cell adhesion molecules in brain inflammation ... 2
3. COX/Prostaglandin E
2and adhesion molecules ... 5
4. EP receptors signaling in inflammatory brain diseases ... 7
5. Exchange protein activated by cAMP (Epac) signaling pathway ... 11
II. AIMS OF STUDY... 13
III. MATERIALS AND METHODS ... 14
1. Materials ... 14
2. Cell culture ... 14
3. Western blot analysis ... 15
4. Estimation of Rap1 activity by a pull-down assay ... 16
5. Reverse transcription and polymerase chain reaction ... 16
6. Real-time quantitative PCR for EP receptors ... 17
7. Immunocytochemistry ... 18
9. Plasmids and transfection ... 19
10. Luciferase assay ... 20
11. Ca
2+measurement ... 21
12. cAMP measurement ... 21
13. Statistical analysis ... 22
IV. RESULTS... 23
1. COX1/2 inhibition significantly reduces LPS-induced ICAM-1 expression
and leukocyte adhesion ... 23
2. PGE
2induces a time- and dose- dependent increase in ICAM-1 expression
and leukocyte-endothelial adhesion ... 27
3. EP4 receptor is associated with PGE
2-induced ICAM-1 expression ... 30
4. PGE
2-induced ICAM-1 expression mediated by cAMP-dependent but not
Ca
2+dependent signaling pathways ... 34
5. PGE
2-induced ICAM-1 expression is mediated by Epac signaling pathway 40
6. PI3K/Akt signaling pathway is involved in PGE
2-induced ICAM-1
expression ... 46
7. PGE
2-induced ICAM-1 expression is regulated by NF-κB activation through
Akt signaling pathway ... 49
V. DISCUSSION ... 57
VI. REFERENCES ... 65
LIST OF FIGURE
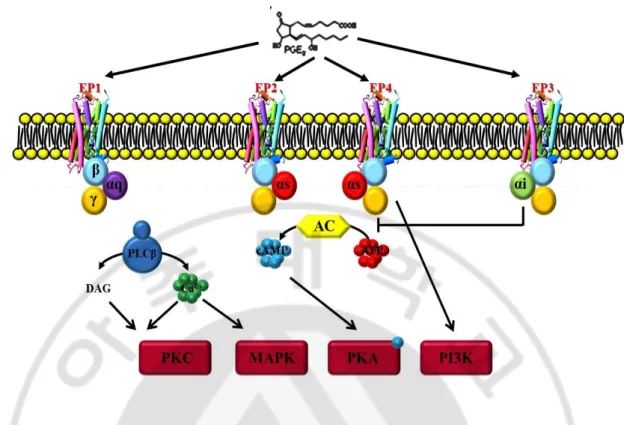
Fig. 1. G-protein coupled EP receptor signaling pathways ... 10
Fig. 2. Effects of COX inhibitors and PGE
2on LPS-induced ICAM-1 expression ... 25
Fig. 3. Effects of COX inhibitors and PGE
2on LPS-induced adhesion of leukocyte to
bEnd.3 cells... 26
Fig. 4. Time and dose-dependent effects of PGE
2on ICAM-1 expression in mouse
cerebrovascular endothelial cells ... 28
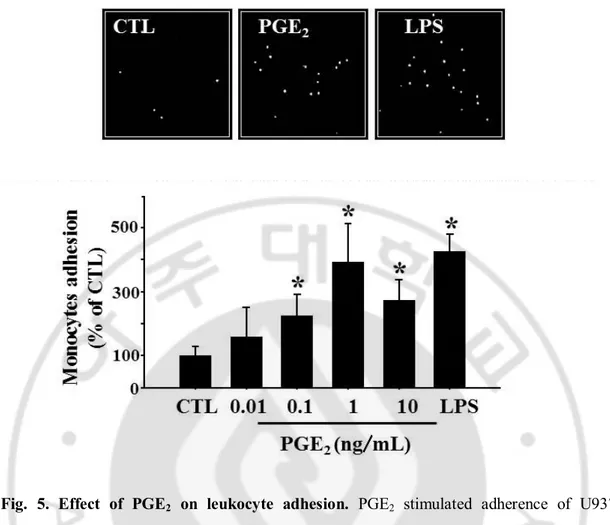
Fig. 5. Effect of PGE
2on leukocyte adhesion... 29
Fig. 6. EP receptor subtype expressions on bEnd.3 cells ... 31
Fig. 7. Effects of specific EP agonists on ICAM-1 expression... 32
Fig. 8. Effects of specific EP antagonists and EP receptor siRNA on PGE
2-induced
ICAM-1 expression ... 33
Fig. 9. Effect of PGE
2on intracellular Ca
2+level change ... 35
Fig. 10. Effects of PKC inhibitors on PGE
2-induced ICAM-1 expression ... 36
Fig. 11. Effects of MAPK inhibitors on PGE
2-induced ICAM-1 expression ... 37
Fig. 12. Effect of PGE
2on intracellular cAMP level ... 38
Fig. 13. Effects of cAMP elevating agents on ICAM-1 expression ... 39
Fig. 14. Effects of PGE
2on PKA and Epac activation ... 41
Fig. 15. Effect of PKA specific activator on ICAM-1 expression ... 42
Fig. 16. Effects of specific PKA inhibitors on PGE
2-induced ICAM-1 expression .. 43
Fig. 18. Effect of Epac inhibition on PGE
2-induced ICAM-1 expression... 45
Fig. 19. Effects of PGE
2on Akt and GSK-3β phosphorylation ... 47
Fig. 20. Roles of PI3K/Akt in PGE
2-induced ICAM-1 expression ... 48
Fig. 21. Effects of PGE
2on NF-κB and AP-1 transcriptional activity ... 51
Fig. 22. Effects of PGE
2and Epac activator on IKK/IκB phosphorylation and p65
translocation ... 52
Fig. 23. Effect of Akt inhibition on PGE
2and Epac-induced NF-κB activation ... 53
Fig. 24. Effect of NF-κB inhibitors on PGE
2-induced ICAM-1 expression ... 54
Fig. 25. Involvements of EP4 receptor and Epac/Akt/NF-κB signaling pathways in
PGE
2-induced leukocyte adhesion ... 55
Fig. 26. Involvements of EP4 receptor and Epac/Akt/NF-κB signaling pathways in
PGE
2-induced ICAM-1 expression in primary brain endothelial cells ... 56
Fig. 27. The putative signaling pathway for PGE
2-induced ICAM-1 expression in
mouse cerebrovascular endothelial cells ... 63
ABBREVIATIONS
BBB : Blood-Brain Barrier
CNS : Central Nervous System
ICAM-1 : Intercelluar Adhesion Molecule-1
COX : Cyclooxygenase
PGE
2: Prostaglandin E
2MAPK : Mitogen Activated Protein Kinase
PKC : Protein Kinase C
PKA : Protein Kinase A
Epac : Exchange Protein Activated by cAMP
PI3K: Phosphatidylinositol 3-Kinase
GSK-3β : Glycogen Synthase Kinase-3(beta)
AP-1 : Activating Protein-1
NF-κB : Nuclear Factor-κB
N
6-Bnz-cAMP : N
6-benzoyladenosine-3’,5’-cyclic monophosphate
8-Cpt-cAMP : 8-(4-chlorophenylthio)-2’-O-methyl adenosine 3’,5’-cyclic
monophosphate
dbcAMP : dibutyryl cAMP
I. INTRODUCTION
A. The role of blood-brain barrier
Blood-brain barrier (BBB), interposed interface between the peripheral circulation and central nervous system (CNS), features a selection of substances to regulate the barrier penetration at the level of the cerebral microvascular endothelium (Dietrich, 2002; Song and Pachter, 2003). BBB is composed of microvascular endothelium, astrocytes, basement membrane, and pericytes and neurons that are in physical proximity to the endothelium (Dietrich, 2002; Wolburg and Lippoldt, 2002). All these elements are part of the functional neurovascular unit, which separates and forms the compartments of the cerebral vascular space and the cerebral interstitium, and this unit is a vital supply for protection to the elementary brain cells and maintain the CNS homeostasis is necessary for steady and systematic neuronal activity (Persidsky et al, 2006). The function of the BBB is primarily supported by tight-junction complexes between adjacent endothelial cells and a lack of frequent interactions between the endothelium and inflammatory cells. Therefore, the central nervous system, under normal conditions, is an immunoprivileged organ, and antigens of the nervous tissue are not fully accessible to the immune systems, since immune cells cannot easily penetrate the cerebral and spinal parenchyma.
Brain inflammation is a pathological hallmark in several neurological disorder including brain infection, trauma, ischemic brain injury, multiple sclerosis (MS), encephalitis and Alzheimer's disease (Andesson et al, 1992; Kyrkanides et al, 2002). When inflammation
occurs, an extensive leukocyte migration into the brain takes place and various BBB-related factors contribute to the development of CNS inflammatory.
1. Cytokines
An initial step in inflammation is the secretion of various mediators. Cytokines such as TNF, IL-1β, and IL-6 plays pivotal role in the development of the inflammatory response. Cells in the CNS that can produce cytokines upon activation include macrophages, microglial cells, astrocytes, and endothelial cell. These cytokines are predominantly present in the CNS after injury or inflammation and play a major role in mediating the pathogenesis of a fever response, in the host defense response, and the release of other cytokines in the CNS.
2. Eicosanoids
The derivatives of arachidonic acid (AA), called eicosanoids, and their metabolism play an important role in the mediation of the inflammatory response and the pathogenesis of fever. During brain injury, eicosanoids play an important role in the pathogenesis of CNS inflammatory diseases. One possible site of PG synthesis is the cerebrovascular endothelial
cells, since these cells have been shown to produce PGE2 and PGI2 when exposed to traces
of AA (De Vries et al., 1995) and the cerebral endothelium itself may contribute to the total pool of PGs produced in the CNS after injury.
3. Free radicals
Upon activation, cells of the immune system can produce a range of free radicals, such as reactive oxygen species (ROS) or nitric oxide (NO), which can contribute to tissue damage. ROS can cause considerable damage to the membrane lipids in the CNS. The
polyunsaturated fatty acids after reacting with ROS can become peroxidated, destroying the structure of myelin and cell membranes. The integrity of the BBB can also be threatened by exposure of the endothelial cells to ROS (Griot et al, 1990; Kim and Kim, 1991). Another free radical that can damage the BBB is NO. Inflammatory mediators released in the CNS during viral or bacterial infections are able to induce iNOS, present in endothelial cells, astrocytes and brain macrophages (Feinstein et al., 1994). Increased permeability of the BBB, after endotoxin administration to rats, could be blocked in the presence of a inhibitor of NOS (Shukla et al., 1995)
4. Adhesion molecules.
Within minutes after the release of inflammatory mediators such as cytokines or eicosanoids, neutrophils arrive at the site of inflammation followed by the migration of lymphocytes and monocytes into the inflamed site (Osborn, 1990). Three families of homologous adhesion molecules are responsible for the adhesion and migration of leukocytes into an inflamed site: the immunoglobulin superfamily, the integrins, and the selectins. On endothelial cells this group is represented by intercellular adhesion molecule-1 (ICAM-1), intercellular adhesion molecule-2 (ICAM-2), and vascular cell adhesion molecule-1 (VCAM-1). These molecules recognize their leukocytic ligands and permit adhesion and migration of these cells out of the bloodstream.
Several pathological conditions of the brain are associated with structural and functional abnormalities of the cerebral microvasculature. Until now, most attention has been paid to the inflammatory activities of the glial cells. However, the role of the endothelial cells of the BBB in these processes can not be ignored.
B. The importance of cell adhesion molecules in brain inflammation
Leukocyte adhesion to cerebrovascular endothelial cells and subsequent infiltration into brain parenchyma is crucial in developing brain tissue injury during various neuropathological processes including brain infection, trauma and cerebral ischemia. Activated endothelial cells present a proadhesive surface to leukocytes, promoting leukocyte recruitment during an inflammatory response (Carlos and Harlan, 1994; Langer and Chavakis, 2009). Leukocyte adhesion to activated endothelial cells is a sequential, multistep process consisting of tethering, rolling, firm adhesion and transmigration (Springer, 1994). Each step requires interaction between leukocytes and distinct adhesion molecules expressed on the endothelial cell surface.
Many cerebrovascular and neurological diseases such as multiple sclerosis (MS), Alzheimer’s, and parkinson’s diseases have an inflammatory component in their pathology, and the neuroinflammatory responses accompanying these diseases are characterized and dependent on the extravasation of leukocytes from the blood into the neural parenchyma (Greenwood et al, 1995; Hickey, 1999; 2001). Thus, attempts to control leukocyte transmigration into the CNS undoubtedly present a major strategy in controlling progression of neuroinflammatory diseases (Turowski et al, 2005). The cell adhesion molecules, such as intracellular adhesion molecule-1 (ICAM-1), vascular adhesion molecule-1 (VCAM-1), and endothelial-leukocyte adhesion molecule-1 (E-selectin), are induced by pro-inflammatory stimuli, such as cytokines, hormones, stresses, and infection, to mediate the transmigration of leukocytes through the endothelium.
superfamily of cellular adhesion molecules, is involved in the firm adhesion of leukocyte to endothelial surface by interacting to leukocyte β-2 integrins CD11α/CD18 (LFA-1) or CD11β/CD18 (MAC-1) (Springer, 1990). The induction of ICAM-1 is regulated by a myriad of factors secreted at the site of injury, including cytokines, chemokines, prostaglandins and free radicals (Carlos and Harlan, 1994; Winkler et al., 1997; Bernot et al., 2005). ICAM-1 expression is regulated through four primary pathways: NF-κB, JAK/STAT and IFN-γ, AP-1 and MAPK, and PKC. Ultimately, ICAM-1 is regulated at the level of transcription by one of these signaling cascades (Roebuck et al, 1999).
Increased leukocyte adhesion and infiltration under various pathological conditions is accompanied by increased expression of endothelial ICAM-1 (Springer, 1994; Rossi et al, 2011) and the blockade of ICAM-1 ligation limits leukocyte infiltration and ameliorates brain damage (Bowes et al, 1993; Vemuganti et al, 2004; Arumugam et al, 2009). Therefore, ICAM-1 expression by the cerebrovascular endothelium is potentially a critical point in the disassembling of the barrier (Simka, 2009). Because the control of leukocytes infiltration into brain have been known one of the critical factor for the treatment of various cerebral diseases, understanding the role of ICAM-1 in brain inflammation has been emphasized.
C. COX/ prostaglandin E2 and adhesion molecules
Prostaglandin E2 (PGE2), a cyclooxygenase (COX) product of arachidonic acid released from membrane phospholipids, plays important roles in regulating brain injury and inflammation (Legler et al, 2010; Andreasson, 2010). Levels of PGE2 in central nervous system (CNS) are upregulated in various neurological disorders including ischemic stroke,
Alzheimer’s disease and Parkinson’s disease (Aktan et al, 1991; Minghetti, 2004; Cimino et
al, 2008). The relevance of PGE2 in the process of inflammatory brain injury is underscored
by the effectiveness of NSAIDs as COX-inhibitors (Hurley et al, 2002; Minghetti, 2004; Simmons et al, 2004; Aid and Bosetti, 2011). As a classical inflammatory mediator, PGE2 has been implicated in the tissue influx of leukocytes and the expression of adhesion
molecules (Kalinski, 2012). However the role of PGE2 in the regulation of ICAM-1
expression is likely to be context specific. While PGE2 increases ICAM-1 expression in human umbilical vein endothelial cells (Winker et al, 1997) and oral cancer cells (Yang et al, 2010), it suppresses cytokine- or endotoxin-induced ICAM-1 expression in human vascular smooth muscle cells (Bishop-Bailey et al, 1998) and fibroblasts (Noguchi et al, 2001). These observations indicate that PGE2 exerts differential effects on the expression of adhesion molecules in the course of inflammation, depending on the cell types and pathologic
conditions. PGE2 acts locally through binding of one or more of its four different receptors
designated EP1-EP4. The EP subtypes exhibit differences in sensitivity, signal transduction, tissue localization and regulation of expression. This molecular and biochemical
heterogeneity of PGE2 receptors permits distinctive effects of PGE2 in different cell types at
different stages of inflammation. Thus, it is highly plausible that in addition to the alteration
in PGE2 production, the regulation of PGE2 responsiveness at the level of individual PGE2
receptors can also contribute to the pathogenesis of inflammatory disease (Kalinski, 2012).
Despite its implication in inflammatory brain injury, the role of PGE2 in the regulation of
ICAM-1 expression in CNS remains ill defined. COX inhibitors, NS-398, indomethacin and dexamethasone are reported to attenuate ICAM-1 expression induced by IL-1, ischemia and
ionizing radiation in cerebrovascular endothelial cells and brain tissues (Stanimirovic et al, 1997; Kyrkanides et al, 2002). In the previous study, it was observed COX inhibitors diminished cadmium-induced ICAM-1 expression in brain endothelial cells, which was
reversed by addition of PGE2 (Seok et al, 2006). However, the details of effect of PGE2 on
ICAM-1 expression in brain endothelial cells are largely unknown.
D. EP receptor signaling in inflammatory brain diseases
PGE2’s diverse and specific cellular effects are believed to be dependent on cell surface expression of multiple functionally distinct subtypes of PGE2 receptors. Based upon their
ligand binding selectivity and signaling pathway activation, the subtypes of PGE2 receptors
are classified into EP1, EP2, EP3 and EP4. PGE2 receptors EP1–4 are encoded by separate
genes, and are considerably heterogeneous in their sequences. EP2 and EP4 expression has been found in large vessel ECs in culture (Dormond et al, 2002), and EP1, EP3 and EP4 can be detected in brain microvascular ECs in vitro and in vivo(Battacharya et al, 1999). EP1 receptor binding triggers an increase in intracellular calcium and PKC activity, probably arising from its coupling to Gq and the subsequent activation of PLC (Fig 1). EP2 and EP4 are both functionally coupled to Gs, which activates adenylate cyclase to generate cAMP. The generation of cAMP leads to the activation of PKA, which is central to the downstream events triggered by both receptors. Human EP3 mainly couples to Gi proteins, and its activation generally inhibits cAMP synthesis (Burkey and Regan, 1995).
Multiple PGE2 receptor subtypes with different ligand affinities, cellular and tissue
PGE2’s signaling versatility, and often, its opposing biological actions. Studies in mice
deficient in individual EP receptors have revealed that PGE2 acts not only as a
proinflammatory mediator, but also exerts anti-inflammatory responses (Shi et al, 2010; Legler et al, 2010). Several studies have shown that the EP receptors play key roles in several neuropathophysiologic processes (Hewett et al, 2000). Alzheimer’s disease is an age-related neurodegenerative disease with the pathological hallmarks of mayloid plaques, neurofibrillary tangles, and neuroinflammation. Deletion of the EP2 receptor in aged mice results in lower total levels of Aβ peptides, fewer accumulated deposits, and a significant decrease in neuronal oxidative damage (Liang et al, 2005). In parkinson’s disease, EP2-/- microglia also display enhanced ex vivo clearance of aggregated β-synuclein in mesocortex of Lewy body disease patients while attenuating neurotoxicity and β-synuclein aggregation in the MPTP mouse model (Jin et al, 2007). Amyotrophic lateral sclerosis (ALS) is
characterized by the progressive loss of motor neurons. In ALS, physiological levels of PGE2
in an organotypic model of ALS paradoxically protect motor neurons through the receptor EP2 and EP3. Recently, neuroprotection via EP1 inhibition was shown to occur through increasing survival signaling pathway and EP2-/- mice also demonstrate reduced infarct size in a model of focal cerebral ischemia (Liu et al, 2005; McCullough et al, 2004). Stimulating EP3 pharmacologically has also been shown to increase infarct size in the middle cerebral artery occlusion model of ischemia (Ahmad et al, 2007). However, glutamate excitotoxicity studies using hippocampal neurons and organotypic slices showed a protective effect of EP3 neuronal signaling (Bilak et al,2004; Burks et al, 2007) .
contrasting biological effects for PGE2. Depending upon cell-specific signaling cascades and injury context, EP receptors can mediate various neurological diseases. Further studies are required to understand the dynamics of EP receptor expression in ischemic, excitotoxic, and inflammatory models of neurologic disease, where selected EP signaling pathways can elicit neuroprotective or neurotoxic effects, pro- or anti- inflammatory effects.
Fig. 1. G-protein coupled EP receptor signaling pathways. PGE2 mediated its biological functions by binding to four different types of membrane-bound, G-protein-coupled receptors. The EP2 and EP4 receptors increase cAMP by activating adenylate cyclase via
Gαs proteins. EP3 signaling through Gαi has inhibitory effects on cAMP levels, whereas EP1
E. Exchange protein activated by cAMP (Epac) signaling pathway
The molecular mechanisms that control leukocyte transendothelial migration involve extensive signaling mediated by intracellular messengers such as cAMP, calcium, phosphoinositol lipids, small GTPases, reactive oxygen species, and protein tyrosine kinases (Lorenowicz et al, 2007). 3′-5′-cyclic adenosine monophosphate (cAMP) is a central second messenger that widely regulates key cellular processes, including metabolic events, regulation of cell shape, cytoskeletal remodeling, secretory processes, cell growth, survival and differentiation, as well as inflammatory responses (Borland et al, 2009). A vital step towards a fuller understanding of the mechanisms of cAMP signaling came a decade ago with the discovery of the exchange proteins activated by cAMP (Epac). Epac are specific guanine nucleotide exchange factors (GEFs) for the Ras GTPase homologues, Rap1 and Rap2, which they activate independently of the classical route of cAMP signal transduction, through protein kinase A (PKA) (Kawasaki et al, 1998; de Rooij et al, 1998). Mammals have two Epac isoforms; Epac1 and Epac2, which are products of different genes (Bos, 2003). While Epac1 is expressed in virtually all tissues, in particular kidneys, ovaries, thyroid gland, and leukocytes, Epac2 is characterized by more limited distribution and is expressed in adrenals, brain, and B-cells of the pancreas (de Rooij et al, 1998; Kawasaki et al, 1998; Bos, 2003; 2006). The main catalytic function of Epac1 is to activate Rap1 and Rap2, which are main regulators of fundamental cellular processes such as proliferation, differentiation, migration, apoptosis, cytoskeleton restructuring, and contractility (Mitin et al, 2005).
Although several recent researches point towards a role of Epac as a key regulator of cell adhesion and migration, there is little information on the effect of Epac-Rap1 system on
ICAM-1 expression in cerebrovascular endothelial cells. The signaling mechanisms about adhesion molecule expression are a matter of great interest, because the ability to control cell adhesion, and accordingly processes such as immune cell and tumor cell migration, would be of great therapeutic use in many inflammatory conditions.
II. AIMS OF STUDY
This study was designed to investigate whether PGE
2can induce the expression
of ICAM-1 in brain microvascular endothelium-derived bEnd.3 cells, and underlying
mechanisms therein involved. Followings are specific questions to be addressed in
this study.
1. Roles of COX/PGE
2in ICAM-1 expression and leukocyte adhesion
A. Does COX/PGE
2regulate ICAM-1 expression and leukocyte adhesion?
2. What EP receptors are involved in PGE
2effects on ICAM-1 expression?
3. What signaling pathways are involved in PGE
2-ICAM-1 expression?
A. Does cAMP or Ca
2+change increase ICAM-1 expression?
III. MATERIALS AND METHODS
Materials
Prostaglandin E2 (PGE2), N-[2-(Cyclohexyloxy)-4-nitrophenyl]methanesulfonamide
(NS-398), 1-(4-Chlorobenzoyl)-5-methoxy-2-methyl-3-indoleacetic acid (Indomethacin),
Chelerythrine chloride, lipopolysaccharide (LPS, E. coli O111:B4)) and anti-actin antibody were purchased from Sigma (St. Louis, MO, USA). GO6976, LY294002, Adenosine 3',5'-cyclic Monophosphate, 8-(4-Chlorophenylthio)-2'-O-Methyl- (8-Cpt-cAMP), Wortmannine, Akt inhibitor VIII (Akti), H-89, PKA inhibitor 14-22 amide (PKAi) were purchased from
Calbiochem (San Diego, CA). N6-Benzoyladenosine-3’,5’-cyclic monophosphate was from
Biolog Inc(Hayward, CA). (+)- Brefeldin A was purchased from Merck & Co., Inc
(Whitehouse station, NJ, USA). Sulprostone, (R)-Butaprost(free acid), Prostaglandin E1
alcohol (1-OH-PGE1) were purchased from Cayman Chemical (Ann Arbor, MI, USA).
ONO-8713, ONO-AE3-240, ONO-AE3-248 and ONO-AE2-227 were generous gifts from ONO Pharmaceutical Co. (Osaka, Japan). Primary antibody ICAM-1, Epac, p65, p-IκB-α, IκB-α, horseradish peroxidase conjugated secondary antibody were from Santa Cruz Biotechnology (Santa Cruz, CA, USA). IKKα, p-IKKα/β, p-Akt, Akt, p-CREB, CREB were from Cell Signaling (Danvers, MA, USA).
Cell culture
bEnd.3 : The murine brain cerebrovascular endothelia cells were obtained from American Type Culture Collection (Manassas, VA, USA) and cultured in Dulbecco’s modified Eagle’s
medium (Welgene, Seoul, Korea) supplemented with 10% FBS, 100 U/ml penicillin/streptomycin (Invitrogen, Carlsbad, CA, USA) and 1,500 mg/L sodium
bicarbonate. Cells were maintained in a humidified incubator with 5% CO2 and passaged
every 2 days at 1×10⁵ cells/mL.
Primary brain endothelial cells : C57BL/6 mouse brain endothelial cells were obtained from Cell Biologics (Chicago, IL, USA) and culture in Cell Biologics Culture Complete Growth Medium supplemented with 10% FBS (Cell Biologics), 0.1% mVEGF, 0.1% heparin, 0.1% rmEGF, 0.1% hydrocortisone, 0.2% ECGS, 1% L-glutamine, 1%
antibiotic-antimycotic. Cell were maintained in a humidified incubator with 5% CO2 and passaged
every 3 days at 1x10⁵ cell/mL.
Western blot analysis
Western blot analysis was used to determine the expression of ICAM-1 and the activation of Akt, GSK-3β, IKK, IkB, MAPKs, Rap-GTP, CREB,. After treatment cell lysates were prepared by scraping cells in the lysis buffer (Tris 50 mM at pH 7.4, 10 mM EDTA, 1% Tween-20, 10 μg/ml aprotinin, leupeptin, and 1 mM phenylmethyl-sulfonyl fluoride, 1 mM sodium orthovanadate, and sodium fluoride) and sonicating for 10-15 s (20-W pulses). Cell lysates containing equal amounts of protein were subjected to a 10% SDS-PAGE at 30 mA.
Proteins were transferred to PVDF membranes for 1.5 h at 10volt using Trans-Blot SD®
Semi-Dry Transfer Cell (Biorad, Hercules, CA, USA) and subsequently blocked in T-TBS buffer (20 mM Tris buffer; 0.5 M NaCl, 0.5% Tween-20) containing 5% non-fat dried milk.
Blots were incubated with ICAM-1, p-IκB-α, IκB-α, IKKα, Epac (Santa Cruz Biotechnology, Santa Cruz, CA, USA, 1:1000), p-IKKα/β (Ser176/180), p-Akt (Thr308), Akt, p-CREB, CREB (Cell Signaling Technology, Danvers, MA, USA, 1:1000), actin (Sigma, St. Louis, MO, USA) and followed by incubation with a horseradish peroxidase conjugated goat anti-rabbit IgG secondary antibody (Santa Cruz Biotechnology, 1:5,000). The blots were visualized using an ECL chemiluminescence detection kit (Amersham Biosciences, Piscataway, NJ, USA).
Estimation of Rap1(a measure of Epac activity) activity by a pull-down assay
Activation of Rap1 was determined by the Active GTPase Pull-down and Detection Kits (Thermo Fisher Scientific Inc., Rockford, IL, USA) with slight modifications. In brief,
bEnd.3 cells were incubated with or without 1 ng/mL PGE2, 10 μM dbcAMP and 100 µM
8-Cpt-2’-O-Me-cAMP for 15 min at 37 °C. Total proteins were isolated from cells by a brief sonication in lysis buffer. After centrifugation at 16,000 g at 4 °C for 15 min to remove insoluble materials, the supernatants (500 µg of protein) were incubated with 20 µg of GST-RalGDS-RBD and an glutathione resin for 1 h at 4 °C. The affinity-purified activated Rap proteins (Rap-GTP) were eluted with 2X SDS sample buffer and analyzed by western blotting with anti-Rap1 antibody.
Reverse transcription and polymerase chain reaction (RT-PCR)
Total RNA was extracted from the samples with Easy-blue kitÒ (Intron, Seoul, Korea)
RNA (1 mg) and RevertAidTM First strand cDNA Synthesis Kit(Fermantas, Glen Burnie, MD, USA). The reaction was performed at 42 oC for 1 h and heated at 72 oC for 10 min, RT reaction mixture, cDNA, was used for PCR amplification. Primer sequences were as follows:
ICAM-1, sense, 5'-GCA AGT AGG CAA GGA CCT CAC-3,
antisense, 5'-CGA CGC CGC TCA GAA GAA CCA C-3';
GAPDH, sense, 5'-GTG AAG GTC GGT GTG AAC TTT-3',
antisense, 5'-CAC AGT CTT CTG AGT GGC AGT GAT-3'.
PCR amplification of the resulting cDNA template was conducted using the following
conditions: ICAM-1; 30 cycles of denaturing at 94 oC for 1 min, annealing at 58.7 oC for 1
min, and extension at 72 oC for 1 min; GAPDH; 25 cycles of denaturing at 94 oC for 0.5 min,
annealing at 60 oC for 0.5 min, and extension at 72 oC for 0.5 min. Reaction products were
then separated on a 2% agarose gel and photographed under ultraviolet light. The optical density was determined by a Gel doc system (GEL DOC 2000, Bio-Rad, Hercules, CA, USA).
Real-time quantitative PCR for EP receptors
Total cellular RNA was extracted using Easy BlueTM (Intron Inc. Korea), and 1 μg of the
extracted RNA was reverse-transcribed using RevertAidTM First strand cDNA Synthesis Kit
(Fermantas, Glen Burnie, MD, USA). Equal amounts of cDNA were used for quantification of specific real-time quantitative RT-PCR. EP receptors sequence was amplified using a
LightCycler® 480 SYBR Green I Master (Roche Applied Science, Indianapolis, IN, USA).
follows : EP1, sense, 5'-GTG CCA AGG GTG GTC CAA-3', antisense, 5'-AAC CAC TGT GCC GGG AAC TA-3'; EP2, sense, 5'-ATC ACC TTC GCC ATA TGC TC-3', antisense, 5'-GGT GGC CTA AGT ATG GCA AA-3'; EP3, sense, 5'-GCT GTC CGT CTG TTG GTC-3', antisense, 5'-CCT TCT CCT TTC CCA TCT G-3'; EP4, sense, 5'-TCA TCT TACT CA TCG CC ACCT-3', antisense, 5'-TTC ACC ACG TTT GGC TGA TA-3' and GAPDH, sense, 5'- CTG CAC CAC CAA CTG CTT AGC -3', antisense, 5'- CTT CAC CAC CTT CTT GAT GTC-3'. The following experimental protocol entailed 45 cycles of denaturation at 95 °C for 10 s; annealing at 60 °C (for EP1), 52 °C (for EP2), 60 °C (for EP3), 60 °C (for EP4) or 58 °C (for GAPDH) for 20 s; and elongation at 72 °C for 10 s (for EP1, EP2, EP3, EP4) or 15 s (for GAPDH). Melting curves were determined to ensure amplification specificity of the PCR products. The quantification data were analyzed with LightCycler® software 3.3 (Roche Applied Science).
Immunocytochemistry
Cells were cultured on round coverslips for 2 days in DMEM with 10 % FBS. The cells
were then serum-starved for 24 h and treated with 1 ng/mL PGE2 or 100 μM 8-Cpt-cAMP
for 15 min. Next, the cells were fixed with 4 % paraformaldehyde in Dulbecco’s phophate
buffered saline (0.9 mM CaCl2, 2.7 mM KCl, 1.2 mM KH2PO4, 0.49 mM MgCl2, 138 mM
NaCl and 8.1 mM Na2HPO4). After incubating with blocking solution (0.5 % bovine serum
albumin in 20 mM Hepes, pH 7.4, 120 mM NaCl, 1.8 mM CaCl2, 5.4 mM KCl, 1.7 mM
MgCl2 and 15 mM glucose) for 30 min, the samples were incubated with a indicated primary
isothiocyanate-conjugated secondary antibody (Molecular Probes, Eugene, OR, USA) for 1 h at room temperature. The stained samples were mounted on slide glasses with VECTASHIELD® (VectorLab, Burlingame, CA, USA) and examined with a confocal laser scanning microscope with 488 nm of Ar laser and 543 nm of a long pass emission filter (FV-300, Olympus, Tokyo, Japan).
Monocyte-endothelial cell adhesion assay
The adherence of U937, a monocytic cell line, to activated bEnd.3 cells were examined under static conditions as previously described with minor modifications (Clercka et al., 1994). Briefly, U937 cells were labeled with 10 μM of CellTrackerTM Orange (Invitrogen, Carlsbad, CA, USA) in RPMI-1640 medium containing 10 % FBS at 37 °C for 1 h and subsequently washed by 3 repetitions of contrifugation and re-suspension in PBS. LPS-treated bEnd.3 cells in 24well plates were incubated with U937 cells (4x10⁵ cells/mL) at 37 °C for 1 h. Non-adherent leukocytes were removed. and plates were gently washed several times with PBS. Adhered cells were imaged under Axiovert 200 inverted microscope (Carl Zeiss, Thornwood, NY, USA).
Plasmids and transfection
AP-1 and NF-κB binding site (2x)-luciferase reporter constructs were provided by Dr. Joo Yong Lee, Catholic University, Korea. Expression vectors (pUSEs) and catalytically active (CA) mouse Akt were obtained form UPSTATE (Charlottesville, VA, USA). Plasmid for the constitutively active PKA-Cα was gifted from Dr. Haeyoung Suh (Ajou University,
Suwon, Korea). Mouse Epac1 siRNA was a pool of 5 target-specific 19-25 nt siRNAs designed to silence Epac1 gene expression in mouse cells (Santa Cruz Biotechnology, Santa Cruz, CA, USA). All constructs for transfection were prepared by Endofree Plasmid Midi kit (Qiagen, Chatsworth, CA, USA). bEnd.3 cells were transiently transfected in serum-free
medium with DNA or siRNA using LipofectamineTM 2000 reagent (Invitrogen, Carlsbad,
CA, USA) according to the manufacturer’s instructions and treated with different agents and all of them were used for experiment at 48 h after transfection. pcDNA3 vector or control siRNA (Santa Cruz Biotechnology, Santa Cruz, CA, USA) was used as a negative control.
The EP1 siRNA (ON-TARGETplus SMARTpool PTGER1; L-042324-00), EP4 siRNA (ON-TARGETplus SMARTpool PTGER4; L-048700-00), and control siRNA (D-001210-01-20) were purchased from Dharmacon (Lafayette, CO, USA). bEnd.3 cells were grown to 70-8 0% confluence in antibiotics-free DMEM medium and transfected with each siRNA at 100 nM using X-Treme Gene siRNA transfection reagent (Roche Applied Biosciences, Indianapolis, IN, USA).
Luciferase assay
bEnd.3 cells (5x10⁴ cells/24well) were co-transfected with a luciferase plasmid and
β-galactosidase plasmid as an internal control using LipofectamineTM 2000 reagent (Invitrogen,
Carlsbad, CA, USA) according to the manufacturer’s instructions. Luciferase and galactosidase enzyme activities were determined using the luciferase assay system and β-galactosidase enzyme system (Promega, Madison, WI, USA) as the manufacturer’s
instructions. Luciferase activity was measured using TURNER DESIGNS TD-20/20 luminometer (Turner Biosystems, Sunnyvale, CA, USA) and normalized with β-galactosidase activity.
Ca2+ measurement
The cytosolic Ca2+ level was measured after loading cells with the fluo-3 acetoxymethyl
ester (Molecular probes, Eugene, OR, USA), a selective fluorescent indicator for cytosolic
Ca2+. bEnd.3 cells plated on glass-bottom dishes were washed three times with
HEPES-buffered control salt solution (HCSS) containing 120 mM NaCl, 1.6 mM MgCl2, 2.3 mM
CaCl2, 15 mM glucose, 20 mM HEPES, and 10 mM NaOH. The cells were loaded with 5
μM fluo-3 for 20 min at 37 °C in HCSS. After washing with HCSS, the cells were observed with a confocal microscope (Olympus, Japan) and flou-3 fluorescence was excited at 480 nm and emitted at 520 nm. The fluorescence intensity of fluo-3 was quantified using image-analysis computer software (Fluoview FV300; Olympus, Japan).
cAMP measurement
Cells (1x10⁵ cells/mL) were plated in 6-well dishes containing 2 ml/well of complete
medium. Cells were allowed to attach overnight and then stimulated with 1 ng/mL PGE2 for
5-30 min respectively, or left unstimulated. Following stimulation, the medium was removed and the cells lysed in 0.1 M HCl. cAMP concentration was quantified by ELISA using a cAMP kit (Cayman, Ann Arbor, MI, USA) according to the manufacturer’s protocol and normalized to the protein concentration of the lysate. Protein concentrations were determined
using protein assay kits (BCA).
Statistical analysis
The data were expressed as the mean ± standard error of the mean (SEM) from three to six
independent experiments. Statistical differences between groups were evaluated by Student’s t-test. P value less than 0.05 was considered to be significant.
IV. RESULTS
1.
COX1/2 inhibition significantly reduces LPS-induced ICAM-1 expression and leukocyte adhesionIt has been well documented that inflammatory brain injury is associated with disruptions in BBB which allow both an increased number of immune cells and macromolecules access to the brain extracellular fluid and the development of cerebral edema (Iadecola et al, 2001, Wyss-Coray and Mucke, 2002) and prostaglandins such as PGE2 and PGF2α are linked to alterations in BBB integrity during inflammation in CNS (Mark et al, 2001). Moreover, several studies suggested that COX inhibitors attenuates ICAM-1 expression under neuroinflammatory situations (Stanimirovic et al, 1997; Miyamoto et al, 2006). Although
PGE2 is one of the most likely candidates for propagation of neuroinflammation (Ikeda et al,
2006; Liang et al, 2008), there is no report to address the effects of COX/PGE2 in connection
with ICAM-1 expression in cerebrovascular endothelial cells. In this study, it was
investigated the effects of COX inhibitors and PGE2 on ICAM-1 expression and leukocyte
adhesion in treated cerebrovascular endothelial cells. On the hypothesis that
LPS-induced PGE2 production causes ICAM-1 expression and leukocyte adhesion, cells were
exposed to COX inhibitors such as indomethacin (Indo, 10 μM) and NS-398 (10 μM) in the
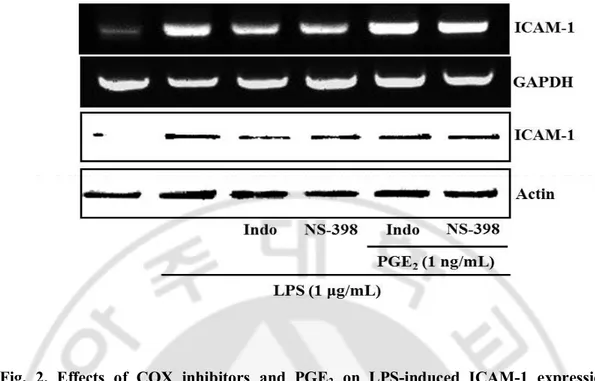
presence or absence of PGE2. indomethacin and NS-398 significantly reduced LPS-induced
ICAM-1 expression and this inhibitory effect was reversed by the treatment of PGE2 (Fig 2).
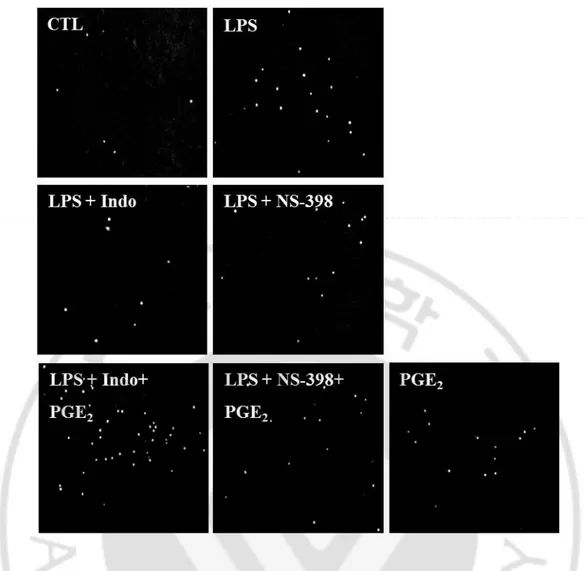
Cells were stimulated with LPS for 12 h in the presence or absence of PGE2, followed by
to endothelial cells. Again, COX inhibitors significantly reduced LPS-induced leukocyte
adhesion and inhibition was reversed by PGE2 treatment (Fig 3). Taken together, these data
suggest that the COX-derived PGE2 could regulate LPS-induced ICAM-1 expression and
Fig. 2. Effects of COX inhibitors and PGE2 on LPS-induced ICAM-1 expression.
bEnd.3 cells were exposed to LPS (1 μg/mL) in the absence or presence of indomethacin
(COX-1/2 inhibitor, Indo, 10 μM), NS-398 (COX-2 inhibitor, NS, 10 μM), PGE2 (1 ng/mL)
for 4 h or 24 h to assess the levels of mRNA and protein, respectively. The protein and mRNA levels of ICAM-1 were determined by western blotting and RT-PCR as described in Material and Methods.
Fig. 3. Effects of COX inhibitors and PGE2 on LPS-induced adhesion of leukocyte to
bEnd.3 cells. bEnd.3 cells were incubated with LPS (1 μg/mL) in the absence or presence of
indomethacin (COX-1/2 inhibitor, Indo, 10 μM), NS-398 (COX-2 inhibitor, NS, 10 μM),
PGE2 (1 ng/mL) for 12 h and further incubated with CellTrackerTM Orange prelabeled U937
2.
PGE2 induces a time- and dose- dependent increase in ICAM-1 expression andleukocyte-endothelial adhesion
Although effects of COX-2 and prostanoids on expression of adhesion molecule have been widely investigated, there are several contradictory reports on the role of PGE2 in
ICAM-1 expression. In order to explore the role of PGE2 in the regulation of brain
inflammation, its effects on the expression of ICAM-1 in bEnd.3 cerebrovascular endothelial
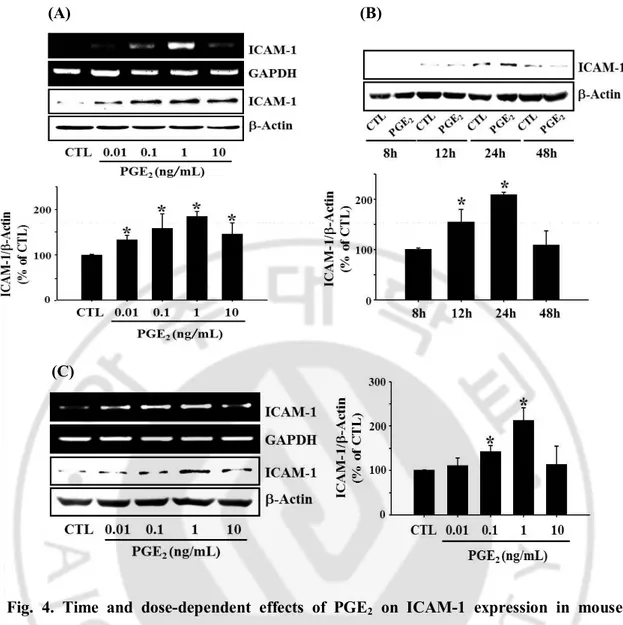
cells and leukocyte-endothelial cell adhesion were investigated. As depicted in Fig 4, PGE2
induced ICAM-1 expression in a dose dependent manner and maximal effect was observed at 1 ng/mL in bEnd.3 cell (Fig 4A). Experiments with primary cultured mouse brain endothelial cells showed qualitatively same results as those obtained from bEnd.3 cells (Fig
4C). Time course study showed PGE2-induced ICAM-1 expression reached to maximum in
24 h and declined to control level in 48 h (Fig 4B). Thus, cells were stimulated with 1 ng/mL
for 24 h of PGE2 in the subsequent experiments. Exogenous PGE2 dose-dependently
increased the adhesion of monocytes to endothelial cells and again, maximal effect was
observed at 1 ng/mL (Fig 5). These data indicate that PGE2 plays a role in the regulation of
the brain endothelial ICAM-1 expression and leukocyte-endothelial cell adhesion, supporting the previous reports of COX-dependent ICAM-1 expression in the brain cells under various pathological conditions (Stanimirovic et al., 1997; Kyrkanides et al., 2002; Seok et al., 2006).
(A) (B)
(C)
Fig. 4. Time and dose-dependent effects of PGE2 on ICAM-1 expression in mouse
cerebrovascular endothelial cells. (A) bEnd.3 cells were incubated with varying
concentrations of PGE2 (0.01~10 ng/mL) for 4 h (RT-PCR) or 24 h (Western blot). (B) Time
course for PGE2-induced ICAM-1 expression. (C) primary cultured mouse brain endothelial
cells were incubated with varying concentrations of PGE2 (0.01~10 ng/mL) for 4 h
(RT-PCR) or 24 h (Western blot). Values are mean ± S.E. of protein levels of ICAM-1 relative to β-actin (n=3). * P < 0.05 compared with control (CTL).
Fig. 5. Effect of PGE2 on leukocyte adhesion. PGE2 stimulated adherence of U937 monocytes to bEnd.3 brain endothelial cells. bEnd.3 cells were treated with varying
concentration of PGE2 (0.01~10 ng/mL) for 24 h and further incubated with CellTrackerTM
Orange prelabeled U937 cells (4x10⁵ cells/mL) at 37 °C for 1 h. Adhered monocyte cells were imaged under Axiovert 200 inverted microscope. Data are presented as mean ± S.E. of three independent measurements. * P < 0.05 vs control.
3.
EP4 receptor is associated with PGE2-induced ICAM-1 expressionTo delineate the E-prostanoid (EP) receptors involved in PGE2–induced endothelial
ICAM-1 expression, the expression of EP receptor subtypes and the effects of EP receptor-selective agonists and antagonists on ICAM-1 expression were examined in bEnd.3 cells. Real-time PCR analysis showed that EP1 and EP4 receptors were strongly expressed in these cells while EP3 receptors were barely detected (Fig 6). In addition, RT-PCR analysis with primary cultured mouse brain endothelial cells also showed qualitatively same results as those obtained from bEnd.3 cell (data are not shown). Specific agonists, antagonists, and EP receptor siRNA for each receptors were adopted to identify the responsible receptor subtype(s) for ICAM-1 expression. PGE2 as well as sulprostone, an EP1/3 agonist, and
1-OH-PGE1, an EP4 selective agonist, induced the expression of ICAM-1 expression, whereas
butaprost, an EP2 agonist, and ONO-AE-248, an EP3 selective agonist did not show any significant effect (Fig 7). Among EP receptor subtype selective antagonists, only
ONO-AE2-227 (EP4 antagonist) significantly reduced PGE2-induced ICAM-1 expression and knock
down of EP1 or EP4 receptor with siRNA resulted in reduction of ICAM-1 expression
during PGE2 challenge (Fig 8). EP1 antagonist (ONO-8713) was effective at high dose (100
μM; data are not shown) whereas no significant effect was observed at 10 μM as shown in Fig 8A. Because cell morphology was changed at high dose, result obtained at high dose is
not included. PGE2-stimulation of ICAM-1 expression blocked by knock-down of EP1 and
EP4 with siRNA (Fig 8B). These findings suggest that EP1 and EP4 receptor are associated
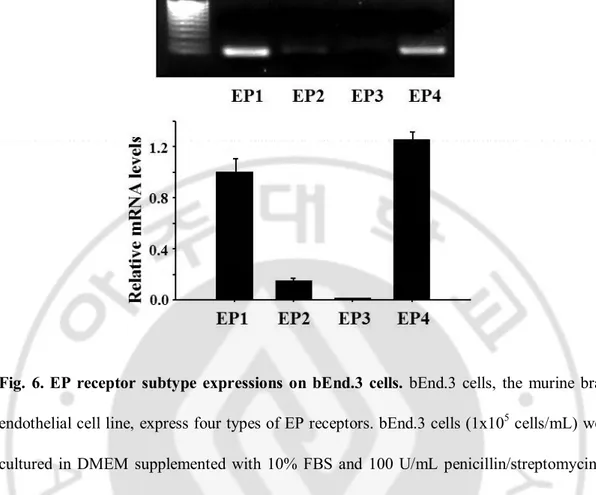
Fig. 6. EP receptor subtype expressions on bEnd.3 cells. bEnd.3 cells, the murine brain
endothelial cell line, express four types of EP receptors. bEnd.3 cells (1x10⁵ cells/mL) were
cultured in DMEM supplemented with 10% FBS and 100 U/mL penicillin/streptomycin at 37 °C for 24 h, and total RNA was extracted, and subjected to real-time PCR for EP1, EP2, EP3 and EP4 mRNA using the respective primers as described in Materials and Methods. Values represent the mean ± S.E. of mRNA levels of the gene relative to murine GAPDH expression (n=3).
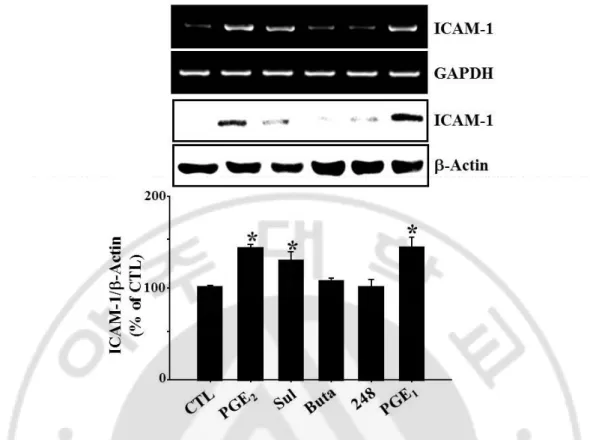
Fig. 7. Effects of specific EP agonists on ICAM-1 expression. bEnd.3 cells were incubated
with Sulprostone (EP1/3 agonist, Sul, 10 nM), Butaprost (EP2 agonist, Buta, 10 μM),
ONO-AE-248 (EP3 agonist, 248, 10 μM), and 1-OH-PGE1 (EP3/4 agonist, PGE1, 10 μM) for 4 h or
24 h. The levels of ICAM-1 mRNA and protein were determined by RT-PCR and western blotting. Data are representive of four separate experiments. Values are mean ± S.E. of protein levels of ICAM-1 relative to β-actin (n=4). P<0.05 compared with control (CTL).
(A) (B)
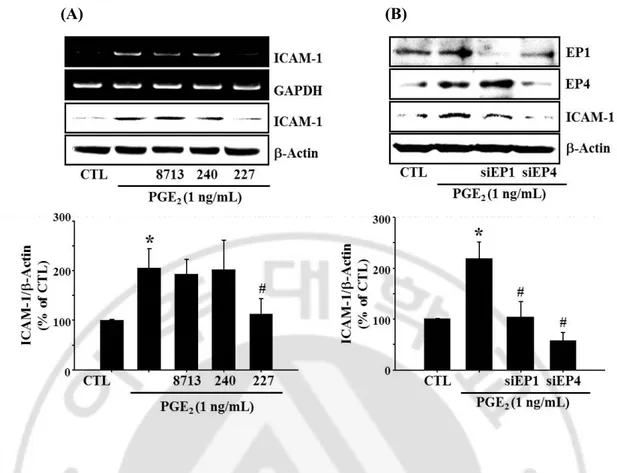
Fig. 8. Effects of specific EP antagonists and knockdown of EP receptor with siRNA on PGE2-induced ICAM-1 expression. (A) bEnd.3 cells were incubated with selective EP
antagonists (EP1:ONO-8713, 10 μM; EP3: ONO-AE3-240, 10 μM; EP4:ONO-AE2-227, 10 μM). (B) In the separate experiments, bEnd.3 cells were transfected with EP1 or EP4 siRNA
(100 nM) in the presence of PGE2 (1 ng/mL) for 4 h or 24 h. For controls, cells were treated
with DMSO (untreated) and/or control siRNA (scrambled). The levels of ICAM-1 mRNA and protein were determined by RT-PCR and western blotting. Data were expressed as the mean ± SEM of three independent experiments for protein levels. *P < 0.01 vs vehicle controls, #P < 0.05 vs bEnd.3 stimulated with PGE2.
4.
PGE2-induced ICAM-1 expression is mediated by cAMP-dependent but not Ca2+-dependent signaling pathways
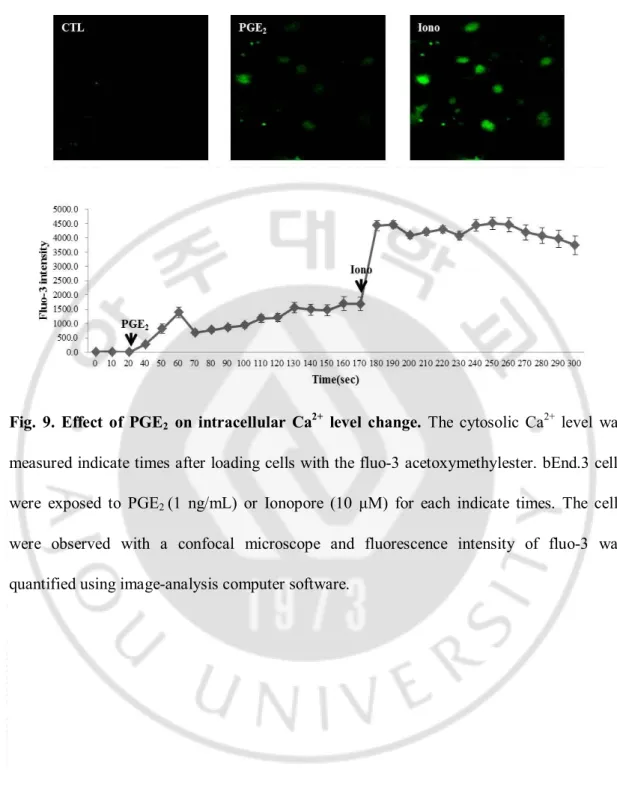
PGE2 is known to modify intracellular Ca2+ change through EP1 receptor. It is observed
that intracellular level of Ca2+ was increased in bEnd.3 cells during PGE
2 challenge. Since
EP1-mediated increase in intracellular Ca2+ level is associated with PKC and MAPK
activation (Tang et al, 2005), it was examined whether PKC or MAPK was involved in
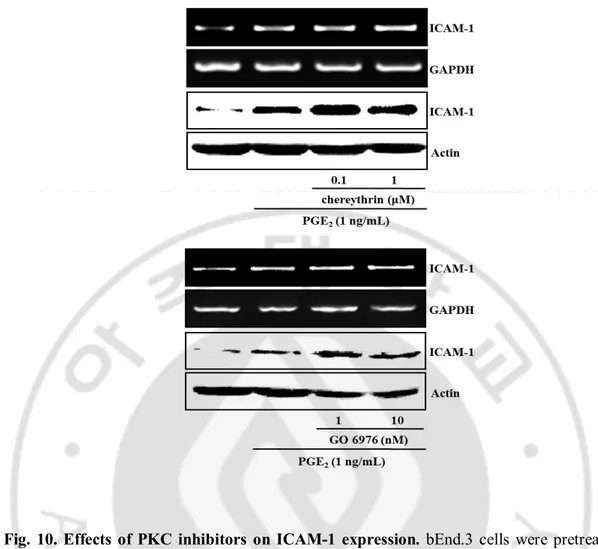
PGE2-induced ICAM-1 expression. In Fig 10, classical PKC isoform inhibitor (α, β, γ,
GO6976) and novel PKC isoform inhibitor (δ, θ, ε, η, chelerythrine) did not elicit any change
during PGE2 treatment. Although PGE2 stimulated MAPK phosphorylation, each MAPK
inhibitors, PD98059 (ERK), SB203580 (p38) and SP600125 (JNK), had no significant effect
on PGE2-induced ICAM-1 expression (Fig 11). These finding indicates that EP1-mediated
PKC or MAPK might not be associated with expression of ICAM-1 during PGE2 challenge.
It is well known that the EP4 receptor is positively coupled to cAMP production. Cellular
level of cAMP was increased in bEnd.3 endothelial cells exposed to PGE2 (Fig 12, 32.9±1.6
and 58.7±5.0 pmol/mg protein in control and PGE2 at 5 min, respectively). The effect of
PGE2 on ICAM-1 expression was mimicked by the cAMP analog dibutyryl cAMP
(dbcAMP) as well as the adenylyl cyclase activator forskolin (Fig 13), indicating the
Fig. 9. Effect of PGE2 on intracellular Ca2+ level change. The cytosolic Ca2+ level was
measured indicate times after loading cells with the fluo-3 acetoxymethylester. bEnd.3 cells were exposed to PGE2 (1 ng/mL) or Ionopore (10 μM) for each indicate times. The cells were observed with a confocal microscope and fluorescence intensity of fluo-3 was quantified using image-analysis computer software.
Fig. 10. Effects of PKC inhibitors on ICAM-1 expression. bEnd.3 cells were pretreated
with PKC inhibitors such as chelerythrine (novel PKC inhibitor, 0.1-10 μM) and GO 6976
(conventional PKC inhibitor, 1-10 nM) for 30 min and further incubated with PGE2 (1
ng/mL) for 4 h (RT-PCR) or 24 h (immunoblot). The protein and mRNA levels of ICAM-1 were determined by western blotting and RT-PCR as described in Material and Methods.
(A) (B)
Fig. 11. Effects of MAPK inhibitors on PGE2-induced ICAM-1 expression. (A) PGE2 (1 ng/mL) stimulated MAPK phosphorylation (left). Blots showed data obtained at 15 min after
PGE2-treatment. bEnd.3 cell were pretreated with MAPK inhibitors such as PD98059 (ERK
inhibitor, 10 μM), SB202190 (p38 inhibitor, 10 μM) and SP600125 (JNK inhibitor, 4 μM)
for 30 min and further incubated with PGE2 (1 ng/mL) for 4 h (RT-PCR) or 24 h
(immunoblot), respectively. The protein and mRNA levels of ICAM-1 were determined by western blotting and RT-PCR as described in Material and Methods.
Fig. 12. Effect of PGE2 on intracellular cAMP level. bEnd.3 cells (1x10⁵ cells/mL) were
treated with PGE2 (1 ng/mL) for indicated times, then cellular cAMP levels were measured
as described in Methods. Data (mean ± S.E. of three separate measurements) are expressed as pmoles of cAMP/mg-protein. * P < 0.05 compared with time matched control (CTL).
Fig. 13. Effects of cAMP elevating agents on ICAM-1 expression. bEnd.3 cells were
exposed to cAMP elevating agents, such as dbcAMP (cAMP analogue, 1-10 μM) and
forskolin (adenylyl cyclase activator, 1-10 nM) in the absence of PGE2 (1 ng/mL) for 4 h or
24 h to assess the levels of mRNA and protein, respectively. The protein and mRNA levels of ICAM-1 were determined by western blotting and RT-PCR as described in Material and Methods. Values are mean ± S.E. of protein levels of ICAM-1 relative to b-actin (n=3). * P < 0.05 compared with control (CTL).
5.
PGE2-induced ICAM-1 expression is mediated by Epac signaling pathwayIt has been known that two key ligand for cAMP are protein kinase A (PKA) and the exchange protein directly activated by cAMP (Epac), which is a recently discovered guanine nucleotide exchange factor (GEF) for the small GTPases Rapl and Rap2(Bos, 2003; 2006).
PGE2 activated two key receptors for cAMP, protein kinase A (PKA) and exchange protein
directly activated by cAMP (Epac) as assessed by CREB phosphorylation and Rap1-GTP formation (Fig 14). 8-Cpt-cAMP, an Epac specific activator induced ICAM-1 expression and
a knock-down of Epac1 with siRNA resulted in the elimination of PGE2 effect on ICAM-1
expression (Fig 17, 18A). In addition, brefeldin A (BFA), an inhibitor of Epac pathway
(Zhong et al, 2005), diminished PGE2-induced ICAM-1 expression (Fig 18B). In contrast,
neither a PKA specific activator N6-Bnz-cAMP, nor a PKA inhibitor H-89 affected ICAM-1
expression (Fig 15, 16). Furthermore, transient expression of catalytically active PKA-Ca did not elicit any significant effect on ICAM-1 expression (Fig 15B). These findings suggest
Fig. 14. Effects of PGE2 on PKA and Epac activation in bEnd.3 cells. PGE2 activates two key receptors for cAMP, PKA and Epac as assessed by CREB phosphorylation and
Rap1-GTP formation. Cells were treated with PGE2 (1 ng/mL), dbcAMP (cAMP analogue, 10 μM),
8-(4-chlorophenylthio)-2’-O-methyl adenosine 3’5’-cyclic monophosphate (8-Cpt-cAMP,
Epac specific activator, 100 μM), an Epac activator or N6-benzoyladensine-3’,5’-cyclic
monophosphate (N6-Bnz-cAMP, PKA specific activator, 100 μM), a PKA activator for 15
min. Rap1-GTP formation was assessed by pulling down the active form of Rap1 with GST-RalGDS RBD as described in Materials and Methods. CREB phosphorylation was determined by immunoblot. Data are representative of three independent experiments.
(A) (B)
Fig. 15. Effects of PKA activation on ICAM-1 expression. (A) bEnd.3 cells were exposed
to N6-Benz-cAMP (PKA specific activator, 1-100 μM) for 4 h or 24 h to assess the levels of
mRNA and protein, respectively. (B) In a separate experiment, PKA-Cα, a catalytically active form of PKA, was transfected as described in Methods. The levels of ICAM-1 mRNA and protein were determined by RT-PCR and immunoblot. Data are representative of three independent experiments. Values are mean ± S.E. of protein levels of ICAM-1 relative to b-actin (n=3). * P < 0.05 compared with control (CTL).
Fig. 16. Effects of PKA inhibitors on PGE2-induced ICAM-1 expression. bEnd.3 cells
were pretreated with H89 (PKA inhibitor, 1-10 μM) or PKAi (PKA inhibitor, 0.1-1 μM) for
30 min and further incubated with PGE2 (1 ng/mL) for 4 h (RT-PCR) or 24 h (immunoblot).
The levels of ICAM-1 mRNA and protein were determined by RT-PCR and immunoblot. Data are representative of three independent experiments.
Fig. 17. Effects of Epac specific activator on ICAM-1 expression. bEnd.3 cells were
exposed to 8-Cpt-cAMP (Epac specific activator, 1-100 μM) for 4 h or 24 h to assess the levels of mRNA and protein, respectively. The levels of ICAM-1 mRNA and protein were determined by RT-PCR and immunoblot at 4 h and 24 h, respectively. Data are representative of three independent experiments. Values are mean ± S.E. of protein levels of ICAM-1 relative to b-actin (n=3). * P < 0.05 compared with control (CTL).
(A) (B)
Fig. 18. Effect of Epac inhibition on PGE2-induced ICAM-1 expression. (A) Epac1 was
deleted with siRNA for Epac1 as described in Methods. (B) In a separate experiment, cell were pretreated with brefeldin A (BFA, Epac inhibitor, 10 μM) for 30 min and further
incubated with PGE2 (1 ng/mL) for 4 h (RT-PCR) or 24 h (immunoblot). The levels of
ICAM-1 mRNA and protein were determined by RT-PCR and immunoblot at 4 h and 24 h, respectively. Data are representative of four independent experiments. Values are mean ± S.E. of protein levels of ICAM-1 relative to b-actin (n=4). * P < 0.05 compared with control
6.
PI3K/Akt signaling pathway is involved in PGE2-induced ICAM-1 expressionPrevious studies showed that Epac/Rap1 pathway is involved in the activation of PI3K/Akt pathway (Bos, 2006; Baviera et al, 2010; Namkoong et al, 2009), and PI3K/Akt activate mTOR to modulate NF-κB activation and ICAM-1 expression in human umbilical vein endothelial cell (Minhajuddin et al, 2009). Thus, to explore the downstream signaling of Epac/Rap1, possible involvement of PI3K/Akt pathway was examined. As shown in Fig 19,
PGE2, dbcAMP and 8-Cpt-cAMP stimulated the phosphorylation of Akt and GSK-3β,
downstream targets of PI3K and Akt, respectively. LY294002, a PI3K inhibitor and Akti, an
Akt inhibitor suppressed PGE2-induced ICAM-1 expression (Fig 20A). To confirm that
PI3K/Akt pathway are involved in the regulation of ICAM-1 expression during PGE2
challenge, additional experiment was conducted using molecular techniques for transfection of catalytically active (CA) Akt and dominant negative (DN) Akt. Transient expression of
catalytically active (CA) Akt increased the level of ICAM-1 protein in the absence of PGE2
and transfection of dominant negative (DN) Akt construct resulted in the reduction of
ICAM-1 expression during PGE2 challenge (Fig 20B). Transfected DN and CA Akt
successfully regulated the phosphorylation of GSK-3β, a downstream target of Akt, under our experimental condition (Fig 20B). These data indicate that PI3K/Akt signaling pathway
Fig. 19. Effects of PGE2 on Akt and GSK-3β phosphorylation. bEnd.3 cells were exposed
to PGE2 (1 ng/ml), dbcAMP (cAMP analogue, 10 μM) and 8-Cpt-cAMP (Epac specific
activator, 100 μM) for 15 min to assess the Akt and GSK-3β phosphorylation. The levels of Akt and GSK-3β phosphorylation were determined by western blotting. Values are mean ± S.E. of levels of phosphorylated Akt relative to total Akt (n=4). * P < 0.05 compared with control (CTL).
(A)
(B)
Fig. 20. Roles of PI3K/Akt in PGE2-induced ICAM-1 expression. (A) bEnd.3 cells were
pretreated with LY294002 (PI3K inhibitor, LY, 10 μM) or Akt inhibitor VIII (Akt inhibitor,
Akti, 100 nM) for 30 min and further incubated with PGE2 (1 ng/mL). The levels of ICAM-1
mRNA and protein were determined by RT-PCR and western blotting following 4 h or 24 h incubation. (B) Cells were transfected with pcDNA3 control vector (CTL), dominant-negative (DN) Akt or catalytically active (CA) Akt construct were transfected using
LipofectamineTM. After 36 h, transfected cells were treated with PGE
2 (1 ng/mL) for another
12 h and cell lysates were subjected to immunoblotting. Values are mean ± S.E. of protein levels of ICAM-1 relative to b-actin (n=4). * P < 0.05 compared with control (CTL), # P <
7.
PGE2-induced ICAM-1 expression is regulated by NF-κB activation through Aktsignaling pathway
Transcription factors such as NF-κB and AP-1 are known to bind to κB and TRE consensus sequences separately to regulate ICAM-1 gene expression (Chen et al, 2001). To
assess the effects of PGE2 on transcriptional activities of NF-κB and AP-1, NF-κB and
AP-1-specific reporter assays were adopted. As shown in Fig 21, PGE2 increased the
transcriptional activity of NF-κB whereas it did not elicit any significant effect in AP-1 reporter assay
It has been known that NF-κB activation is mediated by variety of extracellular signals, which can activate IκB kinase (IKK). IKK phosphorylates the IκBα protein, which results in ubiquitination and dissociation of IκBα from NF-κB. The dissociated NF-κB (p65 subunit) is then translocated into the nucleus where it binds to specific RE sequences of DNA (Perkins,
2007). In this study, PGE2 induced the phosphorylation of IKKβ and IκBα and stimulated the
translocation of p65 to the nucleus (Fig 22), supporting the activation of NF-κB by PGE2. dbcAMP and Epac activator (8-Cpt-cAMP) also showed similar effects (Fig 22). dbcAMP and 8-Cpt-cAMP increased NF-κB activity in a reporter assay, which was significantly suppressed by Akti, an Akt inhibitor (Fig 23).
To further investigate the role of NF-κB activation in PGE2-induced ICAM-1 expression,
it was examined the effect of NF-κB inhibitors on ICAM-1 expression. Bay-11-7082, an IκBα phosphorylation inhibitor, and MG 132, an IκBα degradation inhibitor, significantly
inhibited PGE2-induced ICAM-1 expression (Fig 24). These results suggest that
the expression of ICAM-1 in bEnd.3 brain endothelial cells exposed to PGE2. A functional
relevance of this molecular signaling was demonstrated in PGE2-induced promotion of
leukocyte adhesion (Fig 25). In primary cultured mouse brain endothelial cells, PGE2
-induced ICAM-1 expression was significantly attenuated by the treatment of ONO-AE2-227 (an EP4 antagonist), brefeldin A (an Epac inhibitor), Akti (an Akt inhibitor) or MG132 (an IkBα degradation inhibitor), confirming the results obtained from bEnd.3 brain endothelial cell (Fig 26).
Fig. 21. Effects of PGE2 on NF-κB and AP-1 transcriptional activity. bEnd.3 cells were
co-transfected with AP-1 binding site or NF-κB binding site(2x)-luciferase reporter plasmid and the expression plasmid of β-galactosidase. After 24 h, cells were treated with PGE2 (1 ng/mL) or LPS (1 μg/mL) for another 12 h, Luciferase activities were measured as described in Material and Methods and relative luciferase activity (RLA) was normalized with β-galactosidase activity. * P < 0.01 compared with control (CTL).
Fig. 22. Effects of PGE2 and Epac activator on IKK/IκB phosphorylation and p65
translocation. bEnd.3 cells were exposed to PGE2 (1 ng/mL), dbcAMP (cAMP analogue, 10 μM) and 8-Cpt-cAMP (Epac specific activator, 100 μM) to assess IKK and IκB phosphorylation for 15 min. The levels of IKK and IκB phosphorylation were determined by western blotting as described in Material and Methods. p65 translocation was determined by
confocal microscopy (p65 : green, Alexa Fluor○R
Fig. 23. Effect of Akt inhibition on PGE2 and Epac-induced NF-κB activation. bEnd.3
cells were transfected with NF-κB binding site (2x)-luciferase reporter plasmid. After 24 h, cells were treated Akt inhibitor VIII (Akti, 100 nM) for 30 min and further incubated with 1
ng/mL PGE2, 10 μM dbcAMP, and 100 μM 8-Cpt-cAMP for another 12 h. Data are
expressed as the mean ± SEM of three independent experiments. (*P < 0.01 vs vehicle
Fig. 24. Effect of NF-κB inhibitors on PGE2-induced ICAM-1 expression. bEnd.3 cells
were incubated with PGE2 (1 ng/mL) in the presence of NF-κB inhibitors such as MG132 (a
proteasome inhibitor, 10 μM) and Bay11-7082 (IκB phosphorylation inhibitor, 5 μM) for 4 h or 24 h to assess the levels of mRNA and protein respectively. The levels of ICAM-1 mRNA and protein were determined by RT-PCR and immunoblot at 4 h and 24 h, respectively. Data are representative of three independent experiments. *P < 0.01 vs vehicle controls (CTL), #P