Studies on the Cellular Responses and Roles
of Microglia, Astrocytes, and Blood-Derived
Inflammatory Cells in Injured Rat Brain
by
Hey-Kyeong Jeong
Major in Neuroscience
Department of Medicine Sciences
The Graduate School, Ajou University
Studies on the Cellular Responses and Roles of
Microglia, Astrocytes, and Blood-Derived
Inflammatory Cells in Injured Rat Brain
by
Hey-Kyeong Jeong
A Dissertation Submitted to The Graduate School of Ajou
University in Partial Fulfillment of The Requirements for The
Degree of Ph.D. in Neuroscience
Supervised by
Eun-Hye Joe, Ph.D.
Major in Neuroscience
Department of Medicine Sciences
The Graduate School, Ajou University
This certifies that the dissertation of
Hey-Kyeong Jeong is approved.
SUPERVISORY COMMITTEE
_________________________
Ilo Jou
_________________________
Eun-Hye Joe
_________________________
Eun Joo Baik
_________________________
Sang Myun Park
_________________________
Inn-Oc Han
The Graduate School, Ajou University
December, 23rd, 2010
- ABSTRACT -
Studies on the Cellular Responses and Roles of Microglia, Astrocytes,
and Blood-Derived Inflammatory Cells in Injured Rat Brain
Brain inflammation is accompanied by brain injury. For several decades, brain inflammation has
been considered toxic to the brain. However, recent studies also suggest beneficial roles of
inflammation in injured brain. In this study, I analyzed patterns and roles of brain inflammation
in injured brain in vivo from the early stage of the injury to have answers to the question
whether brain inflammation is harmful and beneficial. In the first part of this study, acute
neuronal damage was induced by stereotaxic injection of ATP into the substantia nigra pars
compacta (SNpc) and the cortex of the rat brain. ATP acutely caused death of microglia as well
as neurons in a similar area within 3 h, and monocytes filled the damaged core after neurons and
microglia died. Neither activated microglia nor monocytes expressed iNOS, a major neurotoxic
inflammatory mediator. Monocytes rather expressed CD68, a marker of phagocytic activity.
Importantly, the total number of dopaminergic neurons in the SNpc at 3 h (~80% of that in the
neuron-damage area detected at 3 h did not increase for up to 7 d. Thus, the inflammatory responses of
microglia and monocytes in response to ATP-induced acute injury may not be neurotoxic. In the
second part, I examined behavior and roles of infiltrated monocytes in LPS-injected SNpc.
Monocytes vigorously infiltrated at 3 d and thereafter gradually decreased. Some of infiltrated
monocytes died, and the remaining monocytes changed morphologically from round to ramified
ones. Monocytes exert alternatively activated phenotypes: strong expression of phagocytic
activity but negligible expression of pro-inflammatory mediators such as TNF-α, IL-1β and
iNOS. Accordingly, recovery of impaired astrocytes, endothelial cells, and neuronal cells
occurred after monocytes infiltrated. These results indicate that monocytes play important roles
to repair of the injured brain. In the third part, it has been examined how systemic inflammation
(SI) affected brain inflammation. After the induction of SI, in the SN region, microglia were
morphologically activated, neutrophils infiltrated, and mRNA/protein expression of
inflammatory mediators increased within 4-8 h, and subsided within 1-3 days. However,
dopaminergic neuronal loss was not detectable for up to 8 d after induction of SI. These results
indicate that acute systemic inflammation causes brain inflammation, but this is not sufficiently
brain inflammation functions to isolate damaged sites, remove dead cells and debris, and repair
microenvironment of the brain rather than to produce cytotoxic proinflammatory mediators.
LIST OF CONTENTS
ABSTRACT ··· i
LIST OF CONTENTS ··· iv
LIST OF FIGURES ··· ix
LIST OF TABLE ··· xiii
LIST OF ABBREVIATION ··· xiv
I.
INTRODUCTION ··· 1A. Brain inflammation ··· 1
1. Brain inflammation ··· 1
2. Effect of brain inflammation on acute brain injury degenerative disease ··· 2
(1) Brain inflammation on acute brain injury ··· 2
(2) Brain inflammation on neurodegenerative disease ··· 3
(3) Role of the brain inflammation in the injured brain ··· 5
3. Regulation of brain inflammation ··· 7
(1) Host defense system ··· 7
(2) Resolution of inflammation ··· 7
B. Cells involved in brain inflammation ··· 8
1. Glia ··· 9
(1) Microglia ··· 9
(2) Astrocytes ··· 10
2. Blood inflammaotry cells ··· 10
(1) Neutrophils ··· 10
(2) Monocytes ··· 11
C. Stimulatory insult of brain injury ··· 12
1. Adenosine-5'-triphosphate (ATP) ··· 12
2. Lipopolysaccharides (LPS) ··· 13
3. N-methyl-D-aspartic acid (NMDA) ··· 13
D. Aims of this study ··· 14
II. MATERIAL AND METHODS ··· 15
A. Animals ··· 15
B. Stereotaxic surgery and drug injection ··· 15
C. Systemic administration of LPS ··· 16
D. Tissue preparation ··· 16
E. Immunohistochemistry ··· 17
G. Electron Microscopy ··· 19
H. Reverse transcriptase PCR (RT-PCR) ··· 19
I. Quantitative real-time PCR (Q-PCR) ··· 20
J. Comparison of CD45 expression between primary microglia and blood monocytes ··· 20
K. Stereological analysis of dopaminergic neurons ··· 21
L. Measurement of impaired astrocytes area ··· 22
M. Counting of CD11b+ and Iba-1+ cells ··· 22
N. Terminal deoxynucleotidyl transferase-mediated deoxyuridine triphosphate nick end labeling (TUNEL) stain ··· 22
O. Microarray analysis ··· 23
P. Eriochrome Cyanine RC stain ··· 24
Q. Statistical Analysis ··· 25
III. RESULTS ··· 27
Part A. Inflammatory responses are not sufficient to cause delayed neuronal death in ATP-induced acute brain injury ··· 27
1. Time-dependent behavior of inflammatory cells in response to ATP injection · 27 2. Monocytes but not neutrophils infiltrate the ATP-injected brain ··· 36
3. Expression profiles of inflammatory mediators in ATP-injected SNpc ··· 43
4. Delayed neuronal death is barely detectable in the penumbra region where microglia are activated and monocytes infiltrate ··· 46
Part B. Blood monocytes infiltrate injured brain and participate in repair and
regeneration··· 57 1. Blood monocytes infiltrated injured SNpc ··· 57 2. Monocytes express repair/resolution-related genes ··· 63 3. Monocytes may repair the impaired astrocytes and endothelial cells and
neurons ··· 68 Part C. Systemic LPS administration induces brain inflammation but not
dopaminergic neuronal death in the substantia nigra ··· 73 1. Behavior of microglia and astrocytes in response to systemic administration
of LPS ··· 73 2. Neutrophils infiltrate the brain in response to systemic administration
of LPS ··· 77 3. Expression of pro-inflammatory mediators in response to systemic
administration of LPS··· 79 4. Effect of systemic administration of LPS on dopaminergic neuronal
Viability ··· 82 5. Effect of systemic inflammation on sublethal dose of NMDA-induced
dopaminergic neuronal injury ··· 85 IV. DISCUSSION ··· 88
Part A. Inflammatory responses are not sufficient to cause delayed neuronal death in ATP-induced acute brain injury ··· 98
Part B. Blood monocytes infiltrate injured brain and participate in repair and
regeneration ··· 92
Part C. Systemic LPS administration induces brain inflammation but not dopaminergic neuronal death in the substantia nigra ··· 94
V. SUMMARY AND CONCLUSION ··· 98
REFERENCE ··· 100
LIST OF FIGURES
Fig. 1. Dopaminergic neurons and microglia die in the SNpc by ATP injection ··· 29
Fig. 2. Dose-dependent death of dopaminergic neurons and microglia in the SNpc induced by ATP ··· 31
Fig. 3. Time-dependent behavior of Iba-1+ cells in ATP-injected SNpc ··· 33
Fig. 4. Behavior of Iba-1+ cells in PBS-injected SNpc ··· 35
Fig. 5. Ki-67+ immunoreactivity is detectable in ATP-injected SNpc, but not
colocalized in CD11b+ cells ··· 37
Fig. 6. Infiltration of monocytes in ATP-injected SNpc ··· 40
Fig. 7. ATP does not change CD45 expression levels in primary microglia
and blood monocytes ··· 41
Fig. 9. Expression of inflammatory mediators in ATP-injected SNpc ··· 45
Fig. 10. Delayed neuronal death is barely detectable in ATP-injected SNpc ··· 48
Fig. 11. TH+ dopaminergic neurons are healthy in the area where Iba-1+ cells
are morphologically activated in ATP-injected SNpc ··· 52
Fig. 12. Effect of ATP on behavior of neurons and Iba-1+ cells in the cortex ··· 53
Fig. 13. ATP induces IL-1β, but not iNOS in primary cultured microglia ··· 55
Fig. 14. No correlation between extent of brain damage and delayed neuronal
Death ··· 56
Fig. 15. Monocytes infiltrated in LPS-injected SNpc ··· 60
Fig. 16. Infiltrated monocytes showed morphological change from round to ramified and some of infiltrated monocytes underwent cell death
Fig. 17. Differential gene expression analysis in cDNA microarray data of
LPS-injected SNpc ··· 65
Fig. 18. mRNA expression of inflammatory mediators in LPS-injected SNpc ··· 66
Fig. 19. Expression of inflammatory mediators in infiltrated monocytes ··· 67
Fig. 20. Impaired astrocytes were recovered in LPS-injected SNpc ··· 70
Fig. 21. Ki-67+ immunoreactivity is detectable in LPS-injected SNpc and colocalized with GFAP+/vimentin+ astrocytes ··· 71
Fig. 22. Impaired endothelial cells and neurons were recovered in LPS-injected SNpc ··· 72
Fig. 23. LPS iv injection changes TNF-a levels in the plasma ··· 75
Fig. 24. Behavior of microglia and astrocytes in response to LPS iv injection ··· 76
Fig. 26. Expression of pro-inflammatory mediators in the brain in response to LPS iv injection ··· 80
Fig. 27. LPS iv injection does not influence dopaminergic neuronal viability ··· 83
Fig. 28. LPS iv injection did not induce dopaminergic neuronal death at 14 d ··· 84
Fig. 29. Examination of sublethal dose of NMDA in dopaminergic neuron viability 86
Fig. 30. Effect of systemic inflammation on the sublethal dose of NMDA-induced dopaminergic neuronal injury and neutrophil infiltration ··· 87
LIST OF TABLES
LIST OF ABBREVIATION
ATP, adenosine-5'-triphosphate AD, Alzheimer’s disease BBB, blood-brain barrier
BDNF, brain-derived neurotrophic factor CD68, cluster of differentiation 68 CFDA, carboxyfluorescein diacetate CNS, central nervous system COX-1, Cyclooxygenase-1 DAB, 3, 3'-diaminobenzidine DHEA, dehydroepiandrosterone ECRC, eriochrome cyanine RC
GAPDH, glyceraldehyde-3-phosphate dehydrogenase GFAP, glial fibrillary acidic protein
Iba-1, ionized calcium binding adaptor molecule 1 IFN-γ, interferon-gamma
IL-1β, interleukin-1beta IL-6, interleukin-6
iNOS, inducible nitric oxide synthase iv, intravenous
LAMP2, lysosomal-associated membrane protein 2 LPS, lipopolysaccharides
MAP2, microtubule-associated protein 2 MPO, myeloperoxidase
MR, mannose receptor MS, multiple sclerosis NeuN, Neuronal Nuclei NF-B, nuclear factor-kappaB NT-3, neutrophin-3
NO, nitric oxide
NMDA, N-methyl-D-aspartic acid PD, Parkinson’s diasease
PGE2, prostaglandins E2
Q-PCR, quantitative polymerase chain reaction ROS, reactive oxygen species
RT-PCR, reverse transcriptase polymerase chain reaction SI, systemic inflammation
SNpc, substantia nigra pars compacta SNr, substantia nigra reticulata
TGF-β1, transforming growth factor-beta 1 TH, tyrosine hydroxylase
TNF-α, tumor necrosis factor alpha
TUNEL, terminal deoxynucleotidyl transferase-mediated deoxyuridine triphosphate nick end labeling
I. INTRODUCTION
A. Brain inflammation
1. Brain inflammation
Brain inflammation accompanying injury is classically known to be mainly mediated by resident microglia, and inflammatory responses are harmful to surrounding neurons due to the cytotoxicity of mediators, such as nitric oxide (NO) and tumor necrosis factor alpha (TNF-α) (Chao et al., 1992; Giulian et al., 1993; Kitamura et al., 1996; de Bock et al., 1998; Scali et al., 2000; Choi et al., 2003; Ryu et al., 2004; Kaushal and Schlichter, 2008), suggesting that the brain inflammation could accelerate the onset and progession of neurodegenerative disease, such as Parkinson’s disease (PD), Alzheimer’s disease (AD), and Multiple sclerosis (MS) (Breitner, 1996; Sheng et al., 1998; in 't Veld et al., 2002; Chen et al., 2003; Raivich and Banati, 2004; Klegeris and McGeer, 2005; Esposito et al., 2007; Perry et al., 2007; Samii et al., 2009).
For several decades, brain has been regarded as an immune privileged site since blood-brain barrier (BBB) limits the entry to the brain of large molecules and circulating cells in the blood, which makes brain resistant to immune reactions and unaffected by systemic inflammatory. Recently, however, the classical concept has been challenged. Many studies reported that the permeability of BBB could be changed in injured brain and the brain responds to peripheral inflammatory stimuli. Thus, peripheral inflammation acutely induces brain inflammatory responses, which in turn contribute to not only acute but also chronic central nervous diseases (Petty and Lo, 2002; Perry et al., 2007; Holmes et
al., 2009). In addition, several studies reported that neutrophils and/or monocytes infiltrate traumatic, ischemic, and lipopolysaccharides (LPS)-injected brain and that neutrophils rather than microglia express neurotoxic inducible nitric oxide synthase (iNOS) and TNF-α (Hallenbeck et al., 1986; Schoettle et al., 1990; Kochanek and Hallenbeck, 1992; Matsuo et al., 1994; Zhang et al., 1995; Connolly et al., 1996; del Zoppo et al., 2000; Matsumoto et al., 2007; Ji et al., 2007; Ji et al., 2008; Gautier et al., 2009). Therefore, brain inflammation appears to be a complex process played by blood inflammatory cells as well as microglia.
Recently, a novel concept about brain inflammation is emerging. Several studies have reported that brain inflammation could be a process to regenerate microenvironment of the brain. Microglia/macrophages phagocyte dying cells and debris, and produce neurotrophic factors, such as transforming growth factor-beta1 (TGF-β1), neutrophin-3 (NT-3), and brain-derived neurotrophic factor (BDNF) (Elkabes et al., 1996; Lehrmann et al., 1998; Batchelor et al., 1999; Streit, 2002; Streit, 2005). In this point of view, brain inflammation could be neuroprotective rather than neurotoxic.
2. Effect of brain inflammation on acute brain injury degenerative disease (1) Brain inflammation on acute brain injury
Acute brain injuries such as ischemia and trauma are rapid and severe insults to the brain that lead to substantial loss of neuronal cells with associated functional defect. These acute injuries exhibit increased glutamate release (excitotoxicity), oxidative stress and disturbances in ionic homeostasis. The animal models that mimic these clinical conditions exhibited the activation or invasion of inflammatory cells (e.g. microglia, leukocytes) and
increased expression of inflammatory mediators (e.g. cytokines, chemokines, complement) in central nervous system (CNS) (Hallenbeck et al., 1986; Schoettle et al., 1990; Kochanek and Hallenbeck, 1992; Matsuo et al., 1994; Zhang et al., 1995; Connolly et al., 1996; del Zoppo et al., 2000; Bohatschek et al., 2001; Matsumoto et al., 2007; Ji et al., 2007; Ji et al., 2008; Gautier et al., 2009).
(2) Brain inflammation on neurodegenerative disease
In chronic CNS diseases, environmental factors and genetic background that contribute to the development and progression of the disease (Campbell, 2004) also influence on CNS inflammation, which is further aggravated by aging. Many inflammatory mediators increase in chronic neurodegenerative diseases, in which activation of microglia leads to production of cytokines, superoxide radicals, NO and components of the complement system.
Multiple sclerosis (MS) is a chronic autoimmune disease that activated T cells invade the CNS and injure the myelin sheaths surrounding axons, in which result in loss of neuronal function and death. In the animal model of MS, many inflammatory mediators are upregulated, such as iNOS, complement, and interleukin-1betaIL-1β), IL-12 and TNF-α, Cyclooxygenase-1 (COX-1) (Raivich and Banati, 2004) that these mediators are also detected in the MS patients.
In the Alzheimer’s disease (AD), the activated microglia surround the amyloid plaques are one of the hallmarks of the disease (Sheng et al., 1998). These activated microglia produce and release cytokines, such as IL-1, IL-6 and TNF-α, and chemokines,
leading to monocytes migration across the BBB. And then IL-1 and TNF-α can increase expression of amyloid precursor protein and Aβ peptide (Blasko et al., 2000; Liao et al., 2004). These results indicate that the CNS inflammation could participate in the progression of the AD.
Parkinson’s disease (PD) is a neurodegenerative disorder that is characterized by degeneration of dopaminergic neurons in the substantia nigra pars compacta (SNpc), resulting in movement disorder (Gelb et al., 1999). In the sporadic PD, many environmental factors including pesticides and infections may contribute to the onset and progression of disease. Brain inflammation is regarded as a risk factor of PD, in which the expression levels of pro-inflammatory cytokines in PD brains are higher than in control brains (Mogi et al., 1994; Blum-Degen et al., 1995; Muller et al., 1998; Knott et al., 2000; Nagatsu and Sawada, 2005; Whitton, 2007). Microglia (brain macrophages) are activated in post-mortem PD brains (McGeer et al., 1988; Croisier et al., 2005) and many experimental models of PD (Liberatore et al., 1999; Dehmer et al., 2000; Cicchetti et al., 2002; Wu et al., 2002; Sriram et al., 2006; Vijitruth et al., 2006). Furthermore, administration of inhibitors of microglial activation (e.g. naloxone, minocycline) is neuroprotective in animal models of PD (Lu et al., 2000; Liu et al., 2000; Du et al., 2001; Wu et al., 2002). Although most (90–95%) cases of PD are sporadic in nature, mutations in genes such as those encoding α-synuclein, parkin, PINK1, DJ-1, LRRK2, and Htra2 are found in familial PD patients (Klein et al., 2005; Klein and Schlossmacher, 2006; Thomas and Beal, 2007). However, animals carrying mutations in or knock-outs of these PD-related genes rarely show PD-like symptoms or dopaminergic neuronal loss (Rockenstein
et al., 2002; Goldberg et al., 2003; Itier et al., 2003; Von Coelln et al., 2004; Chen et al., 2005; Zhu et al., 2007). These findings indicate that abnormal function of PD-related genes is not enough to cause PD. Thus, certain microenvironmental factors such as brain inflammation have been suggested to be important in causation and/or aggravation of neurodegenerative diseases including PD (Herrera et al., 2000; Gao et al., 2002).
(3) Role of the brain inflammation in the injured brain
A key question to consider the role of brain inflammation is whether it is detrimental or beneficial in the CNS. In the healthy brain, most of inflammatory mediators have relatively few actions and are expressed at very low level. However, they are rapidly upregulated in response to tissue injury or infection, and exert diverse actions.
Pro-inflammatory cytokines are known as prominent mediators of tissue damage and inflammation in the pathogenesis of many neurodegenerative diseases, such as ischemia, trauma, MS, AD, PD (Rothwell and Luheshi, 2000; Allan and Rothwell, 2001). Increased expression of IL-1 in CNS injury is observed in both experimental and clinical cases and administration of exogenous IL-1 to animal in the condition of ischemic and excitotoxic challenge dramatically increase cell death. Furthermore, central or systemic administration of IL-1 receptor antagonist (IL-1ra) markedly reduces the extent of cell death induced by ischemic, traumatic or excitotoxic injury in the animal models and inhibition of IL-1 by inhibiting release of IL-1 with caspase-1 inhibitors, caspase-1 deficient mice and anti-IL-1 neutralizing antibody, reduces the injury (Rothwell and Luheshi, 2000; Allan and Rothwell, 2001). On the other hand, IL-1β promotes
remyelination in the adult CNS. IL-1β-/- mice failed to remyelinate properly, and this appeared to correlate with a lack of insulin-like growth factor-1 production by microglia/macrophages and astrocytes and to a profound delay of precursors to differentiate into mature oligodendrocytes (Mason et al., 2001). IL-1β also affect upregulation of growth factors such as ciliary neurotrophic factor and nerve growth factor in traumatic injury (Herx et al., 2000; De Kosky et al., 1996).
In addition, TNF-α is known as a central mediator in the brain injury (Powell et al., 1990; Selmaj et al., 1991; Selmaj and Raine, 1995). However, TNF-α also have protective role. For example, systemic blockade of TNF-α in MS patients using a soluble TNF-α receptor protein, or anti-TNF-α neutralizing antibody, led to immune activation and increase in disease activity (Mohan et al., 2001; The Lenercep Group, 1999; van Oosten et al., 1996). Furthermore, in TNF-deficient mice, myelin-specific T cell reactivity fails to regress and expansion of activated/memory T cells is abnormally prolonged, leading to exacerbated experimental autoimmune encephalomyelitis (Kassiotis and Kollias, 2001). These findings indicate that TNF exhibits potent immunosuppressive properties and enhance repair and recovery processes in the injured brain.
Interferon-gamma (IFN-γ) that promote inflammatory responses also act as a protective factor in the animal models of autoimmunity (Billiau et al., 1988; Duong et al., 1992). Since the several inflammatory cytokines have dual role, cytokines-mediated brain inflammation could play both detrimental and beneficial roles in injured brain. Therefore, it is important to consider the overall balance between pro-inflammatory and anti-inflammatory mediators after injury.
3. Regulation of brain inflammation (1) Host defense system
Inflammation is generally a principal host defense response to injury, tissue ischemia, autoimmune response or infectious agents, in which limit the survival and proliferation of invading pathogens, promote tissue survival, repair and recovery, and conserve the energy of the organism. However, sustained, excessive or inappropriate inflammation is the cause of the diseases such as rheumatoid arthritis, inflammatory bowel disease. Thus, pro-inflammatory responses that upregulate inflammation need to appropriately balance with anti-inflammatory response that down-regulate inflammation.
Inflammation is characterized by recruitment of blood leukocytes from the blood stream, activation of tissue macrophages, and production of a series of mediators, such as cytokines, chemokines, and lipid mediators in which it neutralize and eliminate potentially injurious stimuli.
(2) Resolution of inflammation
After upregulation of acute inflammation, inflammatory responses finally result in the resolution of the inflammatory process, triggering events that lead to cell regeneration and wound healing.
Resolution of inflammation is thought to be return to the basal level of the normal condition (Homeostasis). After injury, the released inflammatory mediators evoke leukocyte chemotaxis into tissue. During resolution of acute inflammation, the neutrophils were withdrawn from tissues after their infiltration and involvement in host defense.
Subsequently, mononuclear cells are play a key role in tissue repair and eventually lost from the tissue and are not found in tissue sections following neutralization of the insult. In addition, several distinct biochemical pathways also are actively turned on during inflammation in the resolution phase (Serhan, 2004), in which anti-inflammatory cytokines, lipid mediators, resolvins, docosatrienes, and neuroprotectins, and their aspirin-triggered counterparts were involved in resolution.
(3) Regulation of brain inflammation
In brain inflammation, glial cells such as microglia and astrocytes have been known to serve as immune cells. After infection or injury, these glial cells mediate brain inflammation, showing morphological activation and production of inflammatory mediators, such as cytokines, chemokines, NO, reactive oxygen species (ROS). Although BBB tightly regulate microenvironment in healthy CNS, inflammatory cytokines can cross BBB, probably either by active transport or through leaky regions of endothelial cells when BBB is compromised by a pathological condition. Thus, the CNS can be affected not only by inflammatory mediators produced within the brain, but also through the actions of mediators originating from the periphery. Moreover, many studies reported the blood inflammatory cells infiltrate into the brain and contribute to brain inflammation. Once the harmful stimuli are eliminated, the resolution and repair system may be turned on, in which it is mediated mainly by tissue-resident or recruited macrophages/monocytes.
1. Glia (1) Microglia
Microglia (brain macrophages) are one of glial cells and are known as the major inflammatory cells in the CNS. Recently, microglia, belong to the mononuclear phagocyte lineages, are believed to be derived from hematogenous monocytes or other precursors that originate within the bone marrow (Lawson et al., 1992; Gordon and Taylor, 2005; Ladeby et al., 2005; Hanisch and Kettenmann, 2007). Resting microglia show a downregulated immunophenotype adapted to the specialized microenvironment of the CNS (Ladeby et al., 2005). In the healthy CNS, the resting microglia play an important role by monitoring and clearance of brain environment (Kakimura et al., 2002; Rogers et al., 2002; Davalos et al., 2005; Haynes et al., 2006; Wake et al., 2009). Following brain injury, microglia rapidly activate by showing morphological change and production of pro-inflammatory mediators (Kreutzberg, 1996; Raivich et al., 1999; Davalos et al., 2005; Hanisch and Kettenmann, 2007), indicating initiation of brain inflammation. Many studies showed that cultured microglia challenged with LPS and IFN-γ produce neurotoxic inflammatory mediators including iNOS (Liu et al., 2000; Possel et al., 2000; Min et al., 2006).
However, several in vivo studies suggest that microglia rarely express pro-inflammatory mediators and neurotoxic agents (Matsumoto et al., 2007; Ji et al., 2007). Furthermore, microglia have neuroprotective potency in brain inflammation, in which microglia/macrophages phagocyte dying cells and debris, and produce neurotrophic factors, such as TGF-β1, NT-3, and BDNF (Elkabes et al., 1996; Lehrmann et al., 1998; Batchelor et al., 1999; Streit, 2002; Streit, 2005).
(2) Astrocytes
Astrocytes are ubiquitous and abundant glial cells in the brain, in which they are complex, highly differentiated cells that cover the entire CNS in a contiguous fashion. Astrocytes importantly contribute to numerous normal function in the healthy CNS, such as regulation of blood flow, supply of energy metabolites to neurons, participation in synaptic function and plasticity, and maintenance of the extracellular balance of ions, fluid balance and transmitters (Nedergaard et al., 2003; Pellerin et al., 2007;Barres, 2008).
In addition, astrocytes respond to CNS insults such as infection, trauma, ischemia and neurodegenerative disease by a process commonly referred to as reactive astrogliosis, which involves changes in their molecular expression and morphology, and in severe cases, scar formation (Sofroniew, 2009). In CNS injury, the function of reactive astrocytes and their roles in specific disease processes are largely uncertain. However, some studies reported that astrocytes inhibit microglial activities that suppress expression of iNOS (Vincent et al., 1997; Pyo et al., 2003; Min et al., 2006). Furthermore, astrocytes could produce anti-inflammatory factors such as dehydroepiandrosterone (DHEA) and prostaglandins E2 (PGE2) (Zwain and Yen, 1999; Molina-Holgado et al., 2000; Taniura et al., 2002). DHEA inhibits the activation of nuclear factor-kappaB (NF-κB) induced by TNF-α (Altman et al., 2008) whereas PGE2 decreases Akt activation and the nuclear translocation of NF-κB (Shi et al., 2010).
2. Blood inflammatory cells (1) Neutrophils
Neutrophils are the most abundant type of white blood cells in mammals and have a pivotal role in the defense against bacterial infections because of their large store of proteolytic enzymes and rapid production of ROS. In spite of defense mechanism, these lytic factors or pro-inflammatory mediators elicit local tissue damage.
Neutrophils are recruited to the injured brain, such as LPS-injected, ischemic and traumatic brains and express neurotoxic iNOS and TNF-α (Hallenbeck et al., 1986; Schoettle et al., 1990; Kochanek and Hallenbeck, 1992; Matsuo et al., 1994; Zhang et al., 1995; Connolly et al., 1996; del Zoppo et al., 2000; Bohatschek et al., 2001; Matsumoto et al., 2007; Ji et al., 2007; Ji et al., 2008; Gautier et al., 2009), and induce delayed neuronal damage (Zhang et al., 1995; Connolly et al., 1996; Ji et al., 2007; Ji et al., 2008). Furthermore, neutrophil depletion reduces brain injury in these conditions (Matsuo et al., 1994; Zhang et al., 1995; Ji et al., 2008; Ryu et al., 2007).
(2) Monocytes
Monocytes are one type of white blood cells and produced by the bone marrow. Monocytes which migrate from the bloodstream to other tissues will then differentiate into tissue resident macrophages or dendritic cells. In response to inflammation signals, monocytes move to the sites of infection in the tissues and divide/differentiate into macrophages to elicit the immune responses, such as phagocytosis, antigen presentation and cytokine production. In systemic inflammation, several studies reported that monocytes play critical roles in healing processes (Leibovich and Ross, 1975; Kotter et al., 2005; van Amerongen et al., 2007). Monocytes express growth factors (e.g. PDGF, and
VEGF) (Shimokado et al., 1985; Xiong et al., 1998), and remove damaged cells and debris (Leibovich and Ross, 1975; Giulian et al., 1989; Mitchell et al., 1992; van Amerongen et al., 2007). In accordance with these results, it has been reported that healing process was significantly delayed in monocytes-depleted animal models (Leibovich and Ross, 1975; Kotter et al., 2005; van Amerongen et al., 2007).
Monocytes also infiltrate to the site of injury in injured brain, such as LPS-injected, ischemic and traumatic brains (Giulian et al., 1989; Garcia et al., 1994; Riva-Depaty et al., 1994; Campanella et al., 2002; Ji et al., 2007; Ji et al., 2008). Although activated monocytes were known to produce both pro-inflammatory and anti-inflammatory cytokines, the roles of monocytes are largely uncertain in the pathological brain.
C. Stimulatory insult of brain injury
1. Adenosine-5'-triphosphate (ATP)
ATP has been considered an endogenous factor that induces neuronal damage and inflammatory responses. Under some pathological conditions, such as ischemia and hypoxia, the extracellular ATP level rises due to release from damaged cells (Cavaliere et al., 2001a; Cavaliere et al., 2001b; Kharlamov et al., 2002; Melani et al., 2005). ATP directly induces neuronal death (Amadio et al., 2002). ATP also activates microglia: microglia rapidly move their processes towards ATP (Davalos et al., 2005), and produce IL-1β, TNF-α, and ROS in response to ATP (Hide et al., 2000; Sanz and Virgilio, 2000; Inoue, 2002; Parvathenani et al., 2003). Furthermore, blocking of ATP receptors reduces brain injury (Cavaliere et al., 2001a; Cavaliere et al., 2001b; Kharlamov et al., 2002;
Melani et al., 2006). Thus, ATP is a suitable insult to mimic in vivo brain injury.
2. Lipopolysaccharides (LPS)
LPS that are large molecules consisting of a lipid and a polysaccharide and found in the outer membrane of Gram-negative bacteria, act as endotoxins and elicit strong immune responses in animals. When glial cells are exposed to LPS, they produce several inflammatory mediators, such as NO, ROS, TNF-α, IL-1β (Liu et al., 2000; Possel et al., 2000; Pyo et al., 2003). Especially, NO induced neurotoxicity in neuron-glia cultures (Chao et al., 1992; Dawson et al., 1994; Jeohn et al., 2000). LPS in vivo injection also induced NO production (Kitamura et al., 1996; Ji et al., 2007). Contrary to in vitro system, infiltrated neutrophils rather than microglia express neurotoxic iNOS and TNF-α (Ji et al., 2007), and induce delayed neuronal damage in LPS-injected brain (Ji et al., 2008).
3. N-methyl-D-aspartic acid (NMDA)
NMDA is an acidic amino acid capable of inducing excitotoxic damage which acts as a specific agonist at the NMDA receptor. Because of its structural similarity, NMDA can mimic the action of glutamate that is major excitatory transmitter in the brain. Abnormally intense exposure to glutamate and structurally related excitatory amino acids can destroy neurons, in which excitotoxicity has been linked with glutamate-elicited Ca2+ influx (Choi, 1987; Hartley et al., 1993; Eimerl and Schramm, 1994). Moreover, excitotoxicity may be involved in spinal cord injury, stroke, traumatic brain injury and neurodegenerative diseases such as MS, AD, PD.
D. Aims of this study
Brain inflammation accompanying injury mainly has been known to elicit further neurotoxicity. However, evidences from recent studies bring up the question whether brain inflammation is really harmful to the surrounding neurons in the brain. The controversial concept could be due to different experimental designs. Since many studies have been performed using cultured microglia and neurons, it has not been possible to assess the influence of several types of cells and diverse factors that could dynamically and continuously change environment of the brain in vivo. Furthermore, behavior of microglia and other inflammatory cells may have been overlooked since most studies have focused on neuronal death. Therefore, it is essential to analyze behavior and roles of microglia and blood inflammatory cells in the injured brain, and determine their contribution to neuronal damage
in vivo from the early stage of injury. For these specific aims,
1. I generated acute brain injury model by the injection of ATP into the SNpc (Parkinson’s disease-related brain area) and the cortex, and investigated inflammatory processes and their effects on neuronal damage.
2. I investigated the roles of monocytes in repair/resolution in injured brain.
3. I investigated how systemic inflammation affected brain inflammation, and whether systemic inflammation caused neuronal toxicity.
II. MATERIAL AND METHODS
A. Animals
Male Sprague Dawley (SD) rats were used. All experiments were performed in accordance with the approved animal protocols and guidelines established by the Ajou University School of Medicine Ethics Review Committee for animal experiments, and all animal work was approved by the Ethical Committee for Animal Research of Ajou University (Amc-28).
B. Stereotaxic surgery and drug injection
SD rats (230-250 g, 7 w) were anesthetized by injection of ketamine (40-80 mg/kg) and xylazine (5-10 mg/kg), and positioned in stereotaxic apparatus (David Kopf Instruments, Tujunga, CA). ATP (10-1000 nmol in 2 μl sterile PBS; Sigma, St. Louis, MO) was unilaterally administered into the right SNpc (AP, -5.3 mm; ML, -2.3 mm; DV, -7.6 mm from bregma) and cortex (AP, +0.7 mm; ML, -2.0 mm; DV, -2.0 mm from bregma), according to the atlas of Paxinos and Watson (Paxinos and Watson, 2005). NMDA (1-30 nmol in 2 μl sterile PBS) and LPS (5 μg in 2 μl sterile PBS) were also unilaterally administered into the right SNpc. All animals were injected using a Hamilton syringe equipped with a 30-gauge blunt needle to minimize mechanical damage attached to a syringe pump (KD Scientific, New Hope, PA). The drugs were infused at a rate of 0.4 µl/min. After injection, the needle was held in place for an additional 5 min before removal.
PBS-injected animals or contralateral sides were used as control.
C. Systemic administration of LPS
SD rats(230-250 g, 7 w) were anesthetized by intraperitoneal injection of ketamine (40-80 mg/kg) and xylazine (5-10 mg/kg). LPS (100-500 μg in 250 μl aliquots of sterile PBS) was administered through the tail vein. PBS-injected animals were used as controls.
D. Tissue preparation
Rats were anesthetized and transcardially perfused with saline solution containing 0.5 % sodium nitrate and heparin (10 U/ml), followed by 4 % paraformaldehyde in 0.1 M phosphate buffer, pH 7.2, for tissue fixation. Brains were obtained and post-fixed overnight at 4 °C in 4 % paraformaldehyde. Fixed brains were stored at 4 °C in 30 % sucrose solution until they sank. Six separate series of 30 m coronal brain sections (50 μm for stereological counting) were obtained with a sliding microtome (Microm, Walldorf, Germany). For RNA preparation, rats were anesthetized and transcardially perfused with saline solution without prarformaldehyde. Brains were obtained and sliced with Rat Brain Slicer Matrix (1.0 mm slice intervals, RBM-4000C, ASI Instruments, Warren, MI) and a razor blade. The slice including the needle injection spot was selected, and tissue blocks (2 × 2 × 2 mm3) just below the needle tip were collected, and stored at -70 °C until use.
For 3, 3'-diaminobenzidine (DAB) staining, serial sections were rinsed three times with PBS, treated with 3 % H2O2 for 5 min, and rinsed with PBS containing 0.2 % Triton X-100 (PBST). Non-specific binding was blocked with 1 % BSA in PBST. Sections were incubated overnight at room temperature with primary antibodies against CD11b (OX-42; 1:200 dilution; Serotec, Oxford, UK), CD45 (1:200; AbD Serotec, Oxford, UK), cluster of differentiation 68 (CD68; 1:200; AbD Serotec, oxford, UK), Glial fibrillary acidic protein (GFAP; 1:300; Sigma, St. Louis, MO), IL-1 (1:200; R&D systems, MN), iNOS (1:200; Abcam, Cambridge, UK), ionized calcium binding adaptor molecule 1 (Iba-1; 1:1000; Wako Pure Chemical Industries, Osaka, Japan), Ki-67 (1:100; Abcam, Cambridge, UK), lysosomal-associated membrane protein 2 (LAMP2; 1:100; Sigma, St. Louis, MO), Mannose receptor (MR; 1:200; Abcam, Cambridge, UK), microtubule-associated protein 2 (MAP2; 1: 1000; Sigma, St. Louis, MO), myeloperoxidase (MPO; 1:1000; Dako, Glostrup, Denmark), Neuronal Nuclei (NeuN; 1: 300; Chemicon, CA, USA), Rat Blood-Brain Barrier (SMI 71; EBA; 1:200; Sternberger Monoclonals Inc., Lutherville, MD, USA), tyrosine hydroxylase (TH; 1:2000; Pelfreeze Biologicals, Rogers, AR), or vimentin (1: 200; Chemicon, Temecula, CA, USA). Following rinsing in PBST, sections were incubated with biotinylated secondary antibodies (Vector Laboratories, Burlingame, CA) for 1 h and the avidin/biotin system (Vector Laboratories, Burlingame, CA) for 1 h and visualized using DAB solution (0.05 % DAB and 0.003 % hydrogen peroxide in 0.1 M PB). For double-labeling with TH and Iba-1, sections were stained with TH antibody following the above procedure, and visualized with DAB (brown products). And then, same sections were washed in PBS, blocked with 1 % BSA, incubated with Iba-1 antibody,
and visualized using DAB/nickel sulfate solution (dark purple products) according to the manufacturer’s guidance. Next, sections were mounted on gelatin-coated slides, and examined under a bright field microscope (Olympus Optical, BX51, Tokyo, Japan). Bright field images were obtained using PictureFrame Application 2.3 software. For immunofluorescence staining, sections were washed twice in PBS, treated with 1 % BSA, and incubated with combinations of antibodies against Iba-1, iNOS, IL-1, CD68, CD11b, CD45, Ki67, TH and NeuN. Visualization was performed with Alexa Fluor488- or Alexa Fluor555- conjugated secondary antibodies (1:600; Invitrogen, Eugene, OR, USA). DAPI (Vector Laboratories, Burlingame, CA) was used to detect nuclei. Sections were analyzed under a confocal microscope (Carl Zeiss, Germany) with 40× water and 63× oil immersion objectives at 20 °C, and images were captured using Confocal software (LSM Image Browser).
F. Monocytes isolation and transplantation
Rat blood monocytes were isolated by density gradient centrifugation (Lehner and Holter, 2002) using endotoxin-free Ficoll-Paque PLUS (GE Healthcare, Uppsala, Sweden). Briefly, blood was mixed with 2.5 % dextran in PBS (blood: dextran solution, 1:4) for 1 h at RT. The plasma layer was loaded onto Ficoll, and centrifuged at 400 × g for 30 min. The monocytes layer displaying a white band at the interface was carefully collected and washed 3 times with PBS. Then, monocytes were stained with 10 M carboxyfluorescein diacetate (CFDA)-SE for 10 min at 37 °C. Cells were washed 3 times with PBS, resuspended in PBS. CFDA-labeled monocytes (1 × 10⁸ cells/ 300 µl) were transplanted
through the tail vein at 12 h after ATP injection into the SNpc. Rats were sacrificed 2 d after ATP injection.
G. Electron Microscopy
At 3 h after ATP injection, brains were obtained and sliced (1.0 mm slice) with Rat Brain Slicer Matrix and a razor. ATP-injected SNpc tissue blocks (smaller than 1 × 1 × 1 mm3) were collected and post-fixed overnight at 4 °C using Karnovsky’s fixative solution (2 % paraformaldehyde, 2 % glutaraldehyde, 0.5 % calcium chloride in cacodylate buffer, pH 7.2), washed with cacodylate buffer, dehydrated in a series of graded ethanol washes, and embedded in Epon mixture. Semi-thin (1 m thickness) sections were cut and stained with toluidine blue for examination under a light microscope to determine tissue orientation. Ultrathin sections (70-80 nm)were obtained using a Reichert Jung Ultracut S microtome (Leica, Vienna, Austria), mounted on grids, stained with uranyl acetate and lead citrate, and analyzed under a Zeiss EM 902 A electron microscope (Leo, Oberkohen, Germany).
H. Reverse transcriptase PCR (RT-PCR)
Total RNA was isolated using an easy-BLUE RNA Extraction Kit (iNtRON, Sungnam, Korea), and cDNA was prepared using Reverse Transcription Master Premix (ELPisbio, Taejeon, Korea), according to the manufacturers’ instructions. RT-PCR was performed using specific primers specific, as shown in Table 1. The amplified products were separated by electrophoresis on a 1.5 % agarose gel and detected under UV light.
Band intensities were analyzed using Quantity One 1-D analysis software, v 4.6.5 (Bio-Rad Laboratories, Inc., CA, USA).
I. Quantitative real-time PCR (Q-PCR)
Total RNA was isolated using an easy-BLUE RNA Extraction Kit (iNtRON, Sungnam, Korea), and cDNA was prepared using Reverse Transcription Master Premix (ELPisbio, Taejeon, Korea), according to the manufacturers’ instructions. For Q-PCR, approximately 50 ng cDNA was analyzed using a KAPA SYBR FAST qPCR Kit (KAPA Biosystems, Boston, MA) and a Corbett Rotor-Gene 6000 real-time rotary analyzer (Corbett Research, Mortlake, NSW, Australia). Specific primers are shown in Table 1. Q-PCR conditions were as follows: 95 °C for 30 sec, followed by 40 cycles of 95 °C for 3 sec (denaturation), 55 °C for 20 sec (annealing), and 72 °C for 3 sec (elongation). For TNF-, the annealing conditions were modified to include a 63-59 °C touch-down protocol, decreasing temperature by 0.5 °C per cycle for the first 8 cycles.That a single product was amplified under the conditions used was confirmed by performing a melting curve analysis for each primer pair, using a melt ramp of 72-95 °C and raising the temperature by 1 °C at each step (5 sec/step). Amplified products were also verified by electrophoresis on 1.5 % agarose gels with GelRed (Biotium, USA) staining. Results were normalized to glyceraldehyde-3-phosphate dehydrogenase (GAPDH), used as a reference.
Primary microglia were cultured from the cerebral cortices of 1- to 3-d-old SD rats as described previously (Giulian and Baker, 1986; Pyo et al., 1998). Briefly, cortices were triturated into single cell in minimal essential media (MEM) (Sigma) containing 10 % fetal bovine serum (FBS) (JBI, Taegu, Korea), plated in 75 cm2 T-flasks (0.5 hemisphere/flask), and incubated for 2 wks. Microglia were detached from the flasks by mild shaking and filtered through a nylon mesh to remove astrocytes and cell clumps. Microglia were suspended in MEM containing 5 % FBS and stained with 10 μM CFDA-SE for 10 min at 37 °C. CFDA-labeled primary microglia were washed 3 times with PBS and resuspended in DMEM containing 10 % FBS. Blood monocytes were prepared as described previously and mixed with CFDA-labeled primary microgila in DMEM containing 10 % FBS. Mixed monocytes and primary microglia were treated with ATP (100 μM/ml) in DMEM containing 10 % FBS for 12 h at 37 °C. Control culture was incubated in only DMEM containing 10 % FBS for 12 h. After 12 h, the mixed cell cultures were washed with PBS and fixed with 100 % cold methanol at -20 °C for 30 min. The fixed cells were washed with PBS and incubated with 1 % BSA for 30 min. The cells were then incubated overnight at room temperature with an anti-CD45 antibody (1:200; AbD Serotec, oxford, UK), washed with PBS. The cells were visualized with Texas red-conjugated secondary antibodies (1:200; Vector Laboratories, Burlingame, CA, USA) under a confocal microscope. DAPI was used to detect nuclei.
C
oronal brain sections (50 μm) were obtained and stained with TH antibody. The number of TH+ neurons in the entire SNpc was counted under a bright field microscope (Olympus Optical, BX51, Tokyo, Japan) using Stereo Investigator software (MBF Bioscience, Williston, VT). Counting frames (100 μm × 100 μm) were randomly placed on the SNpc, and TH+ neurons counted under a 40× objective.L. Measurement of astrocyte-damage area
Every sixth brain sections in whole SN regions (bregma AP , - 4.3 ~ - 6.5 mm) were stained with anti-GFAP antibodies. Every third sections were sorted out from GFAP-stained serial sections at 1~14 d after LPS injection and GFAP-negative areas were measured on 4x images using Axiovision image analysis software (version 4.7.2; Zeiss).
M. Counting of CD11b+ and Iba-1+ cells
The most damaged section from each animal was selected and stained with anti-CD11b or Iba-1. Cells in 2-3 regions (1 × 105 μm2) from each section close to the needle tract were counted on 20 x images. Results are presented as means ± SEM of 18-24 regions from 6 to 8 animals.
N. Terminal deoxynucleotidyl transferase-mediated deoxyuridine triphosphate nick end labeling (TUNEL) stain
The amount of apoptotic cells was determined by double-staining with TUNEL and Iba-1 antibody. TUNEL assays were performed using the Apoptag fluorescein in situ
detection kit (Intergen, Purchase, NY) that detects the 3’-OH region of cleaved DNA during apoptosis. Briefly, brain sections were post-fixed in pre-cooled permeabilization solution (ethanol: acetic acid, 2:1) for 5 min. After addition of the TUNEL reaction mixture, sections were incubated in a humidified chamber for 1 h at 37 °C, and washed in PBS. Brain sections were treated with Iba-1 antibody for 2 h and washed in PBS, followed by Texas Red-labeled secondary antibodies.
O. Microarray analysis
Sample preparation and labeling: Total RNA was extracted using RNeasy mini kit
(74104, Qiagen) and assessed for quantity and quality with UV spectrometer and RNA gel electroporesis. RNA was labeled and hybridized to a GeneChip according to Standard Affymetrix Protocols (GeneChip Whole Transcript Sense Target Labeling Assay Manual, Version 4). Affymetrix GeneChip Rat Gene 1.0 ST Arrays were used in this study, and their characteristics are detailed at http://media.affymetrix.com/support/downloads/ package_inserts/ragene_1_st_insert.pdf. Each reaction involving a single GeneChip hybridization was started with 200 ng RNA. cDNA and cRNA were generated using GeneChip WT cDNA Synthesis and Amplification Kit (900673, Affymetrix), and clean-up of cRNA was proceeded using GeneChip IVT cRNA Cleanup Kit (900547, Affymetrix). After 2nd cDNA synthesis, cRNA was hydrolyzed by RNase H treatment and then, biotin-labeled sense strand DNA fragments was generated using GeneChip WT Terminal Labeling Kit (900671, Affymetrix).
biotin-labeled DNA fragments (referred to as the "target") and hybridization controls. The target was then hybridized to the GeneChip array in GeneChip Hybridization Oven 640 during a 16-hour incubation. Immediately following hybridization, the array was washed and stained with streptavidin phycoerythrin conjugate using an automated protocol on the GeneChip Fluidics Station 450, followed by scanning on a GeneChip Scanner 3000 (7G). The GeneChip Hybridization, Wash, and Stain Kit (900720, Affymetrix) was used in this procedure.
Data measurement and analysis: An Affymetrix GeneChip scanner operated by
GeneChip Operating Software (GCOS ver1.4; Affymetrix) was used to generate original array images. The average difference of each probe set, which is a measure of the relative abundance of a transcript, and signals and detection calls such as present or absent were computed by GCOS. Data analysis was used Silicon Genetics Genespring 10.1 Software.
P. Eriochrome Cyanine RC stain
Eriochrome cyanine RC (ECRC) stain was used to visualize myelin. Brain sections were mounted on slides and air-dried overnight at room temperature. After dehydration and rehydration in graded ethanol solutions, brain sections were stained with ECRC Solution (0.2% eriochrome cyanine RC, Sigma, St. Louis, MO; 0.5% H2SO4 in distilled water; boiled for 5 min) for 10 min. ECRC-stained sections were rinsed in running tap water for 10 min, placed in fresh 1 % NH4OH for 30 s and rinsed in fresh distilled water for 2 min. After dehydration, brain sections were treated with xylene for 5 min and coverslipped with Permount (Fisher Scientific Co., Morris Plains, New Jersey, USA).
Q. Statistical Analysis
Statistical data are expressed as means ± SEMs. The significance of between-group differences was analyzed using the one-way ANOVA tool in the Statistical Package for Social Sciences, version 12 (SPSS, Chicago, IL).
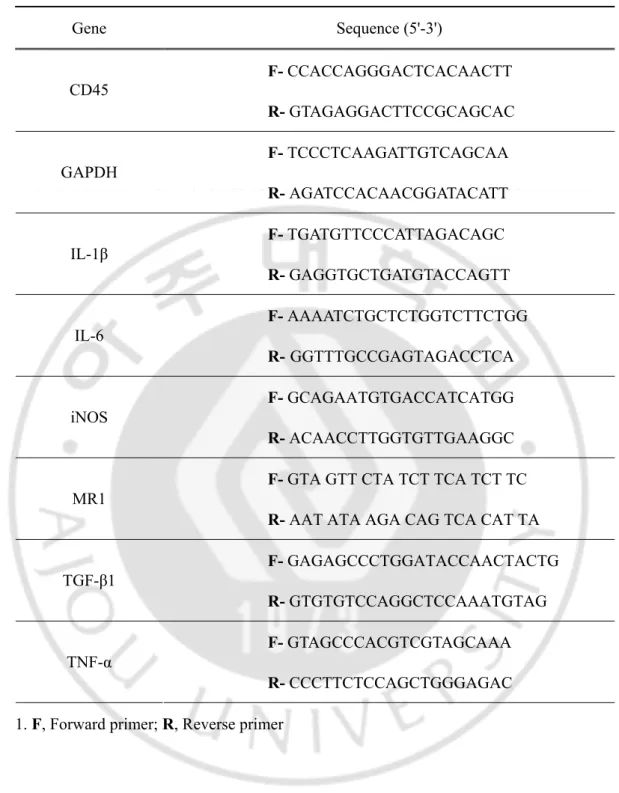
Table 1. List of primer sequences for RT-PCR and Q-PCR1.
1. F, Forward primer; R, Reverse primer
Gene Sequence (5'-3') F- CCACCAGGGACTCACAACTT CD45 R- GTAGAGGACTTCCGCAGCAC F- TCCCTCAAGATTGTCAGCAA GAPDH R- AGATCCACAACGGATACATT F- TGATGTTCCCATTAGACAGC IL-1β R- GAGGTGCTGATGTACCAGTT F- AAAATCTGCTCTGGTCTTCTGG IL-6 R- GGTTTGCCGAGTAGACCTCA F- GCAGAATGTGACCATCATGG iNOS R- ACAACCTTGGTGTTGAAGGC
F- GTA GTT CTA TCT TCA TCT TC
MR1
R- AAT ATA AGA CAG TCA CAT TA F- GAGAGCCCTGGATACCAACTACTG TGF-β1 R- GTGTGTCCAGGCTCCAAATGTAG F- GTAGCCCACGTCGTAGCAAA TNF-α R- CCCTTCTCCAGCTGGGAGAC
III. RESULTS
Part A. Inflammatory responses are not sufficient to cause delayed neuronal
death in ATP-induced acute brain injury
1. Time-dependent behavior of inflammatory cells in response to ATP injection
To evaluate brain inflammatory cell behavior in response to injury, I injected ATP into the SNpc, the brain area closely related to Parkinson’s disease. ATP was selected as the insult because it is released from damaged cells and induces neuronal death (Cavaliere et al., 2001a; Cavaliere et al., 2001b; Kharlamov et al., 2002; Amadio et al., 2002; Melani et al., 2006), and inflammatory responses in microglia and macrophages (Hide et al., 2000; Sanz and Virgilio, 2000; Inoue, 2002; Parvathenani et al., 2003). Within 3 h, ATP (100 nmol in 2 μl PBS) locally induced loss of Iba-1+ microglia as well as TH+ dopaminergic neurons (Fig. 1A, asterisks: injection sites). PBS and 10 nmol ATP had little effect on the viability of TH+ neurons (Fig. 2A and B), while 1000 nmol ATP induced a severe reduction in TH+ neurons and Iba-1+ microglia (Fig. 2A). The damage area of Iba-1+ cells was similar to that of TH+ cells (Fig. 1A), which was further confirmed with staining of serial sections with TH (Fig. 1B, left panel), Iba-1 (Fig. 1B, middle panel), and a combination of TH/Iba-1 (Fig. 1B, right panel). Damage areas were marked with dotted lines (Fig. 1B). Electron micrographs confirmed the death of neurons and other glial cells, rather than a mere decrease in immunoreactivity of TH and Iba-1. In intact rat brain, neuron (N),
astrocyte (A), and microglia (M) were shown whereas cellular structures were disrupted in ATP-injected brain (Fig. 1C). Based on these results, I employed 100 nmol ATP to induce microglia/neuron damage, and defined the area where both TH+ and Iba-1+ cells died in response to ATP injection as the core region.
Fig. 1. Dopaminergic neurons and microglia die in the SNpc by ATP injection. (A)
ATP (100 nmol in 2 μl PBS) or PBS (2 μl) was unilaterally injected into SNpc (*, injection sites), and brains were obtained after 3 h. Brain sections (30 μm thickness) of the midbrain including the entire SN were prepared, every sixth serial sections were selected and stained with TH (upper panel) and Iba-1 (lower panel) antibodies, and visualized with biotin-conjugated secondary antibodies and enzymatic detection with the avidin/biotin system unless indicated. At 100 nmol, mild neuronal and microglial damage occurred, thus, 100 nmol ATP was employed for in vivo experiments in this study. Photographs of the most damaged sections were obtained. The contralateral side (contra) and PBS-injected rat brain sections were used as control. (B) Serial sections obtained at 3 h were labeled with TH (left panel), Iba-1 (middle panel), and TH/Iba-1 (right panel) antibodies. For visualization of the double-labeling, color reactions using DAB (for TH) and DAB/nickel sulfate (for Iba-1) were applied. Dotted lines indicated damage areas. (C) Brain tissues obtained
3 h
post ATP
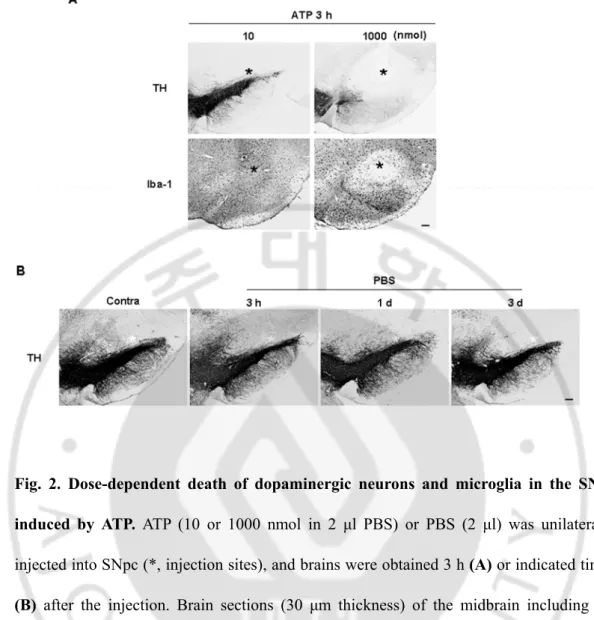
treatment were subjected to electron microscopy, as described in “Materials and Methods”. Nuclei of neuron (N, white arrow), astrocytes (A, white arrowhead), and microglia (M, black arrow) were shown in intact rat brain whereas cellular structures were severely disrupted in ATP-injected brain. Data in this study are representative of at least 5 animals. Scale bars, 200 μm (A); 100 μm (B); 5 μm (C).Fig. 2. Dose-dependent death of dopaminergic neurons and microglia in the SNpc induced by ATP. ATP (10 or 1000 nmol in 2 μl PBS) or PBS (2 μl) was unilaterally
injected into SNpc (*, injection sites), and brains were obtained 3 h (A) or indicated times
(B) after the injection. Brain sections (30 μm thickness) of the midbrain including the
entire SN were prepared, every sixth serial sections were selected and stained with TH and/or Iba-1 antibodies. Photographs of the most damaged sections were obtained. The contralateral side (contra) was used as a control (B). Scale bars, 200 μm.
Next, I investigated the time-dependent behavior of Iba-1+ cells from 3 h to 83 d after ATP injection. In the contralateral SNpc, Iba-1+ cells were evenly distributed (Fig. 3a) and displayed highly ramified morphology (Fig. 3b, higher magnification image of the dotted line in Fig. 3a). At 3 h, in the core region (marked with asterisks), most Iba-1+ cells disappeared (Fig. 3c, d), although the debris remained (black arrows in Fig. 3d). However, in the penumbra region, processes of Iba-1+ cells became thick and short (arrowheads in Fig. 3d), and cells near the core appeared to be arranged so that the core was isolated (white arrows in Fig. 3c, d). At 1 d, some Iba-1+ cells near the core region became rod-shaped (white arrows in Fig. 3f), and Iba-1+ cells beneath this area had thick, long process that headed towards the core region (arrowheads in Fig. 3f). At 2 d, the number of Iba-1+ cells increased (Fig. 3g, h), and round Iba-1+ cells appeared in the core and penumbra regions (white arrows in Fig. 3h). At 3 d, the densities of round Iba-1+ cells increased (Fig. 3i, j), and at 7 d, the core was densely filled with round Iba-1+ cells (Fig. 3k, l). At 14 d, the number of round Iba-1+ cells was significantly reduced (Fig. 3m, n), and most became ramified (white arrows in Fig. 3n). At 83 d, most Iba-1+ cells were ramified (Fig. 3p); only those Iba-1+ cells located at the needle tip still displayed a round shape (Fig. 3o, p, and inset in Fig. 3p). In the SNpc injected with PBS (2 μl), Iba-1+ cells observed at 3 h had not died but their processes had retracted. At 1 d and 3 d, Iba-1+ cells in the PBS-injected brain once again became ramified, but had thicker processes than those in the intact brain (Fig. 4). However, the round Iba-1+ cells were not detectable in PBS-injected brains (Fig. 4). These results indicate that Iba-1+ cells are vulnerable to ATP-induced damage and dramatically alter their morphology and number in response to damage.
Fig. 3. Time-dependent behavior of Iba-1+ cells in ATP-injected SNpc. Serial sections
obtained 3 h - 83 d after ATP injection (*, injection sites unless indicated) were processed for Iba-1 immunostaining, as described for Fig. 1. Photographs of the most damaged sections were obtained. The lower panel represents higher magnification of the indicated area in the upper panel. ATP rapidly altered the behavior of Iba-1+ cells, and its effects lasted at least for 83 d. Black arrows in (d) show debris remained. Arrowheads in (d) and (f) indicate thick and short process-bearing Iba-1+ cells. White arrows represent Iba-1+ cells arranged around the injury site (c, d), rod-shaped cells (f), round cells (h, j, and l), and ramified cells (n, p). Inset in (p) shows that some Iba-1+ cells located at the needle tip still displayed a round shape. Data are representative of results obtained from at least 5 animals, unless indicated. Scale bars, 200 μm (upper panel); 100 μm (lower panel); 20 μm (inset).
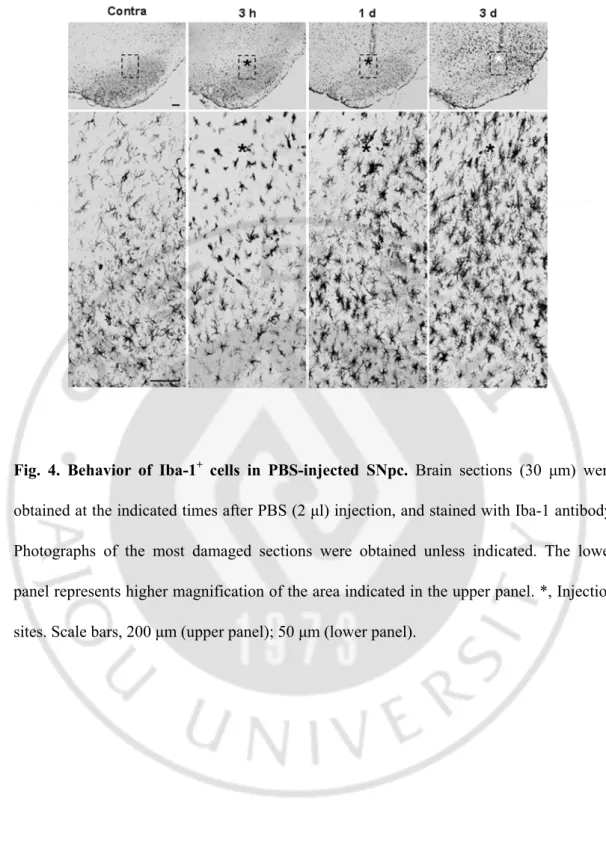
Fig. 4. Behavior of Iba-1+ cells in PBS-injected SNpc. Brain sections (30 μm) were
obtained at the indicated times after PBS (2 μl) injection, and stained with Iba-1 antibody. Photographs of the most damaged sections were obtained unless indicated. The lower panel represents higher magnification of the area indicated in the upper panel. *, Injection sites. Scale bars, 200 μm (upper panel); 50 μm (lower panel).
2. Monocytes but not neutrophils infiltrate the ATP-injected brain
Since the number of round Iba-1+ cells was significantly increased from 2 d after ATP injection, I investigated the cellular sources. Initially, I examined the possibility of proliferation of Iba-1+ microglia from the penumbra regions. Cells expressing Ki-67 (a cell cycle protein used as a proliferation marker) were detectable at 2 d after ATP injection, and significantly increased at 3 d, but decreased at 7 d (Fig. 5A). Ki-67+ cells were barely detectable in PBS-injected SNpc and intact SNpc (Fig. 5A). To ascertain whether microglia were Ki-67+, I performed double immunolabeling using CD11b and Ki-67 antibodies. Since both Iba-1 and Ki-67 antibodies were generated in the same species of animals (rabbits), CD11b antibodies generated in mice were employed to detect microglia. Interestingly, Ki-67 immunoreactivity (arrowheads in Fig. 5B) did not match that of CD11b (arrows in Fig. 5B). Ki67 immunoreactivity was detectable in GFAP+ astrocytes (Fig. 5C). These results clearly indicate that microglia do not actively proliferate in the ATP-injected brain.
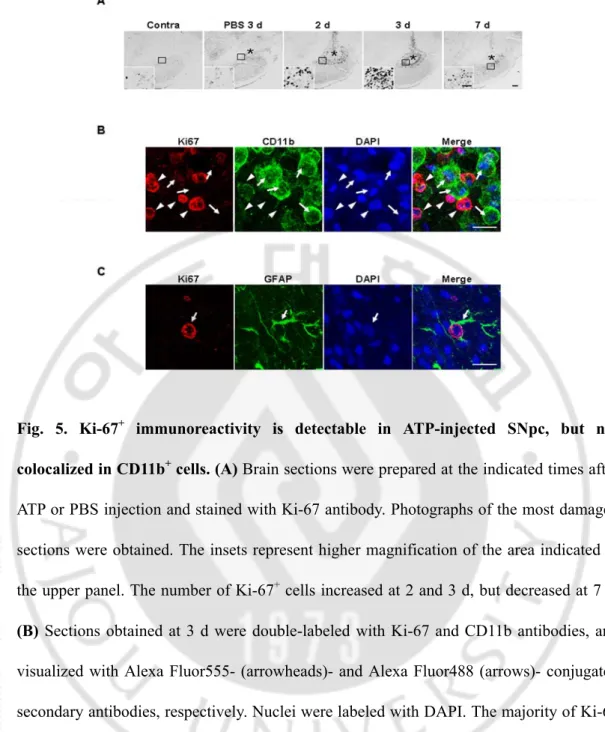
Fig. 5. Ki-67+ immunoreactivity is detectable in ATP-injected SNpc, but not
colocalized in CD11b+ cells. (A) Brain sections were prepared at the indicated times after
ATP or PBS injection and stained with Ki-67 antibody. Photographs of the most damaged sections were obtained. The insets represent higher magnification of the area indicated in the upper panel. The number of Ki-67+ cells increased at 2 and 3 d, but decreased at 7 d. (B) Sections obtained at 3 d were double-labeled with Ki-67 and CD11b antibodies, and
visualized with Alexa Fluor555- (arrowheads)- and Alexa Fluor488 (arrows)- conjugated secondary antibodies, respectively. Nuclei were labeled with DAPI. The majority of Ki-67 immunoreactivity was not detectable in CD11b+ cells. (B) Sections obtained at 3 d were double-labeled with Ki-67 and GFAP. Ki-67 immunoreactivity was detectable in GFAP+ cells. Scale bars, 200 μm (A); 50 μm (A, insets); and 20 μm (B and C).
Next, I examined the possible infiltration of blood monocytes, in view of previous reports that monocytes express Iba-1 and infiltrate the damaged brain (Kochanek and Hallenbeck, 1992; del Zoppo et al., 2000; Ji et al., 2007; Malm et al., 2005). I stained sections obtained at 2-7 d after ATP injection with CD45 antibodies, since expression levels of CD45 were low in microglia and high in blood monocytes (Sedgwick et al., 1991; Ford et al., 1995; Campanella et al., 2002). Interestingly, round CD45+ cells were densely located in the penumbra region at 2 d (Fig. 6Aa, b) and 3 d (Fig. 6A), and filled the core by 7 d (Fig. 6Ac). CD45+ cells were tightly bound to blood vessels (Fig. 6Aa) and their location at 2 d and 3 d was similar to that of round Iba-1+ cells, as shown in Fig. 2. In the intact contralateral side, CD45+ cells were not detectable (Fig. 6A). In PBS-injected SNpc, at 3 d, CD45+ cells were scattered at low density (Fig. 6A). I further confirmed that round Iba-1+ cells detected in the penumbra region 2 d after ATP injection were co-labeled with CD45 antibody (arrows in Fig. 6B), whereas Iba-1+ ramified cells were barely labeled (arrowheads in Fig. 6B). In addition, I examined the mRNA levels of CD45 in ATP-injected SNpc. I found that CD45 mRNA level was upregulated at 1-3 d in RT-PCR analysis (Fig. 6D). To exclude the possibility that ATP could enhance CD45 expression level in microglia, CFDA-labeled microglia and blood monocytes were co-cultured, treated with 100 μM ATP for 12 h, and examined CD45 expression. CD45 expression was significantly stronger in monocytes (arrows, Fig. 7A) and microglia (arrowheads, Fig. 7A) did not enhance CD45 expression even in the presence of ATP. In addition, CD45 mRNA level in ATP-treated primary cultured microglia was also detected (Fig. 7B). However, CD45 mRNA level in primary microglia did not significantly change in response to 0.1 - 3
mM ATP at 12 h (Fig. 7B). Furthermore, I confirmed monocyte infiltration in rats transplanted with CFDA-labeled monocytes into the tail vein. Iba-1+/CFDA+ round cells were detectable at 2 d after ATP injection when CFDA-labeled monocytes were transplanted at 12 h after ATP injection (Fig. 6C). These results indicate that Iba-1+/CD45+ monocytes actively infiltrate the ATP-injected brain.
Neutrophils are initially recruited to injury sites in systemic inflammation, and LPS-injected, ischemic and traumatic brains (Hallenbeck et al., 1986; Schoettle et al., 1990; Kochanek and Hallenbeck, 1992; Matsuo et al., 1994; Zhang et al., 1995; Connolly et al., 1996; del Zoppo et al., 2000; Matsumoto et al., 2007; Ji et al., 2007; Ji et al., 2008; Gautier et al., 2009; Bohatschek et al., 2001). Accordingly, I examined whether neutrophils infiltrate ATP-injected SNpc. However, ATP injection did not significantly induce neutrophil recruitment. Only a few MPO+ neutrophils were detectable in 100 nmol ATP-injected SNpc from 12 h to 3 d (arrows in Fig. 8A). Even at 1000 nmol ATP, not many neutrophils were detectable (arrows in Fig. 8B), in contrast to LPS-injected SNpc (Fig. 8C). Neurons on the contralateral side were faintly stained with MPO antibodies (arrowheads in Fig. 8A). Accordingly, neutrophil infiltration appeared variable, depending on the damage insult. These results collectively suggest that monocytes but not neutrophils infiltrate from the blood and largely contribute to the increase in Iba-1+ cells in the ATP-injected brain.
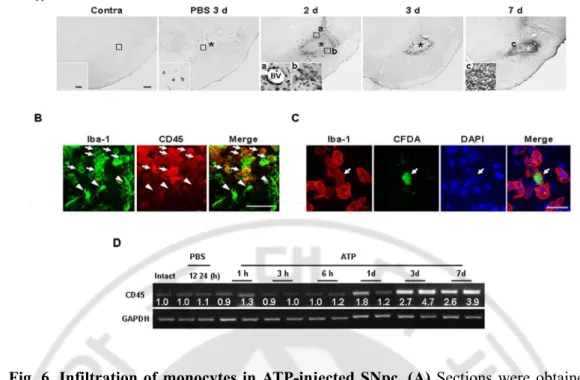
Fig. 6. Infiltration of monocytes in ATP-injected SNpc. (A) Sections were obtained at
the indicated times after ATP or PBS injection, and stained with CD45 antibody. Insets show higher magnification of boxed areas. (B) Sections were obtained 2 d after ATP injection, and double-labeled with Iba-1 and CD45 antibodies. Round Iba-1+ cells were CD45+ (arrows) whereas ramified Iba-1+ cells were CD45- (arrowheads). (C) Infiltration of blood-borne monocytes in ATP-injected SNpc. CFDA-labeled monocytes were transplantated into the tail vein of rats 12 h after ATP injection as described in “Materials and Methods (Monocytes isolation and transplantation)”. Brain sections were obtained at 2 d after ATP injection, and stained with Iba-1 antibody. Scale bars, 200 μm (A); 50 μm (inset in A, B); 20 μm (C). (D) mRNA level of CD45 in ATP-injected SNpc was detected using RT-PCR. Band intensities were analyzed using Quantity One 1-D analysis software.
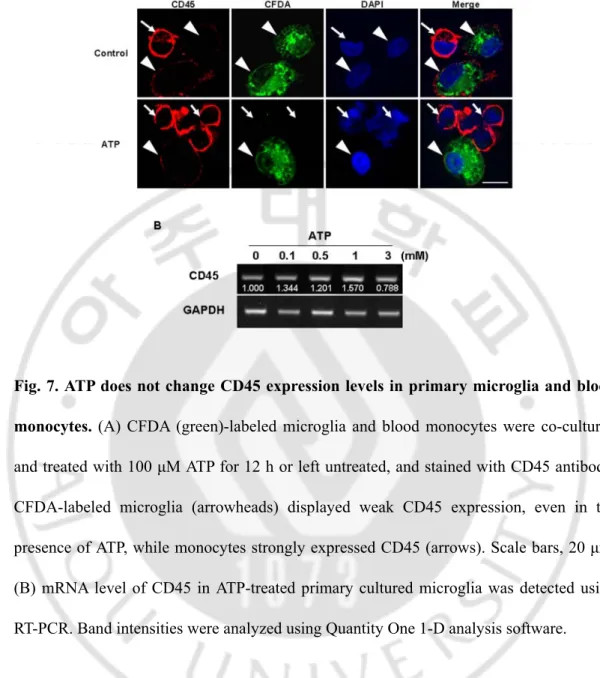
Fig. 7. ATP does not change CD45 expression levels in primary microglia and blood monocytes. (A) CFDA (green)-labeled microglia and blood monocytes were co-cultured
and treated with 100 μM ATP for 12 h or left untreated, and stained with CD45 antibody. CFDA-labeled microglia (arrowheads) displayed weak CD45 expression, even in the presence of ATP, while monocytes strongly expressed CD45 (arrows). Scale bars, 20 μm. (B) mRNA level of CD45 in ATP-treated primary cultured microglia was detected using RT-PCR. Band intensities were analyzed using Quantity One 1-D analysis software.
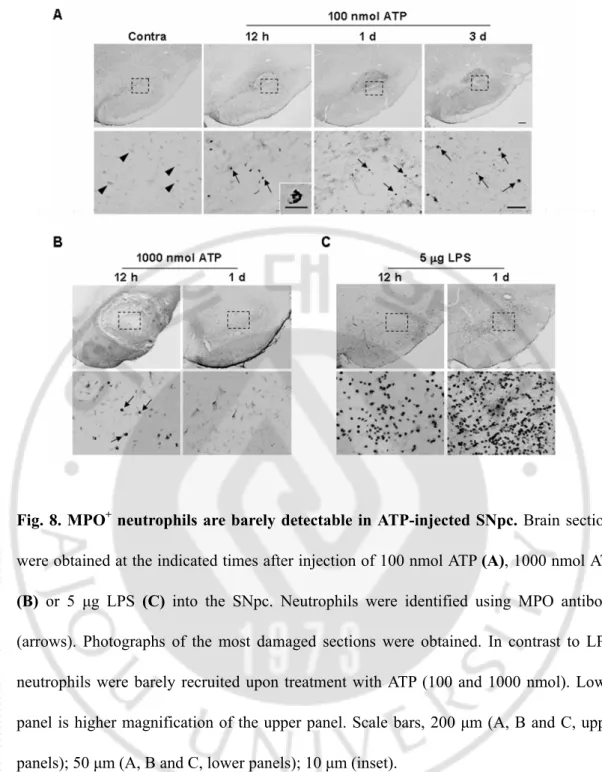
Fig. 8. MPO+ neutrophils are barely detectable in ATP-injected SNpc. Brain sections
were obtained at the indicated times after injection of 100 nmol ATP (A), 1000 nmol ATP
(B) or 5 μg LPS (C) into the SNpc. Neutrophils were identified using MPO antibody
(arrows). Photographs of the most damaged sections were obtained. In contrast to LPS, neutrophils were barely recruited upon treatment with ATP (100 and 1000 nmol). Lower panel is higher magnification of the upper panel. Scale bars, 200 μm (A, B and C, upper panels); 50 μm (A, B and C, lower panels); 10 μm (inset).
3. Expression profiles of inflammatory mediators in ATP-injected SNpc
Next, I investigated the mRNA expression of inflammatory mediators in the ATP-injected brain. IL-1β, TNF-α, and IL-6 mRNA reached peak levels within 3 h, were maintained (IL-1β and IL-6) or slightly decreased (TNF-α) at 12 h, and then decreased to or approached basal levels thereafter (Fig. 9A). Interestingly, the expression levels of all of these cytokines were also increased in the PBS-injected brain, particularly IL-1β and TNF-α, which were higher than in ATP-injected brain at 3 d and 12 h, respectively (Fig. 9A).
I further examined the expression of inflammatory mediators using an immunohistochemical approach. Interestingly, iNOS immunoreactivity was not detectable in the ATP-injected SNpc for up to 7 d (Fig. 8B, insets; higher magnification of boxed areas). The absence of iNOS immunoreactivity in the ATP-injected brain was not due to experimental error since iNOS was readily detected in brain sections obtained from positive control rats systemically injected with LPS. In contrast to iNOS, IL-1β was strongly detected at 3 h, decreased at 12 h, and disappeared at 3 d (Fig. 9B). IL-1β was detected in the penumbra region of the ATP-injected SNpc where microglia were morphologically activated, but not in the core where microglia had died (Fig. 9B). IL-1β was also detectable in the PBS-injected SNpc, but here it was present in both the penumbra and core regions (Fig. 9B). I next examined phagocytic activity by probing for CD68, a widely used marker of phagocytic activity (da Silva and Gordon, 1999; Nerlich et al., 2002; Rezaie et al., 2005). In the ATP-injected brain, CD68 immunoreactivity was not detectable for up to 12 h, but appeared at 1 d, and significantly increased at 3-7 d (Fig. 9B) in areas that were densely populated with round Iba-1+ cells and/or CD45+ cells (Fig. 3,
6A). On the other hand, CD68 expression was barely detectable in the PBS-injected brain (Fig. 9B). In double-labeling experiments, cellular types that expressed IL-1β and CD68 were identified. As expected, IL-1β and CD68 were detected in Iba-1+ cells that were considered microglia and monocytes, respectively (Fig. 9C).