INTRODUCTION
Positron emission tomography-computed tomography
(PET/CT), which has been developed recently, combines a PET scanner with an X-ray CT scanner. Therefore, PET/CT allows the convergence of anatomical and functional imag-es in hardware, which providimag-es the precise location of a le-sion and improves the diagnostic performance of PET im-age itself(Bar-Shalom et al. 2003; Antoch et al. 2004). In ─ 267 ─
Technical Paper
Journal of Radiation Industry 12(4) : 267~276(2018)
* Corresponding author: Jae-Kwang Ryu, Tel. +82-01-7341-3557, Fax. +82-2-3010-2308, E-mail. [email protected]
Evaluation of Images Depending on an Attenuation Correction
in a Brain PET/CT Scan
Eun-Jin Choi1, Mon-Taeg Jeong2, Kyung-Rae Dong3, Jong-Gil Kwak1,4,
Ji-Won Choi5 and Jae-Kwang Ryu6,*
1Department of Public Health and Medicine, Dongshin University Graduate School, 185, Geonjae-ro, Naju-si, Jeollanam-do 58245, Republic of Korea
2Department of Radiological Science, Dongshin University 185, Geonjae-ro, Naju-si, Jeollanam-do 58245, Republic of Korea 3Department of Radiological Technology, Gwangju Health University, 73, Bungmun-daero 419 beon-gil, Gwangsan-gu, Gwangju 62271, Republic of Korea
4Comprehensive Medical Examination Center, KS Hospital, 220, Wangbeodeul-ro, Gwangsan-gu, Gwangju 62248, Republic of Korea
5Department of Radiological Science, Jeonju University,
303, Cheonjam-ro, Wansan-gu, Jeonju-si, Jeollabuk-do 55069, Republic of Korea 6Depatment of Nuclear Medicine, Asan Medical Center,
88, Olympic-ro 43-gil, Songpa-gu, Seoul 05505, Republic of Korea
Abstract - A Hoffman 3D Brain Phantom was used to evaluate two PET/CT scanners, BIO_40 and D_690, according to the radiation dose of CT(low, medium and high) at a fixed kilo-voltage-peak (kVp) with the tube current(mA) varied in 17~20 stages(Bio_40 PET/CT scanner: the tube voltage was fixed to 120kVp, the effective tube current(mAs) was increased from 33mAs to 190mAs in 10 mAs increments, D_690 PET/CT scanner: the tube voltage was fixed to 140kVp, tube current(mA) was increased from 10mAs to 200mAs in 10mAs increments). After obtaining the PET image, an attenuation correction was conducted based on the attenuation map, which led to an analysis of the difference in the image. First, the ratio of white to gray matter for each scanner was examined by comparing the coefficient of variation(CV) depending on the average ratio. In addition, a blind test was carried out to evaluate the image. According to the study results, the BIO_40 and D_690 scanners showed a <1% change in CV value due to the tube current conversion. The change in the coefficients of white and gray matter showed that the Z value was negative for both scanners, indicating that the coefficient of gray matter was higher than that of white matter. Moreover, no difference was observed when the images were compared in a blind test.
Key words : Hoffman 3D brain phantom, Bio_40 PET/CT scanner, D_690 PET/CT scanner, Attenuation map
PET/CT, a CT image is not only conducive to a diagnosis but is also used as an attenuation map that is required for an attenuation correction in a PET emission scan. In a PET im-age, data correction is needed to improve the image quality. Data correction includes an attenuation correction, random coincidence correction, scatter coincidence correction, coef-ficient loss correction, and radioactivity attenuation correc-tion. Among these corrections, the attenuation correction has the largest effect on the quality of PET images. The at-tenuation phenomenon in a PET image means that the de-gree of attenuation in the line of response(LOR) between two detectors is constant regardless of the location. If the respective values of the detection probability of the two gamma rays that are generated in a random point, as shown in Fig. 1, are multiplied by each other, the probability will be constant regardless of the location
2
matter was higher than that of white matter. Moreover, no difference was observed when the images were compared in a blind test.
Keywords: Hoffman 3D Brain Phantom, Bio_40 PET/CT scanner, D_690 PET/CT scanner, Attenuation map
Introduction
Positron emission tomography-computed tomography (PET/CT), which has been developed recently, combines a PET scanner with an X-ray CT scanner. Therefore, PET/CT allows the convergence of anatomical and functional images in hardware, which provides the precise location of a lesion and improves the diagnostic performance of PET image itself (Bar-Shalom et al. 2003; Antoch et al. 2004). In PET/CT, a CT image is not only conducive to a diagnosis but is also used as an attenuation map that is required for an attenuation correction in a PET emission scan. In a PET image, data correction is needed to improve the image quality. Data correction includes an attenuation correction, random coincidence correction, scatter coincidence correction, coefficient loss correction, and radioactivity attenuation correction. Among these corrections, the attenuation correction has the largest effect on the quality of PET images. The attenuation phenomenon in a PET image means that the degree of attenuation in the line of response (LOR) between two detectors is constant regardless of the location. If the respective values of the detection probability of the two gamma rays that are generated in a random point, as shown in Figure 1, are multiplied by each other, the probability will be constant regardless of the location
E = E� � �x� �� � μ�x, y�ds��� � � �x� �� � μ�x, y�ds��� � (1)
= E� � �x� �� ����� ����μ�x, y�ds�
In addition, such a relation is equally valid between a blank scan (B) and transmission scan (T), as shown in eq. (2).
� = � � �x� �� ���� ����μ�x, y�ds
� � (2)
Therefore, emission scan data with the photon attenuation corrected can be acquired 2
matter was higher than that of white matter. Moreover, no difference was observed when the images were compared in a blind test.
Keywords: Hoffman 3D Brain Phantom, Bio_40 PET/CT scanner, D_690 PET/CT scanner, Attenuation map
Introduction
Positron emission tomography-computed tomography (PET/CT), which has been developed recently, combines a PET scanner with an X-ray CT scanner. Therefore, PET/CT allows the convergence of anatomical and functional images in hardware, which provides the precise location of a lesion and improves the diagnostic performance of PET image itself (Bar-Shalom et al. 2003; Antoch et al. 2004). In PET/CT, a CT image is not only conducive to a diagnosis but is also used as an attenuation map that is required for an attenuation correction in a PET emission scan. In a PET image, data correction is needed to improve the image quality. Data correction includes an attenuation correction, random coincidence correction, scatter coincidence correction, coefficient loss correction, and radioactivity attenuation correction. Among these corrections, the attenuation correction has the largest effect on the quality of PET images. The attenuation phenomenon in a PET image means that the degree of attenuation in the line of response (LOR) between two detectors is constant regardless of the location. If the respective values of the detection probability of the two gamma rays that are generated in a random point, as shown in Figure 1, are multiplied by each other, the probability will be constant regardless of the location
E = E� � �x� �� � μ�x, y�ds��� � � �x� �� � μ�x, y�ds��� � (1)
= E� � �x� �� ����� ����μ�x, y�ds�
In addition, such a relation is equally valid between a blank scan (B) and transmission scan (T), as shown in eq. (2).
� = � � �x� �� ���� ����μ�x, y�ds
� � (2)
Therefore, emission scan data with the photon attenuation corrected can be acquired (1)
In addition, such a relation is equally valid between a blank scan(B) and transmission scan(T), as shown in eq. (2).
2
PET/CT allows the convergence of anatomical and functional images in hardware, which provides the precise location of a lesion and improves the diagnostic performance of PET image itself (Bar-Shalom et al. 2003; Antoch et al. 2004). In PET/CT, a CT image is not only conducive to a diagnosis but is also used as an attenuation map that is required for an attenuation correction in a PET emission scan. In a PET image, data correction is needed to improve the image quality. Data correction includes an attenuation correction, random coincidence correction, scatter coincidence correction, coefficient loss correction, and radioactivity attenuation correction. Among these corrections, the attenuation correction has the largest effect on the quality of PET images. The attenuation phenomenon in a PET image means that the degree of attenuation in the line of response (LOR) between two detectors is constant regardless of the location. If the respective values of the detection probability of the two gamma rays that are generated in a random point, as shown in Figure 1, are multiplied by each other, the probability will be constant regardless of the location
E = E� � �x� �� � μ�x, y�ds��� � � �x� �� � μ�x, y�ds��� � (1)
= E� � �x� �� ����� ����μ�x, y�ds�
In addition, such a relation is equally valid between a blank scan (B) and transmission scan (T), as shown in eq. (2).
� = � � �x� �� ���� ����μ�x, y�ds
� � (2)
Therefore, emission scan data with the photon attenuation corrected can be acquired (2)
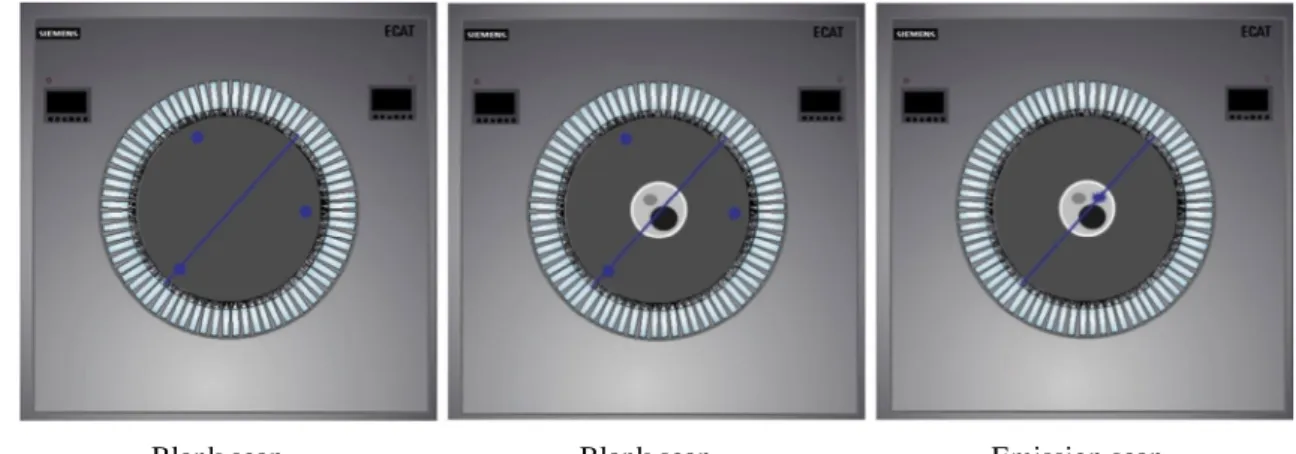
Therefore, emission scan data with the photon attenuation corrected can be acquired when a blank scan(B) and trans-mission scan(T) are divided for each pixel and multiplied by the emission scan data, as shown in eq.(3)(Fig. 2)(Cherry 2002; Chung and Lee 2008).
3
when a blank scan (B) and transmission scan (T) are divided for each pixel and multiplied by the emission scan data, as shown in eq. (3) (Fig. 2) (Cherry 2002; Chung
and Lee 2008).
E��γθ= ��γθγθ × E�γθ (3)
Fig. 1. Characteristics of the PET attenuation correction.
Blank scan Blank scan Emission scan Fig. 2. Image for attenuation correction.
The attenuation correction of a PET image using a CT image has some strong points compared to a transmission scan, which uses external sources (Kinahan et al.1998; Von Schulthess 2000). First, the time to obtain a CT image is much shorter than in the case with a transmission scan, which enables a decrease in scan time. Second, a CT image has a much larger number of photons and higher resolution than a transmission image, which leads to much less noise in the attenuation map. For these reasons, it is important to perform a segmented attenuation correction (SAC), where the attenuation constants of some tissues are applied uniformly depending on the range of attenuation constants to reduce noise in a PET image obtained by a transmission scan using the external source and reduce the time needed for a transmission scan. On the other hand, the measured attenuation correction (MAC) that uses a CT image enables the application of an attenuation constant in the form of a pixel unit that is obtained in an attenuation map but
(3) The attenuation correction of a PET image using a CT image has some strong points compared to a transmission scan, which uses external sources(Kinahan et al. 1998; Von Schulthess 2000). First, the time to obtain a CT image is much shorter than in the case with a transmission scan, which enables a decrease in scan time. Second, a CT image has a much larger number of photons and higher resolution than a transmission image, which leads to much less noise in the attenuation map. For these reasons, it is important to perform a segmented attenuation correction(SAC), where the atten-uation constants of some tissues are applied uniformly de-pending on the range of attenuation constants to reduce noise in a PET image obtained by a transmission scan using the external source and reduce the time needed for a transmis-Fig. 2. Image for attenuation correction.
Fig. 1. Characteristics of the PET attenuation correction.
Evaluation of Images Depending on an AC in a Brain PET/CT Scan 269
sion scan. On the other hand, the measured attenuation cor-rection(MAC) that uses a CT image enables the application of an attenuation constant in the form of a pixel unit that is obtained in an attenuation map but has a weak point of an in-crease in the patient’s exposure to radiation(Xu et al. 1991; Bettinardi et al. 1999).
The difference in uptake of a PET image obtained using a CT image is a critical issue in the actual reading of a PET im-age. On the other hand, a CT scan is used only as a tool for an attenuation correction when the distribution of radiophar-maceutical is simply checked, as in the case with a brain PET/CT scan(such as dementia, epilepsy, Alzheimer’s dis-ease, etc.). Against this background, this study examined the effect of noise in an attenuation map on the attenuation cor-rection when the CT dose is minimized as well as the base-line where no noise occurs.
MATERIALS AND METHODS
1. PET/CT systemThis study was conducted using the PET/CT systems, Bi-ograph Sensation 40(SIEMENSE, German, hereafter BIO_ 40) and Discovery 690(General Electric, USA, hereafter D_ 690). Both systems were reconstructed using an iterative re-construction algorithm.
2. Image acquisition
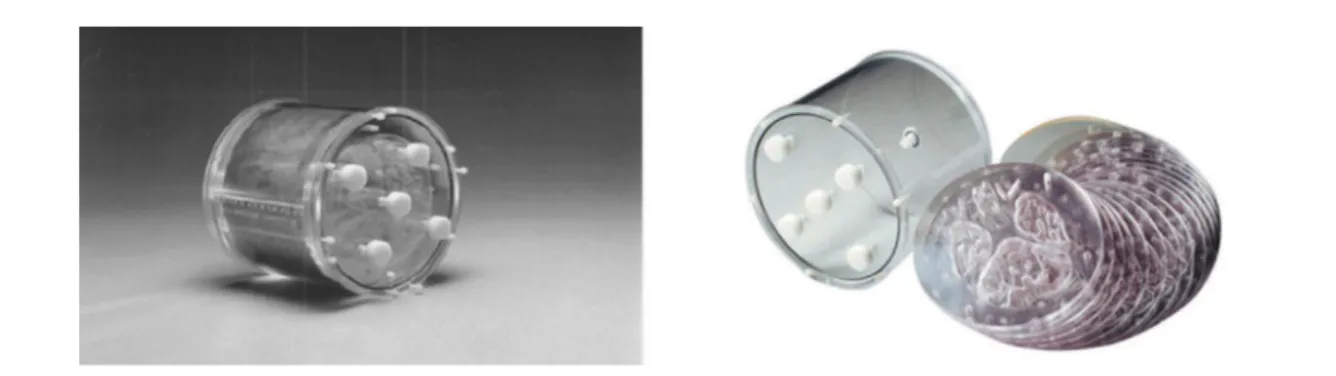
18F-FDG in 1mCi(37MBq) was diluted in water, and poured into a Hoffman 3-D Brain Phantom(Fig. 3). The im-age was obtained after one hour had passed.
3. Image data acquisition in BIO_40
When the tube voltage was fixed to 120kVp, the effective
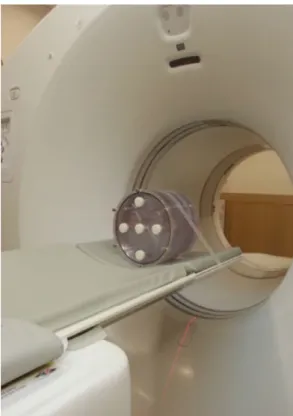
tube current(mAs) was increased from 33mAs(minimum dose) to 190mAs(maximum dose) in 10mAs increments, and the Hoffman 3-D Brain Phantom was imaged(Fig. 4). A PET image(15min/1bed) was then obtained to draw and ap-ply a correction to an attenuation map depending on each condition. In general, the degree of attenuation that occurs as the photon penetrates through the matter can be expressed as eq.(4).
5
depending on each condition. In general, the degree of attenuation that occurs as the photon penetrates through the matter can be expressed as eq. (4).
Φ = Φ��� � μ�x, y�dr� � (4)
where Φ and Φ0 are the transmitted and incident photons per unit area, dr represents thickness of the medium, and μ represents the attenuation coefficient, which means the degree of the physical phenomena, such as the photoelectric effect or Compton scattering effect, as a photon passes through a medium in unit length.
The equation above was rearranged to derive eq. (5). In this case, exp�� μ�x, y�dr� is defined as the attenuation correction factor (ACF). The attenuation correction of the PET data involves multiplying the emission data by the ACF.
� μ�x, y�dr = log��ΦΦ�� (5)
Fig. 4. Acquisition of the image data in BIO_40. 4. Image Data Acquisition in D_690
When the tube voltage was fixed to 140 kVp, tube current (mA) was increased from 10 mAs to 200 mAs in 10 mAs increments, and the Hoffman 3-D Brain Phantom was imaged (Fig. 5). Subsequently, a PET image (10 min/1 bed) was obtained to draw and apply a correction to the attenuation map depending on each condition.
(4) where Φ and Φ0 are the transmitted and incident photons per unit area, dr represents thickness of the medium, and μ represents the attenuation coefficient, which means the de-gree of the physical phenomena, such as the photoelectric ef-fect or Compton scattering efef-fect, as a photon passes through a medium in unit length.
The equation above was rearranged to derive eq.(5). In this case, exp[∫μ(x,y)dr] is defined as the attenuation cor-rection factor(ACF). The attenuation correction of the PET data involves multiplying the emission data by the ACF. Fig. 3. Hoffman 3-D Brain Phantom.
Eun-Jin Choi, Mon-Taeg Jeong, Kyung-Rae Dong, Jong-Gil Kwak, Ji-Won Choi and Jae-Kwang Ryu 270
5
The equation above was rearranged to derive eq. (5). In this case, exp�� μ�x, y�dr� is defined as the attenuation correction factor (ACF). The attenuation correction of the PET data involves multiplying the emission data by the ACF.
� μ�x, y�dr = log��ΦΦ�� (5)
Fig. 4. Acquisition of the image data in BIO_40. 4. Image Data Acquisition in D_690
When the tube voltage was fixed to 140 kVp, tube current (mA) was increased from 10 mAs to 200 mAs in 10 mAs increments, and the Hoffman 3-D Brain Phantom was imaged (Fig. 5). Subsequently, a PET image (10 min/1 bed) was obtained to draw and apply a correction to the attenuation map depending on each condition.
(5)
4. Image data acquisition in D_690
When the tube voltage was fixed to 140kVp, tube current (mA) was increased from 10mAs to 200mAs in 10mAs in-crements, and the Hoffman 3-D Brain Phantom was imaged (Fig. 5). Subsequently, a PET image(10min/1bed) was
ob-tained to draw and apply a correction to the attenuation map depending on each condition.
5. Coefficient variation depending on tube current variation
The PET raw data was used to create an attenuation-cor-rection image based on the attenuation map that was drawn depending on each tube current using the CT image obtained from the Hoffman 3D Brain Phantom. The regions of interest (ROIs) for the white and gray matter were set to 0.5 square
×cm to calculate the coefficient of variation(CV) using each ratio in the same location(Fig. 6). In addition, the SPSS Ver-sion 15.0 program was used for statistical analysis. The mean minimum and maximum values were used to conduct a non- parametric Mann-Whitney U Test to examine the difference between the white and gray matter for each scanner. A p val-ue<0.05 was considered significant.
6. Comparative analysis of image depending on tube current variation
The CT image obtained using the Hoffman 3D Brain Phan-tom was evaluated depending on the tube current variation by conducting a blind test on five nuclear medicine physi-cians working in a general hospital. In the ordinal scale, which was a qualitative scale, image resolution obtained with increasing tube current(mA) was scored as 5 points for “ex-cellent,” 4 points for “good,” 3 points for “average,” 2 points for “difficult to read,” and 1 point for “unable to read.” The scores were then averaged.
Fig. 5. Acquisition of the image data in D_690.
Evaluation of Images Depending on an AC in a Brain PET/CT Scan 271
RESULTS
1. Ratio of white matter to gray matter in BIO_40
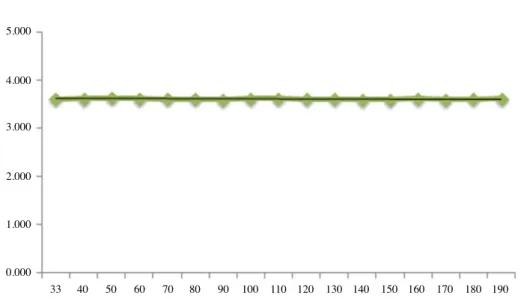
In BIO_40, the average white to gray matter ratio was 3.603 at effective tube currents ranging from 33mAs(the lowest dose) to 190mAs(the highest dose). The CV for the average ratio was 0.003(Table 1 and Fig. 7).
2. Ratio of white matter to gray matter in D_690
In D_690, the average white to gray matter ratio was 3.413 at tube currents ranging from 10mAs(the lowest dose) to
200mAs(the highest dose). The CV for the average ratio was 0.002(Table 2 and Fig. 8).
3. Statistical analysis of white matter and gray matter in BIO_40 and D_690
The raw PET data was used to create an attenuation cor-rection image based on the attenuation map that was drawn at each tube current using the CT image obtained from a Hoffman 3D Brain Phantom in BIO_40 and D_690 scanners. The ROIs for the white and gray matter were then set to 0.5 square×cm to conduct a non-parametric Mann-Whitney U Fig. 7. Average ratio of the count number for the regions of interest of white and gray matter in BIO_40.
Table 1. Average ratio of the count for the regions of interest of white and gray matter in BIO_40
BIO_40 CT effective mAs White matter Gray matter Average ratio
Min Max Ave Min Max Ave
1 33 2777.0 10751.0 5247.2 17374.0 20759.0 18906.1 3.603 2 40 2696.0 10744.0 5232.5 17581.0 20437.0 18884.8 3.609 3 50 2786.0 10718.0 5243.4 16841.0 21193.0 18988.1 3.621 4 60 2782.0 10741.0 5246.3 16819.0 21262.0 18969.6 3.616 5 70 2786.0 10733.0 5243.7 16851.0 21196.0 18852.2 3.595 6 80 2496.0 10745.0 5254.0 16835.0 21217.0 18893.0 3.596 7 90 2790.0 10729.0 5246.9 16833.0 21201.0 18847.6 3.592 8 100 2510.0 10714.0 5216.9 16847.0 21215.0 18866.3 3.616 9 110 2790.0 10729.0 5246.9 16883.0 21201.0 18942.0 3.610 10 120 2788.0 10730.0 5248.6 17052.0 21201.0 18925.1 3.606 11 130 2786.0 10736.0 5252.5 17218.0 21202.0 18908.6 3.600 12 140 2787.0 10738.0 5248.0 16834.0 21199.0 18832.5 3.589 13 150 2787.0 10738.0 5248.9 16834.0 21199.0 18832.5 3.588 14 160 2780.0 10725.0 5243.1 16820.0 21180.0 18908.7 3.606 15 170 2783.0 10718.0 5239.0 16804.0 21186.0 18827.0 3.594 16 180 2786.0 10714.0 5244.9 16811.0 21172.0 18907.9 3.605 17 190 2781.0 10711.0 5235.2 16785.0 21149.0 18895.2 3.609 CV 0.034 0.001 0.002 0.013 0.010 0.003 0.003 5.000 4.000 3.000 2.000 1.000 0.000 33 40 50 60 70 80 90 100 110 120 130 140 150 160 170 180 190
Test to compare the count in the same location. According to the analysis, the Z value of white matter from the BIO_40
and D_690 scanners was -4.978 and -5.412, respectively. These results show that the count for white matter was sig-Table 2. Average ratio of the count for the regions of interest of white and gray matter in D_690
D_690 CT mA White matter Gray matter Average ratio
Min Max Ave Min Max Ave
1 10 6105 8201 6899 21838 24762 23510 3.408 2 20 6128 8193 6910 21893 24662 23533 3.406 3 30 5985 8101 6896 21967 25038 23530 3.412 4 40 6055 8110 6911 21899 24867 23532 3.405 5 50 6007 8111 6900 22032 24644 23523 3.409 6 60 6015 8114 6904 22035 24651 23602 3.419 7 70 5995 8099 6890 21994 24987 23632 3.430 8 80 5886 8032 6888 21946 25014 23456 3.405 9 90 5996 8082 6854 21962 25012 23383 3.412 10 100 5986 8105 6894 21943 24987 23475 3.405 11 110 6107 8166 6870 21986 24598 23432 3.411 12 120 6001 8094 6866 21999 24615 23419 3.411 13 130 6051 8104 6868 21990 24605 23423 3.410 14 140 5985 8063 6840 22205 24991 23470 3.431 15 150 5900 8047 6805 21966 25026 23297 3.424 16 160 5965 8050 6832 21987 25005 23325 3.414 17 170 5997 8075 6851 22103 25012 23473 3.426 18 180 6109 8164 6890 21819 24601 23469 3.406 19 190 6051 8112 6875 22051 24879 23470 3.414 20 200 6002 8054 6899 24693 22002 23523 3.410 CV 0.011 0.006 0.004 0.028 0.027 0.003 0.002
Fig. 8. Average ratio of the count number for the regions of interest of white and gray matter in D_690.
Table 3. Statistical comparison of the coefficients of white matter and gray matter in BIO_40 and D_690
Equipment Region N Mean±SD Z p
BIO_40 White matter of cerebrumGray matter of cerebrum 1717 18893±47.045243±8.77 -4.978 0.000***
D_690 White matter of cerebrumGray matter of cerebrum 2020 23473±81.766677±28.67 -5.412 0.000***
Note: Interaction effect using Mann-Whitney U Test. The unit is the number of count. ***p<0.001 1.000
0.000
Evaluation of Images Depending on an AC in a Brain PET/CT Scan 273
nificantly lower than that for gray matter(p<0.05)(Table 3).
4. Image comparison in BIO_40
When a blind test for BIO_40 was conducted to compare the attenuation correction image depending on the effective tube current(mA), the mean score was 5 points in all cases, showing similar images at the minimum and maximum dos-es(Table 4 and Fig. 9).
5. Image comparison in D_690
When a blind test conducted for D_690 to compare the at-tenuation correction image depending on the tube current (mA), the mean score was 5 points for all cases, showing similar images at the minimum and maximum doses(Table 5 and Fig. 10).
DISCUSSION
The recently developed PET/CT scanner has replaced the existing PET scanner owing to its many strong points. One of the differences between the existing PET image and PET/ CT image is difference in the method of attenuation correc-tion. PET is the representative image equipment that enables visualization of the body organs of interest in a functional and quantitative manner. In an existing PET image, an exter-nal source, such as 68Ge and 137Cs, is used to perform a
trans-mission scan and conduct an attenuation correction. Since PET/CT was introduced, an attenuation correction was con-ducted based on the attenuation map, where the attenuation coefficient of the X rays for CT was converted to the attenu-ation coefficient of 511 keV photons for PET. For the atten-uation correction, the γ rays emitted by the annihilation ra-diation from the human body have different intensities ac-cording to depth due to scattering and absorption. Therefore, to measure γ rays precisely, it is necessary to make a correc-tion for the data that is obtained by actually measuring the data in advance for scattering and absorption by the human body. Such data collection for the purpose of correction is called a transmission scan. Scanning after injecting a radio-pharmaceutical is called an emission scan. An absorption correction has the following strong points. The size, shape and location of a lesion can be described in a much more re-alistic manner. In addition, the radioactivity intensity of a le-sion in body depth can be restored so that it is possible to measure the precise radioactivity concentration in the body and tumor. In PET, a transmission scan is performed as an external source that emits γ rays with similar energy to that of positron-emitting pharmaceutical with the body rotating once, as in the case of CT. The scan time is approximately 5~15 minutes, which takes 10~50% of the time for the en-tire examination. In the meantime, it takes a maximum of one minute in CT, even for a whole body scan. Therefore, the Table 4. Image comparison of BIO_40 depending on the change in
tube current
BIO_40
Effective mAs N Mean±SD
33 5 5.00±0.00 40 5 5.00±0.00 50 5 5.00±0.00 60 5 5.00±0.00 70 5 5.00±0.00 80 5 5.00±0.00 90 5 5.00±0.00 100 5 5.00±0.00 110 5 5.00±0.00 120 5 5.00±0.00 130 5 5.00±0.00 140 5 5.00±0.00 150 5 5.00±0.00 160 5 5.00±0.00 170 5 5.00±0.00 180 5 5.00±0.00 190 5 5.00±0.00
Table 5. Image comparison of D_690 depending on the change in
tube current D_690 mA N Mean±SD 10 5 5.00±0.00 20 5 5.00±0.00 30 5 5.00±0.00 40 5 5.00±0.00 50 5 5.00±0.00 60 5 5.00±0.00 70 5 5.00±0.00 80 5 5.00±0.00 90 5 5.00±0.00 100 5 5.00±0.00 110 5 5.00±0.00 120 5 5.00±0.00 130 5 5.00±0.00 140 5 5.00±0.00 150 5 5.00±0.00 160 5 5.00±0.00 170 5 5.00±0.00 180 5 5.00±0.00 190 5 5.00±0.00 200 5 5.00±0.00
use of a CT-assisted attenuation correction(CTAC) would reduce the examination time by the amount of time required for the traditional transmission scan. CTAC can improve the PET image quality because the amount of data is sufficiently large compared to the case where an external source, such as 137Cs or 68Ge, is used. Therefore, an attenuation correction using CT can reduce the examination time, but it increases the patient’s exposure dose. As a result, it was reported that a sufficient amount of data can be obtained when the tube current is reduced to 5mA(Beyer et al. 2000; Son et al.
2005; Czernin et al. 2007; Kim et al. 2008). A Brain PET/ CT scan requires a CT scout scan(topogram), which first uses CT to select the scan region, and a transmission scan, which is performed for attenuation correction. In this study, a Hoffman 3D Brain Phantom was examined using BIO_40 and D_690 PET/CT scanners. The dose for CT was classi-fied as low dose(minimum dose), medium dose(normal dose for examination) and high dose(dose when a contrast agent is injected). With the tube voltage(kVp) fixed, the tube cur-rent(mA) was adjusted gradually in 17~20 stages to obtain Fig. 9. Image comparison in BIO_40.
Evaluation of Images Depending on an AC in a Brain PET/CT Scan 275
an image. After obtaining the PET image, an attention cor-rection was made based on the attenuation map, which ana-lyzes the difference in image according to the dose. The analysis results showed no difference in image quality.
Con-sequently, this study confirmed that the difference in image quality was not significant in a CT scan used for an attenua-tion correcattenua-tion when the tube current(mA) is changed. Fig. 10. Image comparison in D_690.
pharmaceutical distribution without the need to conduct a high image quality diagnostic CT scan.
REFERENCES
Antoch G, Saoud N, Kuehl H, Dahmen G, Mueller S, Beye T, Bockisch A, Debatin JF and Freudenberg LS. 2004. Accu-racy of whole-body dual-modality fluorine-18-2-fluoro-2-deoxy-D-glucose positron emission tomography andcom-puted tomography(FDG-PET/CT) for tumor staging in solid tumors: comparison with CT and PET. J. Clin. Oncol.
22(21):4357-4368.
Bar-Shalom R, Yefremov N, Guralnik L, Gaitin D, Frenkel A, Kuten A, Altman H, Keidar Z and Lsrael O. 2003. Clinical performance of PET/CT in evaluation of cancer: additional value for diagnostic imaging and patient management. J. Nucl. Med. 44(8):1200-1209.
Bettinardi V, Pagani E, Gilardi MC, Landoni C, Riddell C, Riz-zo G, Castiqlioni I, BelluzRiz-zo D, Luciqnani G, Schubert S. and Fazio F. 1999. An automatic classification technique for attenuation correction in positron emission tomography. Eur. J. Nucl. Med. 26(5):447-458.
provements in cancer staging with PET/CT: literature-based evidence as of September 2006. J. Nucl. Med. 48(Suppl 1): 78S-88S.
Kim JS, Lee JS and Cheon GJ. 2008. Physical Artifact Correc-tion in Nuclear Medicine Imaging: NormalizaCorrec-tion and At-tenuation Correction. Nucl. Med. Mol. Imaging 42(2):112-117.
Kinahan PE, Townsend DW, Beyer T and Sashin D. 1998. At-tenuation correction for a combined 3D PET/CT scanner. Med. Phys. 25(10):2046-2053.
Son HK, Turkington TG, Kwon YY, Jung HJ and Kim HJ. 2005. Impact of Contrast Agent for PET Images with CT-based Attenuation Correction. Korean J. Med. Phys. 16(4):192-201.
Von Schulthess GK. 2000. Cost considerations regarding an in-tegrated CT-PET system. Eur. Radiol. 10(Suppl 3):S377- S380.
Xu EZ, Mullani NA, Gould KL and Anderson WL. 1991. A seg-mented attenuation correction for PET. J. Nucl. Med. 32(1): 161-165.
Received: 26 July 2018 Revised: 17 August 2018 Revision accepted: 28 September 2018