Published by Canadian Center of Science and Education
Bank Characteristics and Payout Policy
Seok Weon Lee1
1 Division of International Studies, Ewha Woman’s University, Seoul, Korea
Correspondence: Seok Weon Lee, Division of International Studies, Ewha Woman’s University, 11-1, Daehyun-dong, Seodaemum-gu, Seoul, 120-750, Korea. Tel: 82-2-3277-4456. E-mail: seoklee@ewha.ac.kr Received: September 14, 2013 Accepted: October 3, 2013 Online Published: December 31, 2013 doi:10.5539/ass.v10n1p12 URL: http://dx.doi.org/10.5539/ass.v10n1p12
Abstract
This paper seeks to identify empirically the factors determining Korean banks’ dividend policy. Banking industry plays a pivotal role for the operation of a nation’s economy having a considerably lower probability of bankruptcy than other industries due to the assistance from deposit insurance system and possible injection of public funds at the time of financial adversity. Thus, the process of the banking industry’s dividend policy decision should be more transparent and efficient than the firms in other industries.
The results of the empirical analyses in this paper suggest that the dividend policy of Korean banks bears a very consistent and close relation to the banks’ financial healthiness, growth opportunity and profitability. More specifically, the Korean banks with higher debt ratios, and therefore, weaker capital adequacy tend to pay less dividends. The banks with higher loan ratios tend to pay less dividends and retain more earnings to undertake the future growth opportunities. Also, the banks with higher profitability appear to pay more dividends. The estimation results for the partitioned sample based on bank characteristics show that the above-found results for the full sample are more significantly observed within the group of the banks with higher capital ratio, higher profitability, and lower nonperforming loans. Thus, the banks in riskier and inferior positions in terms of the bank’s financial adequacy, profitability and the soundness of asset portfolio composition appear not to have consistent and systematic decision-making mechanisms for dividend policy.
Keywords: dividend policy, banking industry, bank characteristics, banking regulation, capital adequacy 1. Introduction
The earnings from investments and profitable operations of a firm can be either distributed to shareholders as dividends in return for their contributions to capital, or kept inside of the firm as retained earnings for future investments and business activities. Between these two options the firm should determine optimal amount of the dividend payment, at which its firm value can be maximized. Thus, dividend policy of a firm is one of the very important issues of the firm’s corporate finance policies affecting the firm value and share price.
The firm uses the dividend policy as a signal to deliver the management’s strategies and predictions about the firm’s current and future expected earnings to the capital market. This mechanism is referred to as signaling effects of dividend policy or simply dividend signaling. The dividend- signaling channel, therefore, pressures the management into making the best decisions with respect to the optimal level of dividend payment maximizing the firm value. In this regard the dividend signaling plays the monitoring role of the capital market against the firm. In addition, dividend is viewed as an effective tool to resolve the agency problem resulting from excess free cash flow. When there is excess free cash flow, the management interested in external growth of the firm may undertake excessive investment and detrimental business expansion that can eventually cause the decrease of firm value and its share price.
This paper seeks to provide an understanding on the dividend policy of the Korean banking industry by empirically examining the factors affecting their dividend policy. As assisted by the deposit insurance system, the banking industry has a considerably lower probability of bankruptcy than other industries. The banking industry is a unique type of industry that can receive the support of public funds for survival which is ultimately financed from taxes paid by people, especially when the industry is at the risk of failure. This is why the process of the banking industry’s dividend policy decision should be more transparent and efficient than the firms in other industries. Furthermore, the banking industry could have an incentive to pay excess dividends with confidence for survival thanks to the continued support from the system of deposit insurance and public funds.
More importantly, banking industry could have serious moral hazard problem to pay excess dividend taking the advantage of the depositors’ and investors’ less willingness to monitor the banks’ behavior. In fact, even in the aftermath of the global financial crisis of 2008, large global banks paid out enormous dividends to their shareholders and senior executives. However, as demonstrated by the Asian financial crisis of 1997 and the global financial crisis of 2008, the financial industry is closely related and inextricably linked with economic recessions – the financial crisis causes an economic recession, which, in turn, brings about a financial crisis. As the interdependence between economic fluctuations and the financial industry is getting higher, excess dividend payment in the banking industry can increase the risk of the entire economy as well as the risk of the banks. Dividend policies of the banking industry, therefore, should be determined transparently and efficiently from the perspective of the firm’s risk management.
Many researchers attempted to identify the factors affecting the dividend policy of firms. Linter (1956), Baker, Farrely and Edelman (1985) conducted survey analysis and found that U.S. firms’ managers consider the factors such as the firm’s future expected profit, past dividend payment, and the amount of free cash flow when determining the current dividend payment. Rozeff (1981) found that the greater the firm’s growth rate of sales, the greater the portion of insider shareholding, and the greater the beta of the firm, the lower the dividend payout ratio the firm has. Crutchley and Hansen (1989) found that the firms’ dividend payout ratio is in a negative relation to the firm’s cost of capital, but in a positive relation to the firm’s asset size and the risk of the firm’s operation. Jensen, Solberg and Zorn (1992) found that the firms’ dividend payout ratio is in a negative relation to the factors such as the level of insider ownership, the growth rate of the firm, and the level of investment, but in a positive relation to the firm’s profitability.
Dividend payout ratios of the Korean firms have been relatively low, in comparison with foreign firms, and there have not been many studies conducted on the dividend policy of Korean firms. It is partly attributed to the Korean government’s economic policy to maintain low interest rates and low inflation rates. Also, Korean government recommended the firms not to pay high level of dividends to maintain sound and healthy financial structures of the firm. Moreover, the structural inefficiency of the Korean capital market has made it difficult for firms to obtain external financing, and therefore, the Korean firms have preferred retaining earnings to pay them as dividends to meet with their excess demand for funds. Especially, there are very few studies on the dividend policy of the Korean banking industry, and even most previous studies that examined the determinants of dividend policy of the non-banking firms do not provide any meaningful and significant implications for dividend policy.
The banking industry is a core and essential type of industry which facilitates the flow of funds within the national economy receiving the support of public funds at the time of bankruptcy risk. Especially the recent drastic inflows of foreign capital into Korean financial industry and the abnormally high level of dividend payments in these firms have put dividend policy of the Korean banking sector in controversy. This paper seeks to identify the factors affecting the dividend policy of the Korean banks. Moreover, to have better understanding about how the dividend policy of the Korean banks is related to different financial and business characteristics of the bank, we classify the entire sample into sub-samples based on different bank characteristics and compare the results.
The next section describes the sample of banks, testing models and hypotheses. In section 3, we present the empirical results and in section 4 offer concluding remarks.
2. Data, Sample, Hypothesis and Testing Model
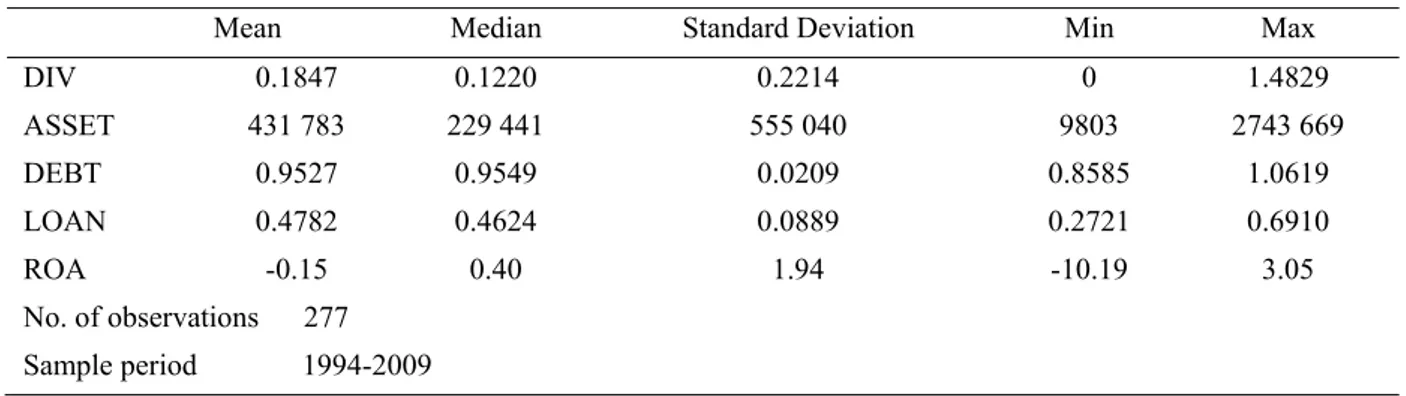
The sample for this paper consists of all the commercial banks in Korea from 1994 to 2009: 24 banks in 1994, 25 banks in 1995 and 1996, 26 banks in 1997, 20 banks in 1998, 17 banks in 1999 and 2000, 15 banks in 2001, 14 banks from 2002 to 2005, and 13 banks form 2006 to 2009. Over the total sample periods 1994-2009, we collect the variables such as dividend payout ratio, total asset, equity capital, debt, loans and return on asset, etc for each bank. The data source for these variables is the Statistics of Bank Management provided by the Korean Financial Supervisory Service. The summary statistics of all the variables used in our analysis are presented in table 1. Dividend payout ratio (DIV) measured as the total cash dividends divided by net income averages 0.1847, ranging form 0 to 1.4829. The total asset size (ASSET) ranges form 980 billion won to 274,366 billion won, averaging 43,178 billion won. The debt ratio (DEBT) measured as the total debt divided by total asset averages 0.9527, ranging form 0.8585 to 1.0619. The average loan-to-asset ratio (LOAN) is 0.4782, ranging from 0.2721 to 0.6910. Return on asset (ROA) averages -0.15, ranging from -10.19 to 3.05.
Before running the main regression estimation to examine the Korean banks’ dividend policy, we compute the correlation coefficients among the variables used in the study as a prerequisite test. Table 2 presents Pearson’s
correlation coefficient for the variables. It is shown that bank asset size and dividend payout ratio are positively correlated, however, it is not statistically significant. Regarding the correlations between the dividend payout ratio and the three main variables, it is shown that the bank payout ratio is significantly negatively correlated with the debt ratio and loan ratio. It is significantly positively correlated with ROA. The hypothesized relationships between bank payout ratio and these variables are discussed below.
Table 1. Summary statistics
Mean Median Standard Deviation Min Max
DIV 0.1847 0.1220 0.2214 0 1.4829 ASSET 431 783 229 441 555 040 9803 2743 669 DEBT 0.9527 0.9549 0.0209 0.8585 1.0619 LOAN 0.4782 0.4624 0.0889 0.2721 0.6910 ROA -0.15 0.40 1.94 -10.19 3.05 No. of observations 277 Sample period 1994-2009 Table 2. Pearson correlations
DIV ASSET DEBT LOAN ROA
DIV 1
ASSET 0.0039 1
DEBT -0.3355*** -0.0687 1
LOAN -0.0638* 0.3743*** -0.2017** 1
ROA 0.3147*** 0.1818** -0.5259*** 0.3544*** 1
*, **, *** indicate statistical significance at the 10, 5, or 1% significance level, respectively.
To identify the factors that can explain the dividend policy of Korean banks over the sample period of 1994-2009, the following two pooled time-series/cross-sectional panel regression equations are estimated, respectively. Standard OLS (ordinary least square) type of estimation for a pooled time-series/cross-sectional panel data set is known to causes a potential omitted latent-variable problem. This problem occurs when the individual-specific component of the error term is correlated with the regressors in the model. In this case the estimated coefficients are biased. To resolve this problem, we give fixed-effect specification to the model. Fixed effect estimation is known to generate unbiased estimates.
(DIV)i,t = β0+β1(ASSET)i,t+β2(DEBT)i,t+β3(LOAN)i,t+β4(NATLDUMMY)i,t+εi,t (1)
(DIV)i,t = β0+β1(ASSET)i,t+β2(ROA)i,t+β3(LOAN)i,t+β4(NATLDUMMY)i,t+εi,t (2)
Dependent variable of the regression model is the dividend payout ratio, defined as the cash dividends divided by net income. The explanatory variables for the banks’ dividend policy include asset size, debt ratio measuring the bank’s capital structure or financial strength, loan ratio measuring the bank’s asset portfolio composition and future growth prospects, and ROA representing bank profitability. In the above correlation test, the correlation between debt ratio and ROA was negatively very high (-0.5259***). To address for the possible multicollinearity problem between debt ratio and ROA, debt ratio and ROA are included as a separate explanatory variable in each regression. Lastly national bank dummy variable is included to control for the difference in the dividend policy between national banks and regional banks.
Because in the literature, the relationship between asset size and dividend policy is rather in controversy, we treat the three variables; debt ratio, loan ratio and ROA as the main explanatory variables of the regression analysis.The relationship between each explanatory variable and payout ratio is hypothesized as follows.
Considering the fact that the regulator of the banking industry monitors the capital adequacy measured as the capital ratio of the bank as the most important indicator of the bank soundness, it is expected that the higher the
debt ratio (the lower the capital ratio), the lower the payout ratio the bank will choose. Furthermore, the bank with higher debt ratio is under bigger pressure for cash expenditure due to current and future interest payments which would induce the bank to retain more earnings without paying them as dividends.
Loan-to-asset ratio is used as a measure of the opportunity for the bank’s future growth potential. Loan is the most important source of the bank’s earnings and profits, and therefore, a high loan ratio reflects positive and optimistic expectations about future economic conditions and profits by households and business sectors, who are the main users of the bank funds. Then, banks would increase retained earnings and decrease dividend payments in order to secure sources for more loans and anticipated future demand for funds.
ROA is included as a measure of the bank profitability. Other things being equal, the bank with higher profit would pay more dividends to shareholders.
3. Empirical Results
3.1 Full Sample Tests
First, the fixed-effect regression is estimated for the full sample over the sample period (1994-2009), and the results are provided in Table 3. The table shows that asset size has a negative coefficient in the estimation of both equations (1) and (2) unlike the correlation sign found above, however, it is not statistically significant. With respect to the three main explanatory variables, the table shows a significantly negative coefficient on the debt ratio (equation 1) and loan ratio (equation 2), and a significantly positive coefficient on the ROA (equation 2). National dummy has a significantly positive sign in the estimation of the equation 1, indicating that national banks tend to pay more dividends than regional banks.
Overall, the results for the full sample indicate that Korean banks tend to pay more dividends as the debt ratio gets lower, loan ratio gets lower, and bank profit gets higher. All of these results are consistent with our hypotheses in this paper. In other words, Korean banks appear to decrease dividends and increase retained earnings when their financial structures is weaker with high debt ratio, and when they have positive expectations regarding future growth prospects with high loan ratios, and when the bank’s current profitability is high. Table 3. Fixed-effect panel regression results for the full sample
Coefficient Standard error t- statistic
INTERCEPT 4.3003*** 0.6024 7.1382 ASSET -3.79×10⁻⁸ 3.13×10⁻⁸ -1.2132 DEBT -4.2633*** 0.6244 -6.8274 LOAN -0.1866 0.1689 -1.1047 NATLDUMMY 0.0879*** 0.0339 2.5916 R2 F-statistic 0.15 12.2418***
(DIV)i,t=β0+β1(SIZE)i,t+β2×(DEBT)i,t+β3(LOAN)i,t+β4×(NATDUMMY)i,t+εi,t
*, **, *** indicate statistical significance at the 10, 5, or 1% significance level, respectively.
Coefficient Standard error t- statistic
INTERCEPT 0.4201*** 0.0906 4.6363 ASSET -7.01×10⁻¹⁰ 3.12×10⁻⁸ -0.0224 DEBT 0.0437*** 0.0069 6.3220 LOAN -0.4878*** 0.1800 -2.7099 NATLDUMMY 0.0082 0.0333 0.2460 R2 F-statistic 0.13 10.5681***
(DIV)i,t=β0+β1(SIZE)i,t+β2×(ROA)i,t+β3(LOAN)i,t+β4×(NATDUMMY)i,t+εi,t
3.2 Partitioned Sample Tests Based on Bank Characteristics
We examine how the relationship between bank’s dividend policy and the explanatory variables is affected by the banks’ different financial and operational characteristics. For this analysis, the full sample is partitioned into two groups based on some characteristic variables which are importantly considered by the financial supervisory authority in assessing the soundness of bank. Then the above two regression equations are separately estimated for each group. The characteristic variables used to classify banks include capital ratio measuring the capital adequacy of individual bank, ROA representing profitability, and the ratio of non-performing loans measuring how the bank’s loan assets are deteriorated. For each characteristic variable, the full sample banks are partitioned into two groups each year. For example, in the case of partitioning based on the capital ratio, we classify the sample banks into two groups; the banks with capital ratios higher than the median value and the banks with capital ratios lower than the median. Then separate regressions are run for each group. The same process applies to the other two characteristic variables; ROA and non-performing loan ratio.
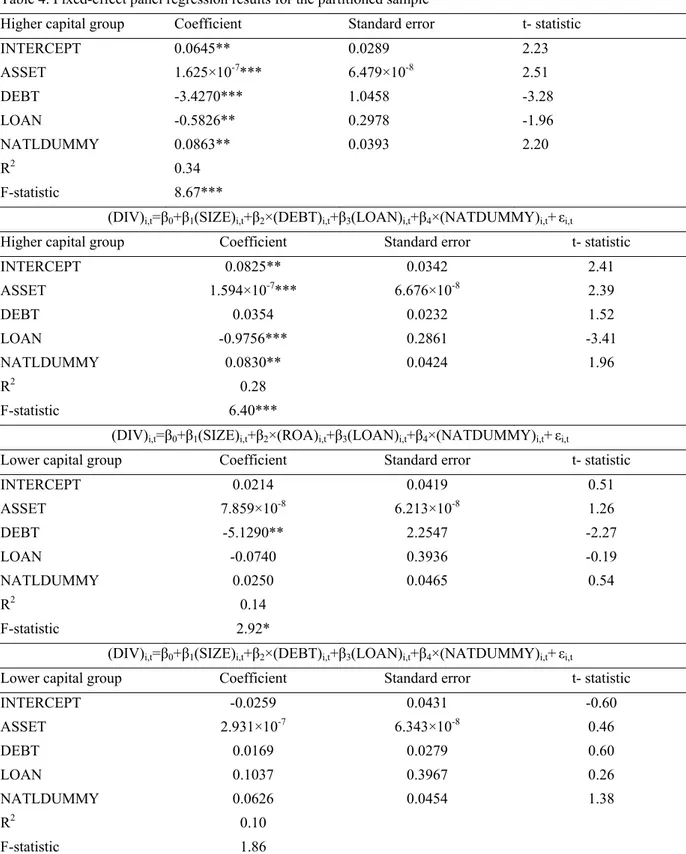
Table 4-6 presents the estimation results for the partitioned sample by bank characteristic variables. Table 4 presents the results for the partitioned sample by the capital ratio. It is shown from the table that the loan ratio has a significantly negative coefficient for the banks with higher capital ratios, but is not significant for the banks with lower capital ratios in both regressions. This result may suggest that the banks with healthier financial structures with higher capital ratios are willing to take advantage of growth opportunity more aggressively and positively by decreasing dividend payments and increasing retained earnings for the future investment and growth opportunities. On the other hand, the banks with lower capital ratios, which may be subject to higher regulatory pressure from the regulator, are not aggressively prepared as much as the banks with higher capital ratios for future growth opportunity,. They turn out to pay relatively more dividends out of earnings. In Regression Equation (2), ROA has a marginal significance at 13% level for the group with higher capital ratio, indicating that the tendency of the banks with higher profit to pay more dividend appears to be found more significantly for the banks with higher capital ratios. Asset size is also significant for the group with higher capital ratios in both equations. This implies that larger banks with healthier financial structures have a strong tendency toward higher dividend payout ratios. The coefficient on national dummy variable is also significantly positive only for the banks with higher capital ratio.
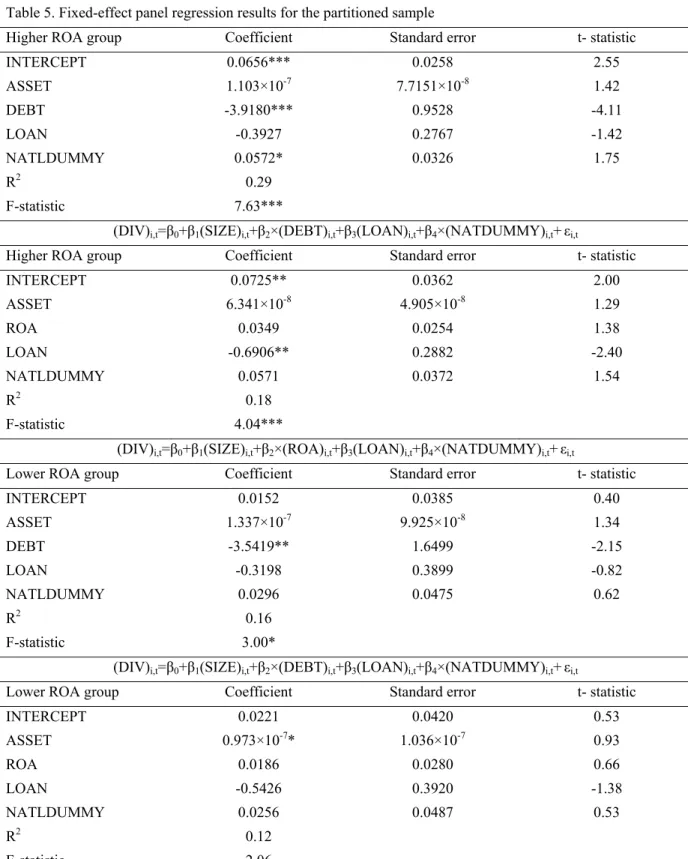
Table 5 presents the results for the partitioned sample by the ROA. It is shown from the table that loan ratio is significantly negative in the estimation of equation (2) for the group of banks with higher ROA. This result indicates that the tendency of the banks’ incentives to undertake growth opportunities more aggressively by decreasing dividend payments and increasing retained earnings when loan ratio is higher is more significantly observed within the group of the banks with higher ROA. National dummy is also positive only for the banks with higher ROA.
Table 6 presents the results for the partitioned sample by the ratio of nonperforming loans. It is shown that loan ratio is negative at 11% significance level in the estimation of equation (1) for the group of the banks with lower nonperforming loans. This result may suggest that the tendency of the banks’ incentives to undertake growth opportunities more aggressively by decreasing dividend payments and increasing retained earnings when loan ratio is higher is more significantly observed within the group of the banks with lower nonperforming loans. Overall, the estimation results for the partitioned sample based on bank characteristics show that the previously found results for the full sample between explanatory variables and payout ratio are more significantly observed within the group of the banks with higher capital ratio, higher ROA, and lower nonperforming loans. This result suggests that the banks in riskier and inferior positions in terms of the bank’s financial adequacy, profitability and the soundness of asset portfolio composition appear not to have consistent and systematic mechanism for dividend policy.
Table 4. Fixed-effect panel regression results for the partitioned sample
Higher capital group Coefficient Standard error t- statistic
INTERCEPT 0.0645** 0.0289 2.23 ASSET 1.625×10⁻⁷*** 6.479×10⁻⁸ 2.51 DEBT -3.4270*** 1.0458 -3.28 LOAN -0.5826** 0.2978 -1.96 NATLDUMMY 0.0863** 0.0393 2.20 R2 F-statistic 0.34 8.67***
(DIV)i,t=β0+β1(SIZE)i,t+β2×(DEBT)i,t+β3(LOAN)i,t+β4×(NATDUMMY)i,t+εi,t
Higher capital group Coefficient Standard error t- statistic
INTERCEPT 0.0825** 0.0342 2.41 ASSET 1.594×10⁻⁷*** 6.676×10⁻⁸ 2.39 DEBT 0.0354 0.0232 1.52 LOAN -0.9756*** 0.2861 -3.41 NATLDUMMY 0.0830** 0.0424 1.96 R2 F-statistic 0.28 6.40***
(DIV)i,t=β0+β1(SIZE)i,t+β2×(ROA)i,t+β3(LOAN)i,t+β4×(NATDUMMY)i,t+εi,t
Lower capital group Coefficient Standard error t- statistic
INTERCEPT 0.0214 0.0419 0.51 ASSET 7.859×10⁻⁸ 6.213×10⁻⁸ 1.26 DEBT -5.1290** 2.2547 -2.27 LOAN -0.0740 0.3936 -0.19 NATLDUMMY 0.0250 0.0465 0.54 R2 F-statistic 0.14 2.92*
(DIV)i,t=β0+β1(SIZE)i,t+β2×(DEBT)i,t+β3(LOAN)i,t+β4×(NATDUMMY)i,t+εi,t
Lower capital group Coefficient Standard error t- statistic
INTERCEPT -0.0259 0.0431 -0.60 ASSET 2.931×10⁻⁷ 6.343×10⁻⁸ 0.46 DEBT 0.0169 0.0279 0.60 LOAN 0.1037 0.3967 0.26 NATLDUMMY 0.0626 0.0454 1.38 R2 F-statistic 0.10 1.86
Table 5. Fixed-effect panel regression results for the partitioned sample
Higher ROA group Coefficient Standard error t- statistic
INTERCEPT 0.0656*** 0.0258 2.55 ASSET 1.103×10⁻⁷ 7.7151×10⁻⁸ 1.42 DEBT -3.9180*** 0.9528 -4.11 LOAN -0.3927 0.2767 -1.42 NATLDUMMY 0.0572* 0.0326 1.75 R2 F-statistic 0.29 7.63***
(DIV)i,t=β0+β1(SIZE)i,t+β2×(DEBT)i,t+β3(LOAN)i,t+β4×(NATDUMMY)i,t+εi,t
Higher ROA group Coefficient Standard error t- statistic
INTERCEPT 0.0725** 0.0362 2.00 ASSET 6.341×10⁻⁸ 4.905×10⁻⁸ 1.29 ROA 0.0349 0.0254 1.38 LOAN -0.6906** 0.2882 -2.40 NATLDUMMY 0.0571 0.0372 1.54 R2 F-statistic 0.18 4.04***
(DIV)i,t=β0+β1(SIZE)i,t+β2×(ROA)i,t+β3(LOAN)i,t+β4×(NATDUMMY)i,t+εi,t
Lower ROA group Coefficient Standard error t- statistic
INTERCEPT 0.0152 0.0385 0.40 ASSET 1.337×10⁻⁷ 9.925×10⁻⁸ 1.34 DEBT -3.5419** 1.6499 -2.15 LOAN -0.3198 0.3899 -0.82 NATLDUMMY 0.0296 0.0475 0.62 R2 F-statistic 0.16 3.00*
(DIV)i,t=β0+β1(SIZE)i,t+β2×(DEBT)i,t+β3(LOAN)i,t+β4×(NATDUMMY)i,t+εi,t
Lower ROA group Coefficient Standard error t- statistic
INTERCEPT 0.0221 0.0420 0.53 ASSET 0.973×10-7* 1.036×10-7 0.93 ROA 0.0186 0.0280 0.66 LOAN -0.5426 0.3920 -1.38 NATLDUMMY 0.0256 0.0487 0.53 R2 F-statistic 0.12 2.06
Table 6. Fixed-effect panel regression results for the partitioned sample
Lower NPL group Coefficient Standard error t- statistic
INTERCEPT 0.0245 0.0364 0.67 ASSET 7.638×10⁻⁸ 6.169×10⁻⁸ 1.24 DEBT -3.4593*** 1.1539 -2.99 LOAN -0.6335 0.3949 -1.60 NATLDUMMY 0.0001 0.0420 0.00 R2 F-statistic 0.24 4.44***
(DIV)i,t=β0+β1(SIZE)i,t+β2×(DEBT)i,t+β3(LOAN)i,t+β4×(NATDUMMY)i,t+εi,t
Lower NPL group Coefficient Standard error t- statistic
INTERCEPT 0.0292 0.0468 0.62 ASSET 4.002×10⁻⁷ 6.358×10⁻⁸ 0.63 ROA 0.0303 0.0284 1.07 LOAN -0.8710** 0.4071 -2.14 NATLDUMMY -0.0019 0.0479 -0.04 R2 F-statistic 0.16 2.61*
(DIV)i,t=β0+β1(SIZE)i,t+β2×(ROA)i,t+β3(LOAN)i,t+β4×(NATDUMMY)i,t+εi,t
Higher NPL group Coefficient Standard error t- statistic
INTERCEPT 0.0561** 0.0277 2.03 ASSET 0.090×10⁻⁷ 6.868×10⁻⁸ 1.31 DEBT -4.3123*** 1.2613 -3.42 LOAN -0.2821 0.2881 -0.98 NATLDUMMY -0.0284 0.0378 -0.76 R2 F-statistic 0.23 5.97***
(DIV)i,t=β0+β1(SIZE)i,t+β2×(DEBT)i,t+β3(LOAN)i,t+β4×(NATDUMMY)i,t+εi,t
Higher NPL group Coefficient Standard error t- statistic
INTERCEPT 0.0649* 0.0335 1.94 ASSET 0.549×10⁻⁷ 7.394×10⁻⁸ 0.74 ROA 0.0316 0.0254 1.25 LOAN -0.6092** 0.2894 -2.11 NATLDUMMY -0.0332 0.0397 -0.84 R2 F-statistic 0.15 3.61**
4. Summary and Concluding Remarks
This paper seeks to identify empirically the factors determining Korean banks’ dividend policy. Banking industry plays a pivotal role for the operation of a nation’s economy having a considerably lower probability of bankruptcy than other industries due to the assistance from deposit insurance system and possible injection of public funds at the time of financial adversity. Thus, the process of the banking industry’s dividend policy decision should be more transparent and efficient than the firms in other industries.
The results of the empirical analyses in this paper suggest that the dividend policy of Korean banks bears a very consistent and close relation to the banks’ financial healthiness, growth opportunity and profitability. More specifically, the Korean banks with higher debt ratios, and therefore, weaker capital adequacy tend to pay less dividends. The banks with higher loan ratios tend to pay less dividends and retain more earnings to undertake the future growth opportunities. Also, the banks with higher profitability appear to pay more dividends. The estimation results for the partitioned sample based on bank characteristics show that the above-found results for the full sample are more significantly observed within the group of the banks with higher capital ratio, higher profitability, and lower nonperforming loans. Thus, the banks in riskier and inferior positions in terms of the bank’s financial adequacy, profitability and the soundness of asset portfolio composition appear not to have consistent and systematic decision-making mechanisms for dividend policy.
References
Baker, H. K, Farreley, G. E., & Edelman, R. (1985). A Survey of Management View on Dividend Policy.
Financial Management, 78-84. http://dx.doi.org/10.2307/3665062
Crutchley, H., & Hansen, R. (1989). A Test of the Agency Theory of Managerial Ownership. Corporate Leverage and Corporate Dividend. Financial Management, 36-46. http://dx.doi.org/10.2307/3665795
Demsetz, R. S., & Strahan, P. E. (1997). Diversification, Size, and Risk at Bank Holding Companies. Journal of
Money, Credit, and Banking, 29, 300-313. http://dx.doi.org/10.2307/2953695
Galloway, T. M., Lee, W. B., & Roden, D. M. (1997). Banks’ Changing Incentives and Opportunities for Risk Taking. Journal of Banking and Finance, 21, 509-527. http://dx.doi.org/10.1016/S0378-4266(96)00052-0 Jensen, M. C., Solverg, D. P., & Zorn, T. S. (1992). Simultaneous Determination of Insider Ownership, Debt and
Dividend Policies. Journal of Financial and Quantitative Analysis, 517-529.
Linter, J. (1956). Distribution of Incomes of Corporations among Dividends, Retained Earnings and Taxes.
American Economic Review, 97-113.
Rozeff, M. (1981). Growth, Beta and Agency Cost as Determinants of Dividend Payout Ratios. Working Paper Series No. 80-11, University of Iowa.
Saunders, A., Strock, E., & Travlos, N. G. (1990). Ownership Structure, Deregulation, and Bank Risk Taking.
Journal of Finance, 2, 643-654. http://dx.doi.org/10.1111/j.1540-6261.1990.tb03709.x
Copyrights
Copyright for this article is retained by the author(s), with first publication rights granted to the journal.
This is an open-access article distributed under the terms and conditions of the Creative Commons Attribution license (http://creativecommons.org/licenses/by/3.0/).