Contents lists available atScienceDirect
Nuclear Materials and Energy
journal homepage:www.elsevier.com/locate/nmeModelling of tungsten erosion and deposition in the divertor of JET-ILW in
comparison to experimental findings
A. Kirschner
a,⁎, S. Brezinsek
a, A. Huber
a, A. Meigs
b, G. Sergienko
a, D. Tskhakaya
c,d, D. Borodin
a,
M. Groth
e, S. Jachmich
b, J. Romazanov
a, S. Wiesen
a, Ch. Linsmeier
a, JET contributors
f,1aForschungszentrum Jülich GmbH, Institut für Energie- und Klimaforschung – Plasmaphysik, Partner of the Trilateral Euregio Cluster (TEC), Jülich 52425, Germany bCCFE, Culham Science Centre, Abingdon, Oxon OX14 3DB, UK
cInstitute of Applied Physics, TU Wien, Fusion@ÖAW, Vienna A-1040, Austria dAndronikashvili Institute of Physics, Tbilisi 0177, Georgia
eAalto University, Otakaari 1, Espoo 02150, Finland
fEUROfusion Consortium JET, Culham Science Centre, Abingdon OX14 3DB, UK
A R T I C L E I N F O Keywords:
Erosion & Deposition Tungsten
Sputtering Impurity transport JET-ILW
A B S T R A C T
The erosion, transport and deposition of tungsten in the outer divertor of JET-ILW has been studied for an H-Mode discharge with low frequency ELMs. For this specific case with an inter-ELM electron temperature at the strike point of about 20 eV, tungsten sputtering between ELMs is almost exclusively due to beryllium impurity and self-sputtering. However, during ELMs tungsten sputtering due to deuterium becomes important and even dominates. The amount of simulated local deposition of tungsten relative to the amount of sputtered tungsten in between ELMs is very high and reaches values of 99% for an electron density of 5E13 cm−3at the strike point and electron temperatures between 10 and 30 eV. Smaller deposition values are simulated with reduced electron density. The direction of the B-field significantly influences the local deposition and leads to a reduction if the E × B drift directs towards the scrape-off-layer. Also, the thermal force can reduce the tungsten deposition, however, an ion temperature gradient of about 0.1 eV/mm or larger is needed for a significant effect. The tungsten deposition simulated during ELMs reaches values of about 98% assuming ELM parameters according to free-streaming model. The measured WI emission profiles in between and within ELMs have been reproduced by the simulation. The contribution to the overall net tungsten erosion during ELMs is about 5 times larger than the one in between ELMs for the studied case. However, this is due to the rather low electron temperature in between ELMs, which leads to deuterium impact energies below the sputtering threshold for tungsten.
1. Introduction
Tungsten (W) is used in present fusion devices and is foreseen for future ones as plasma-facing material as it has a high melting point and, compared to other wall material candidates, low sputtering yields and high threshold energy for sputtering. However, eroded tungsten parti-cles will not be fully ionised within the core plasma and therefore even small amounts can lead to plasma dilution and radiation cooling, which finally can result in the termination of the discharge [1]. Thus, the processes determining the net erosion source from tungsten wall com-ponents have to be understood adequately to minimise the tungsten concentration in the core plasma.
As a high-Z material, the deposition of eroded tungsten is expected to be high[2, 3], which can lead to significantly smaller net erosion
compared to the gross erosion. The measurement of the tungsten ero-sion source in fuero-sion devices is typically done in-situ by spectroscopy of the tungsten emission. This primarily involves the observation of WI emission from W atoms to quantify the gross erosion. To extract the gross erosion particle flux from the WI emission, conversion factors (S/ XB values) are needed[4]. The WII emission of ionised W+can be used to approximate the deposition and thus the net erosion[5]. The exact net erosion only can be measured in most situations by post-mortem analysis, for instance using specific marker probes, and therefore typi-cally involves campaign-integrated plasma conditions. The simulation of the gross erosion, the transport of eroded tungsten through the plasma, its deposition and related tungsten emission within the plasma is thus an essential part to interpret and understand the experimental observations.
https://doi.org/10.1016/j.nme.2019.01.004
Received 13 August 2018; Received in revised form 4 January 2019; Accepted 4 January 2019 ⁎Corresponding author.
E-mail address:[email protected](A. Kirschner).
1See author list of “X. Litaudon et al. 2017 Nucl. Fusion 57 102001″.
Available online 09 January 2019
2352-1791/ © 2019 The Authors. Published by Elsevier Ltd. This is an open access article under the CC BY-NC-ND license (http://creativecommons.org/licenses/BY-NC-ND/4.0/).
The present contribution focuses on the tungsten erosion of the bulk tungsten low field side plate in the outer divertor of JET-ILW during a specific discharge with low frequency ELMs. The gross erosion is observed spatially-resolved along the low field side plate in-between and within ELMs by means of monitoring the WI emission. According ERO simula-tions are performed to reproduce the measured profiles of WI emission and to simulate the amount of tungsten deposition at the low field side plate and finally the resulting net erosion and deposition profiles along the low field side plate. Plasma parameters according to Langmuir probe measurements are used for the simulations, however, parameter studies to analyse their influence will be presented. Finally, the effect of the thermal force and the direction of the magnetic field on the amount of local tungsten deposition on the low field side plate is investigated.
2. Tungsten erosion measurements in JET-ILW
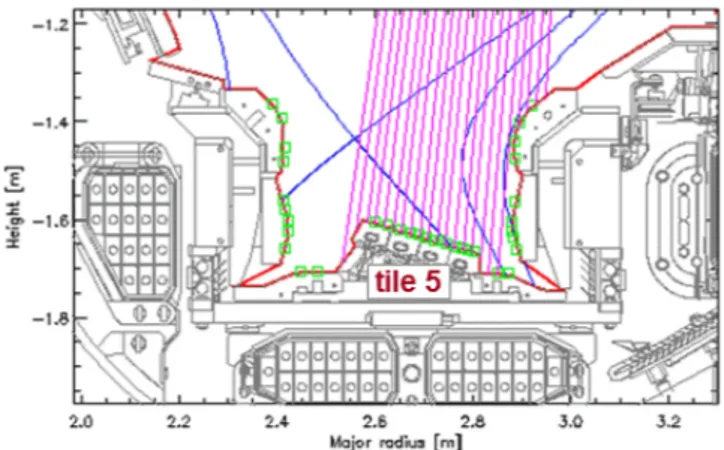
Within the present work the erosion of tungsten along the low field side plate (outer divertor tile 5) in an H-Mode discharge is studied. A poloidal cross section of the JET-ILW divertor is shown inFig. 1with tile 5 labelled. The respective pulse #82237 from the first ITER-Like Wall campaign 2011–2012 (ILW1) has been operated with Neutral Beam Injection (NBI) of about 13 MW and exhibits ELMs with a rather low frequency of about 10 Hz. The tungsten gross erosion has been monitored with a spectroscopic system (KT3)[6]consisting of 20 lines of sight viewing from top of the vessel and covering 360 mm of the outer divertor and in particular the whole tile 5, seeFig. 1. The system has a time resolution of 40 ms and comprises a wavelength range from 395 – 409 nm for the pulse under question. The typical accuracy of the measurements is about 20%. Due to the low ELM frequency in pulse #82237, the time resolution of the system is sufficient to resolve and distinguish light emission originating from the intra- and the inter-ELM phases of that specific pulse. More information of W erosion measure-ments at JET-ILW can be found e.g. in[7–10].
Fig. 2shows exemplarily a time trace of the measured WI emission at 400.9 nm between 14.5 and 16.5 s of the discharge taken at the major radial position R = 2.69 m. Also shown is the time trace of the BeII (527 nm) emission from the inner divertor, which typically is used to identify and discriminate the inter- and intra-ELM phases and which confirms the low frequency of 10 Hz for the ELMs. It is seen, that the maxima in the WI emission correlate well with the ones of the BeII emission, which demonstrates enhanced WI emission and thus tungsten gross erosion during ELMs. The WI intensities of the ELMs and of the inter-ELM phases result from averaging, i.e. according to the example of Fig. 2the sum of the 18 maxima of WI emission divided by 18 corre-sponds to the average ELM emission and similarly the average
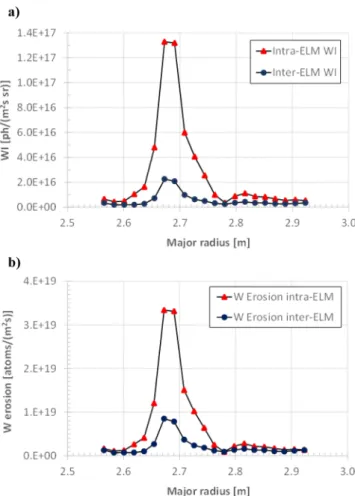
inter-measured photon intensity during ELM is multiplied with 0.04 s (the time resolution of the KT3 spectroscopy, which is larger than the ELM duration) to get the erosion of one ELM, which is then multiplied with 10, the number of ELMs within one second. A correction (reduction by about 15% at the maximum of the light emission profile) due to light collected by KT3 within the 0.04 s resolution originating from inter-ELM conditions has been neglected here. To receive the inter-inter-ELM erosion within one second no further correction is needed as the intra-ELM phase is much smaller than the phase in-between intra-ELMs. The re-sulting W gross erosion profiles along tile 5 are shown inFig. 3(b). At the maximum, the gross erosion within ELMs is about 4 times larger than in-between ELMs.
3. Simulation of tungsten erosion in JET-ILW
The three dimensional Monte-Carlo impurity transport and plasma-wall interaction code ERO[11]is used for the simulations. Within a given background plasma the code calculates the gross tungsten erosion along the divertor tile due to deuterium and beryllium ions. The im-pinging deuterium flux ΓD+is calculated from the density and tem-perature according to
= +
+ n ·[k·(Te T)/m ] ·cos( )i
D e D0.5 B (1)
with ne, Tethe electron density and temperature, Tithe ion tempera-ture, mDthe mass of deuterium, αB(88° assumed) the angle between the tile surface normal and the magnetic field lines and the assumption Te= Ti. Within the current work the details of the electric sheath characteristics in the vicinity of the tile surface are not considered, and thus ne, Teand TifromEq. (1)are assumed to be the values present at the sheath entrance, which is assumed to be located at the surface. However, the sheath and pre-sheath electric fields are taken into ac-count as described for instance in ref.[11]. The impinging beryllium flux is calculated as a percental amount of the deuterium flux assuming a typical value of 0.5% within the outer divertor of JET-ILW[12].
Sputtering yields for tungsten by the background species D+and Be2+(charge state two assumed for beryllium ions) are calculated by SDTrimSP[13]. For inter-ELM conditions an average impact angle of 60° relative to the surface normal and Maxwellian distributed pro-jectiles are assumed. The assumption of 60° for the impact angle is based on dedicated ERO simulations, where background species have been followed until reaching a surface. These simulations result in mean impact angles of about 60° for typical plasma parameters used within the present work for inter-ELM conditions. Also, the sheath potential of 3kTecontributing to the impact energy is considered. Ac-cording to the free streaming model in ref.[14, 10], mono-energetic projectiles with energies around 1 keV are assumed for intra-ELM conditions. An impact angle of 85° relative to the surface normal is used and thus movement nearly along the magnetic field lines. As for the inter-ELM conditions this impact angle is the outcome from dedicated ERO simulations.Fig. 4summarises the resulting sputtering yields and the spectroscopic system KT3 are shown (in magenta) together with the
mag-netic field configuration (in blue) of pulse #82237 and the locations of the Langmuir probes (in green). (For interpretation of the references to colour in this figure legend, the reader is referred to the web version of this article.)
shows that tungsten sputtering in-between ELMs is dominated or even exclusively by beryllium ions whereas deuterium can significantly sputter tungsten during ELMs. For instance, at 1 keV impact energy and 0.5% Be2+, the amount of sputtered W atoms due to D+is about five times larger than due to Be2+.
The transport of sputtered W atoms is simulated taking into account ionisation, friction with the background plasma flow, thermal forces and Lorentz force in the electro-magnetic field[11]. Details about the calculations of the radial and parallel (to the magnetic field) electric
fields and the background flow velocity profile along the magnetic field can be found in[11]. Ionisation rates for tungsten atoms are taken from [15]and photon emission coefficients for WI (400.9 nm) light emission are based on calculations with the kinetic code GKU, see[16]and re-ferences therein. Sputtered W particles can return to the tile surface where they can sputter new atoms by self-sputtering, be deposited or reflected – the latter processes are determined by reflection coefficients from SDTrimSP. Also, beryllium background ions can be reflected at the tile surface and possibly return to the surface and thereby sputter ad-ditional tungsten atoms from the surface.
Fig. 2. Time trace of the WI emission (400.9 nm) between 14.5 and 16.5 s of JET-ILW pulse #82237 at major radial position R = 2.69 m in the outer divertor. For comparison and ELM identification the time trace of the BeII emission in the inner divertor is shown.
Fig. 3. (a) Profiles of measured WI emission along tile 5 for intra- and inter-ELM phases within pulse 82237. (b) Profiles of deduced W gross erosion within one second along tile 5 for the intra- and inter-ELM phases within pulse 82237.
Fig. 4. Sputter yields based on SDTrimSP calculations for D+and Be2+ions impinging on tungsten: (a) inter-ELM and (b) intra-ELM conditions.
The set-up used for the simulations is presented inFig. 5. A mag-netic field of 2 T is used with field lines lying within the flux surfaces and an angle of 88° between field line and normal of the surface. As indicated inFig. 5the plasma parameters (Te, Tiand ne) within a po-loidal cross section above tile 5 are defined by their values at the strike point and decay exponentially towards the scrape-off-layer (SOL) and the private flux region (PFR). No variation of the plasma is considered along the toroidal direction and within the flux surfaces. The decay lengths are extracted from ELM-averaged Langmuir probe measure-ments, which have been fitted by exponential functions. The results are summarised inTable 1. The values of the temperature (with Teand Ti assumed to be equal) and density at the strike points according to ELM-averaged conditions are 30 eV and 5E13 cm−3, however, some varia-tions will be done for the simulavaria-tions to study their influence. These data corresponding to ELM-averaged measurements are used for the inter-ELM phases. Following the free-streaming model and ELM-re-solved plasma parameter measurements[14, 10], the temperature for intra-ELM conditions is similar as within the phases between ELMs. Thus, for the simulations of W erosion within ELMs the temperatures Te,ifrom the ELM-averaged conditions will be applied. The density within ELMs, however, is higher than in-between ELMs and therefore here a value of 1E14 cm−3at the strike point is assumed. This is in line with the discussion in reference[10]. As mentioned before, the energy of impinging deuterium ions is assumed to be ED+= 1 keV at the strike point, which is in line with the free-streaming model and related to the high pedestal temperature. Beryllium ions are assumed to be therma-lized with respect to the velocity of the deuterium ions and thus have an impact energy of EBe2+= mBe/mD·ED+. Also for the ELM phases ex-ponential decays are assumed for the decay of plasma parameters to-wards PFR and SOL applying the same decay lengths as for the inter-ELM phases and, as a variation, 1.5 times larger ones according to the observed broadening of the plasma profiles during ELMs[17]. 3.2. Tungsten erosion in between ELMs: simulation vs. experiment
The simulated profiles of tungsten gross-erosion, deposition and self-sputtering along tile 5 for inter-ELM conditions (30 eV and 5E13 cm−3at the strike point) are shown inFig. 6. About 99.2% of the sputtered tungsten is deposited on tile 5, leading to maximum net erosion, which is about 25 times smaller than the gross erosion. The
simulations also show that tungsten self-sputtering contributes with about 25% to the overall gross erosion.
The results of some parameter variations are summarised inTable 2. In general it is seen that for normal B field direction and applying a formula from literature for the ion temperature gradient ∇Ti(l) along
the magnetic field [18] to calculate the thermal force Ftherm (see equations (2)), the tungsten deposition on tile 5 increases with in-creasing electron density and temperature.
= + T l q T q l T ( ) · (0) · 1 7 2 (0) i i i 0 0 5/2 0 0 7/2 5/7 (2a) = Ftherm( )l · T li( ) (2b) = + µ Q µ µ µ µ 31 5 2 · (1.1 0.35 ) 2.6 2 5.4 2 2.5 1.5 2 (2c)
where l is the distance to the target along the magnetic field, q0the parallel power flux density at the target, κ0a parameter to describe the parallel heat conduction of electrons and μ = mI/(mI+ mD) with mDthe
mass of deuterium and mIthe mass of impurity atoms, i.e. tungsten or
beryllium, and Q the charge state of impurity ions.
Reversal of the magnetic field direction usually leads to decreased tungsten deposition on the tile 5 as the ExB drift then drives tungsten particles, which are eroded at the right end of tile 5, towards the SOL. However, this decrease in the deposition is not seen in the case of low electron temperature (10 eV at the strike point) as in this case the ex-ponential decay results in too low electron temperature at the right end of the target for significant tungsten sputtering. The influence of the thermal force Fthermon the tungsten deposition has been studied ap-plying instead of the formula from literature a constant value of 0.1 eV/ mm for the ion temperature gradient along the magnetic field for two of the studied cases (5E13 cm−3and 30 or 20 eV). The simulations reveal that the fixed temperature gradient of 0.1 eV/mm leads in both cases
Table 1
Exponential decay lengths (along radial direction) for plasma density and temperature during inter-ELM phases towards PFR and SOL.
PFR SOL
ne 24 mm 59 mm
Te,i 20 mm 500 mm
point). Table 2
Parameter studies for the inter-ELM phase studying the effect on the tungsten deposition on tile 5. In case of “formula” the Tigradient used in the ERO si-mulation is calculated according to the formula (2a), also provided in[18].
Te(eV) at
strike point ne(cm
−3) at
strike point Tthermal forceigradient for Amount of W deposition integratedover tile 5 Normal B Reversed B 30 5E13 formula 99.2% 93.9% 0.1 eV/mm 91.7% 89.2% 20 5E13 formula 98.8% 95.0% 0.1 eV/mm 93.7% 84.3% 10 5E13 formula 98.4% 98.5% 20 1E13 formula 95.6% 60.7%
for both magnetic field directions to significant reductions of the tungsten deposition on tile 5.
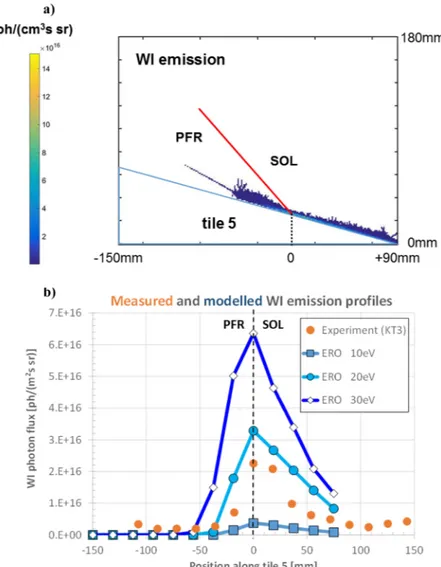
From the simulated tungsten WI emission – Fig. 7(a) shows ex-emplarily the 2D WI distribution above tile 5 for the case of 30 eV and 5E13 cm−3at the strike point – profiles along tile 5 have been gener-ated and are compared to the experimental emission inFig. 7(b). For this the WI emission from the 2D distribution has been integrated along the experimental line-of-sights shown inFig. 1. Very good agreement (shape and absolute values) with the experimental profile is obtained for the case of 20 eV and 5E13 cm−3. It has to be noted that the ERO simulations do not need an S/XB value to produce the WI emission. In fact, the simulations can deliver an effective S/XB value by dividing the simulated gross erosion flux and the corresponding WI photon flux (and 4π as the photon flux is given per sr). Taking, for instance, the flux values at the strike point results in an effective S/XB value of 50 for the simulation case of 20 eV and 5E13 cm−3. This value is smaller than the “purely spectroscopic” S/XB of 69 resulting from the ratio of ionisation rate and photon emission coefficient at 20 eV and 5E13 cm−3. The reason for this deviation can be found in the reflection of W particles, which contribute additional photons and just reduce the S/XB. More-over, the simulation is done in a spatially varying plasma in contrast to constant conditions for the “purely spectroscopic” value.
3.3. Tungsten erosion within ELMs: simulation vs. experiment
ELMs have typically strongly dynamic and thus time varying
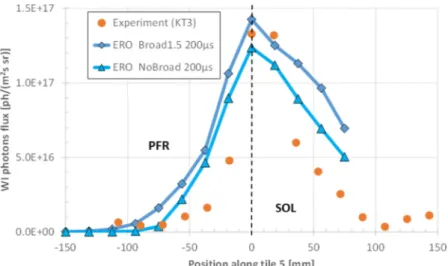
characteristics. However, no detailed description of the dynamics of the plasma parameters during ELMs is available. Therefore for the ERO simulations constant plasma parameters are assumed during ELMs. These plasma parameters are applied for a certain effective ELM duration teff,ELM, which is chosen in such way that the resulting simu-lated WI emission in the maximum matches the experimental one. As the best match between simulation and experiment for the inter-ELM phase has been achieved for the case of Te= 20 eV, this value is also used for the electron temperature within ELMs according to the refer-ences[14, 10]and the remarks inSection 3.1. As discussed before, the electron density is increased to 1E14 cm−3and the deuterium ion im-pact energy is set to 1 keV. ERO simulations for ELMs with these plasma parameters have been performed applying the exponential plasma decay lengths λ from the inter-ELM phases (seeTable 1) and also 1.5 times larger ones.Fig. 8presents the resulting simulated profiles of WI emission. For this, an effective ELM duration teff,ELM= 200 µs (which is smaller than the real ELM duration of about 1 ms) has been applied. Also, to compare with the measured profile, the simulated profiles correspond to the WI emission of one ELM, which is then divided by 40 ms, the time resolution of the KT3 spectroscopic system. It is seen in Fig. 8that the simulated profile even without broadened decay lengths is wider than the measured one. From the erosion and deposition results it is seen that about 98% of eroded tungsten is deposited on tile 5, particles which are not locally deposited are transported into the di-rection of the SOL. The simulated gross erosion, integrated over tile 5, during ELM is about two times larger than the one in-between ELMs.
Fig. 7. (a) Simulated WI emission distribution above tile 5 for the case of 30 eV and 5E13 c−3at the strike point. (b) Simulated profiles of WI emission along tile 5 for a density of 5E13 cm−3and three different electron temperatures at the strike point.
The resulting net erosion profiles during and in-between ELMs are shown inFig. 9– for comparison the intra-ELM profile is related to the ELM erosion within 1 s and is thus related to 10 ELMs. The simulated net-erosion, again integrated over tile 5, is about 4 times larger for ELMs compared to the net erosion in-between ELMs.
4. Summary and conclusions
Simulations of tungsten erosion, transport of the eroded particles and deposition have been done with ERO for a specific pulse at JET-ILW. The measured profiles of WI emission along the outer divertor tile 5 could be reproduced for inter- and intra-ELM conditions. It has been found that in-between ELMs deuterium ions have too low energy for tungsten sputtering and thus only beryllium impurity ions lead to tungsten erosion. In contrast, during intra-ELM phases the sputtering is dominated by deuterium ions, which are assumed to have high impact energy due to the ELMs. Reflected beryllium from the background and tungsten self-sputtering largely contribute to the gross erosion during and in-between ELMs. Large fractions of up to 99% from the eroded tungsten are deposited on tile 5 for the cases studied. The resulting net
erosion is about 4 times larger for intra-ELM compared to inter-ELM conditions.
Further dedicated experiments at JET-ILW are planned to be used for simulation benchmarking, which also will include plasma parameter variations. Also, the usage of updated ADAS data for tungsten ionisation and excitation, plasma backgrounds from edge codes as input for ERO and the consideration of WII emission is envisaged for future studies. Finally, the resolved sheath characteristics from PIC modelling will be applied in the simulations. First attempts for inter-ELM conditions in-dicate a reduction of the simulated tungsten deposition, see e.g.[19].
Acknowledgements
This work has been carried out within the framework of the EUROfusion Consortium and has received funding from the Euratom research and training programme 2014–2018 under grant agreement No 633053. The views and opinions expressed herein do not necessarily reflect those of the European Commission. This work has been per-formed under EUROfusion WP PFC.
The authors would like to thank Gerard van Rooij for fruitful dis-cussions.
References
[1] A. Loarte, et al., Nucl. Fusion 47 (2007) S203. [2] D. Naujoks, et al., Nucl. Fusion 36 (6) (1996) 671.
[3] A. Kirschner, et al., Contrib. Plasma Phys. 56 (6-8) (2016) 622. [4] A. Pospieszczyk, Trans. Fusion Sci. Technol. 45 (2004) 426. [5] S. Brezinsek, et al., Phys. Scr. T145 (2011) 014016. [6] A. Meigs, et al., Rev. Sci. Instrum. 81 (2010) 10E532. [7] G.J. van Rooij, et al., J. Nucl. Mat. 438 (2013) S42.
[8] G.J. van Rooij, et al., Characterization of tungsten sputtering in the JET divertor, Proc. 24th IAEA Fusion Energy Conf. (FEC2012, San Diego, USA, 2012. [9] N. Den Harder, et al., Nucl. Fusion 56 (2016) 026014.
[10] C. Guillemaut, et al., Phys. Scr. T167 (2016) 014005. [11] A. Kirschner, et al., Nucl. Fusion 40 (5) (2000) 989. [12] S. Brezinsek, J. Nucl. Mat. 463 (2015) 11.
[13] W. Eckstein, et al., SDTrimSP: Aa Monte-Carlo code for calculating collision phe-nomena in randomized targets, (2007) Report IPP 12/3.
[14] W. Fundamenski, et al., Plasma Phys. Contrib. Fusion 48 (2006) 109. [15] L.A. Vainstein, et al., J. Phys. B 44 (2011) 125201.
[16] D. Kondratyev, et al., J. Nucl. Mat. 438 (2013) S351. [17] T. Eich, J. Nucl. Mat. 415 (2011) S856.
[18] P.C. Stangeby, J.D. Elder, Nucl. Fusion 35 (1995) 1391.
[19] A. Kirschner, et al., Plasma Phys. Contrib. Fusion 60 (2018) 014041.
Fig. 8. Simulated profiles of WI emission along tile 5 during ELM in comparison with the measured one. An effective ELM duration of 200 µs has been applied in the simulations. Simulated profiles are shown with (Broad1.5) and without (NoBroad) broadened decay lengths for the plasma parameters.
Fig. 9. Simulated net erosion profiles along tile 5 for intra- and inter-ELM conditions.