Article
Hand Gesture Recognition Based on Auto-Landmark
Localization and Reweighted Genetic Algorithm for Healthcare Muscle Activities
Hira Ansar1, Ahmad Jalal1, Munkhjargal Gochoo2and Kibum Kim3,*
Citation: Ansar, H.; Jalal, A.; Gochoo, M.; Kim, K. Hand Gesture
Recognition Based on
Auto-Landmark Localization and Reweighted Genetic Algorithm for Healthcare Muscle Activities.
Sustainability2021,13, 2961.
https://doi.org/10.3390/su13052961
Academic Editor: Gwanggil Jeon
Received: 10 February 2021 Accepted: 5 March 2021 Published: 9 March 2021
Publisher’s Note:MDPI stays neutral with regard to jurisdictional claims in published maps and institutional affil- iations.
Copyright: © 2021 by the authors.
Licensee MDPI, Basel, Switzerland.
This article is an open access article distributed under the terms and conditions of the Creative Commons Attribution (CC BY) license (https://
creativecommons.org/licenses/by/
4.0/).
1 Department of Computer Science, Air University, Islamabad 44000, Pakistan;
[email protected] (H.A.); [email protected] (A.J.)
2 Department of Computer Science and Software Engineering, United Arab Emirates University, Al Ain 15551, United Arab Emirates; [email protected]
3 Department of Human-Computer Interaction, Hanyang University, Ansan 15588, Korea
* Correspondence: [email protected]
Abstract:Due to the constantly increasing demand for the automatic localization of landmarks in hand gesture recognition, there is a need for a more sustainable, intelligent, and reliable system for hand gesture recognition. The main purpose of this study was to develop an accurate hand gesture recognition system that is capable of error-free auto-landmark localization of any gesture dateable in an RGB image. In this paper, we propose a system based on landmark extraction from RGB images regardless of the environment. The extraction of gestures is performed via two methods, namely, fused and directional image methods. The fused method produced greater extracted gesture recognition accuracy. In the proposed system, hand gesture recognition (HGR) is done via several different methods, namely, (1) HGR via point-based features, which consist of (i) distance features, (ii) angular features, and (iii) geometric features; (2) HGR via full hand features, which are composed of (i) SONG mesh geometry and (ii) active model. To optimize these features, we applied gray wolf optimization. After optimization, a reweighted genetic algorithm was used for classification and gesture recognition. Experimentation was performed on five challenging datasets: Sign Word, Dexter1, Dexter + Object, STB, and NYU. Experimental results proved that auto landmark localization with the proposed feature extraction technique is an efficient approach towards developing a robust HGR system. The classification results of the reweighted genetic algorithm were compared with Artificial Neural Network (ANN) and decision tree. The developed system plays a significant role in healthcare muscle exercise.
Keywords:directional image; geodesic distance; gray wolf optimization; hand gesture recognition;
landmark localization; reweighted genetic algorithm; saliency map
1. Introduction
Recent developments in artificial intelligence and digital technologies have provided several effective ways to communicate in terms of human–computer interaction (HCI).
When gestures are made by human body movements, physical actions of fingers, hands, arms, head, and face are recognized by the receiver—this methodology is termed human gesture recognition (HGR) [1–4]. HGR has wide-ranging applications such as communica- tion with and between deaf people, as well as interactions between young children and patients using a PC [5–7]. For rehabilitation purposes, healthcare centers provide hand muscle exercise in which HGR plays a vibrant role. According to the World Health Organi- zation (WHO), 15 million people suffer from stroke and 50,000 people suffer from spinal cord injuries. They affect individuals’ upper limb function and also leads to long-term disabilities. Rehabilitation strategy is an essential method for upper limb recovery. HGR is used to perform rehabilitation gestures, and also daily gestures can be recognized [8].
Sustainability2021,13, 2961. https://doi.org/10.3390/su13052961 https://www.mdpi.com/journal/sustainability
Gestures are extensively characterized as static and dynamic in a natural way of communication [9]. A static gesture is seen at the spurt of time, whereas a dynamic gesture changes with a time frame. The static gestures are specific transition phases in a dynamic gesture that display as specific action or gesture. The gesture can be inferred by a vision- based system and data-glove-based system collected via (i) camera, (ii) sensors, and (iii) gloves [10]. The sensors and gloves measure the angles of the joint and the positions of a finger in real time. The use of gloves and sensors adds a certain burden to the user, and the weight of cables can hinder the movement of the hand, which affects accuracy when measuring gestures. On the other hand, one or more cameras can be used to capture images of gestures performed by an individual. The camera collects static gestures, which are used to train the machine for recognition; for this purpose, only a sufficient dataset is required [11–14].
In this paper, we propose an effective method to extract gestures from RGB images.
First of all, preprocessing was performed on all the images. Then, the hand was segmented from the background by two methods, one being a fused method and the other being a directional images method. Both of these methods extracted the hand from the background successfully, but after a comparison of the two methods, the fused method gave better results and was used for further processing. In the second step, landmarks were extracted via color quantization. These landmarks were then used for feature extraction. In this paper, we extracted different features for the accurate recognition of gestures, i.e., angular features, geometric features, and mesh geometry. Those features were optimized and then classified via a genetic algorithm into gestures. The five datasets used for experimentation are named Sign Word, Dexter1, Dexter + Object, STB, and NYU datasets. The proposed system produced significantly better recognition accuracy compared with other state-of- the-art methods.
The main contributions of the paper can be summarized as follows:
• We extracted the hand via a fused method technique from RGB images for gesture classification.
• Auto-landmark localization was performed for multi-feature extraction to improve the feature selection process for daily gestures.
• Multi-features were then optimized via a gray wolf algorithm and classified with a weighted genetic algorithm.
• A comprehensive evaluation was performed on three datasets with significantly better performance than other state-of-the-art methodologies.
The rest of the paper is organized as follows. In Section2, the literature review is presented on the basis of two main categories of HGR feature extraction and recognition.
Section3addresses the proposed HGR model, which includes angular, geometric, and mesh geometry-based features; gray wolf optimization; and the genetic algorithm as a classifier. Section4discusses the experimental setup and a comparison of the proposed method with other state-of-the-art methods. Finally, Section5presents the conclusion and future work.
2. Literature Review
2.1. HGR Through Electromyographic Signals
Human gesture recognition is applied in many research areas because the accurate classification of hand gesture electromyography (EMG) signals provides accurate gesture recognition results [15]. However, the collection of features and the labeling of the large datasets consumes a large amount of processing time. Su et al. [16] proposed a novel method in which they combined depth vision learning and EMG for hand gesture recogni- tion. The system labels data without considering the sequence of hand motion via depth vision learning. The hierarchical k-means (HK-mean) algorithm is used to classify 10 hand gestures using a Myo armband. Motoche et al. [17] used superficial EMG for hand gesture recognition. They applied a sliding window approach; a sub-window is applied to observe signal segments through the main window. The acquired data using Myo armband is then
applied to preprocess for rectification and filtering. After that, they extracted features from the feature vector and the results from the functions. They used a feedforward neural network for classification and obtained 90.7% recognition accuracy. Sapienza et al. [18]
presented a model with minimum complexity based on the average threshold crossing (ATC) technique. Four movements of the wrist: flexion, extension, abduction, and grasp were detected after the acquisition of signals from EMG. The signal threshold-crossing event number was exploited and then the average ATC classifier produced 92.87% accuracy.
Arenas et al. [19] collected data via eight Myo armband sensors with the use of a power spectral density map. For classification, they built a feature set consisting of 2880 multi- channel feature maps, which were divided into three equal sets for training, validation, and testing. Convolutional neural networks (CNNs) obtained 98% accuracy in validation and 99% in testing. Benalcazar et al. [20] identified the labels of hand movements in real time. Their model collected hand movements from a Myo armband, and they used a window-based approach to make feature vectors. For classification, they usedk-nearest neighbor and a time wrapping algorithm, which achieved 89.5% accuracy. Qi et al. [21]
reduced the redundancy of EMG signals and enhanced real-time gesture recognition. They used principal component analysis and General Regression Neural Network (GRNN) for the construction of a gesture recognition system. The authors collected nine static gestures using an electromyographic instrument for the extraction of four kinds of signals. After dimension reduction, accuracy reached to 95.1%
2.2. HGR through Smartphone
The pioneering works of hand gesture recognition through smartphones explored different sensing technologies and feature extraction methods for the improvement of recognition accuracy [22]. Wang et al. [23] used a smartphone as an active sonar sensing system for hand movement recognition. The ultrasonic signal emitted by speakers and the phone’s microphone receives an echo that is changed by hand movements. The gesture is identified from the recorded signals. Haseeb et al. [24] introduced a novel machine learning solution for hand gesture recognition. They relied on standard Wi-Fi signals, thresholding filters, and recurrent neural network (RNN); for recognition, the smartphone does not require any change in either the hardware or the operating system. The experimental results included changes in scenarios, as well as network traffic between smartphone and Wi-Fi access points. They classified three gestures with 93% accuracy. Zhang [25] used binary motion gestures methods on a smartphone with an accelerometer. They used only two simple gestures, which were expressed as “0” and “1”. They first evaluated four kinds of candidate binary gestures and then they split the accelerometer signal sequence into multiple separate gesture signal segments using signal cutting and a merging algorithm.
The segments were then classified using five algorithms, namely, dynamic time wrapping (DTW), naïve Bayes, decision tree, support vector machine (SVM) and bidirectional long short-term memory (BLSTM) networks. Panello et al. [26] addressed the issue faced for gesture segmentation and recognition using a smartphone device. They designed an application that uses low-cost and diffused technologies. They designed a new machine learning algorithm that identifies hand gestures using Hu image moments, invariance rotation, translation, and scaling, all with low computation cost.
2.3. HGR Through Camera
A substantial amount of work has been done on the recognition of static gestures using cameras. For static hand, gesture recognition features are extracted via different methods [27–31]. Features can be extracted using the full hand or by using only the fingers of the hand. This section divides the literature review into two subsections: (i) Section2.3.1 and (ii) Section2.3.2.
2.3.1. HGR via Full-Hand Features
HGR of static gestures is a challenging task as the extraction of features from the full hand is a composite and requires a lot of machine training for recognition. Many researchers have presented different methods for gesture recognition of the full hand.
Oprisescu et al. [32] proposed a method that extracted the contour of the hand, then calculated convexity and finger positioning from the centroid for gestures. Gesture classi- fication is done via a decision tree on nine different gestures with 93.3% mean accuracy.
Yun et al. [33] detected the hand via skin color and angle, combined with Hu invariant moments. For classification, they used a Euclidean distance template-matching technique.
Ghosh et al. [34] designed a system in which they segmented the hand in preprocessing.
A localized contour sequence (LCS) and block-based features are extracted for better rep- resentation of the hand. Those features are combined and an SVM classifier is used for the recognition of static hand gestures. Candrasari [35] extracted the hand via YCbCr values. They extracted features on discrete wavelet transform (DWT) and those features were passed through hidden Markov model (HMM) andk-nearest neighbor (KNN) for classification. Rosalina et al. [36] extracted the hand via contour representation using a glove worn by the user. ANN was applied on the American Sign Language (ASL) and digits from 0–9 for classification. The accuracy rate of gesture recognition was 90%. Lin [37]
segmented the hand via a color model, and hand poses were obtained for training purposes.
The recognition accuracy was 95.96% for seven hand gestures. Pansare et al. [38] proposed a system that was divided into four stages—preprocessing, hand extraction using the Sobel edge detection method, after which the feature vector is computed via the Euclidean distance between contours. After that, the Euclidean distance is compared with the ground truth and the comparison is done for gesture recognition. Xu et al. [39] proposed a novel hand gesture recognition method in which the hand is extracted via skin-color features, and the arm is removed using distance transformation. Hu moments of the gestures are cal- culated and SVM is used for classification. This approach produced 95.83% accuracy with eight gestures. Lee et al. [40] introduced a method to extract the hand via wristband-based contour features. A simple feature matching method was proposed to obtain a recogni- tion result. Liu J. et al. [41] proposed a feature-boosting network for estimating 3D hand pose. They used convolutional layers for feature learning; these convolution layers were boosted with a new long short-term dependence-aware (LSTD) module which perceived the dependency on different hand parts. To improve reliability of features representation of each part of hand, the researchers also added a context consistency gate (CCG). They used benchmark datasets to test their system against other state of the art methods.
2.3.2. HGR via Landmarks Features
Many approaches have been proposed to localize hand landmarks as a feature extrac- tion technique for gesture recognition. The majority of existing methods include fingertip detection, which is successfully applied by researchers. Puttapirat et al. [42] proposed a system that extracted important landmarks of the hand in the image. They identified the location to specify those landmarks, and the landmarks were matched with the corre- sponding landmarks in a 3D model to estimate the hand posture. Ma et al. [43] designed a method that extracted region of interest (ROI) by the local neighbor method. They used the convex hull detection algorithm for the identification of fingertips. Al Marouf et al. [44]
developed a novel approach to determine the fingertips and the center of the palm. The procedure of fingertip detection is performed via an adaptive hill-climbing algorithm applied on distance graphs. Finger identification is performed via the relative distances between fingers and valley points. Mahdikhanlou et al. [45] explained a novel multimodal framework that computed two sets of features. The first set of features is angles from the hand joints and the second set of features is from hand contours. Those features are then classified using random forest. Grzejszczak [46] proposed a method for the localization of landmarks in RGB images. They analyzed a skin-masked directional image using hand transform and template matching. They detected landmarks on both contour and inside of
the hand masks. Recognition is done by computing the localization error of the landmark.
Kerdvibulvech [47] made a tracking system for fingertips. They achieved detection by matching a semicircular template to the detected skin region while for classification they used Bayesian classifiers. Nguyen et al. [48] made a system to segment the hand using color information separated from the arm. Then, features were extracted, namely, ratio of width to height, wrist angle, and the number of fingers; calculations are based on fingertips and cross-sections. SVM was applied for classification and they achieved 89.5% accuracy.
3. Materials and Methods
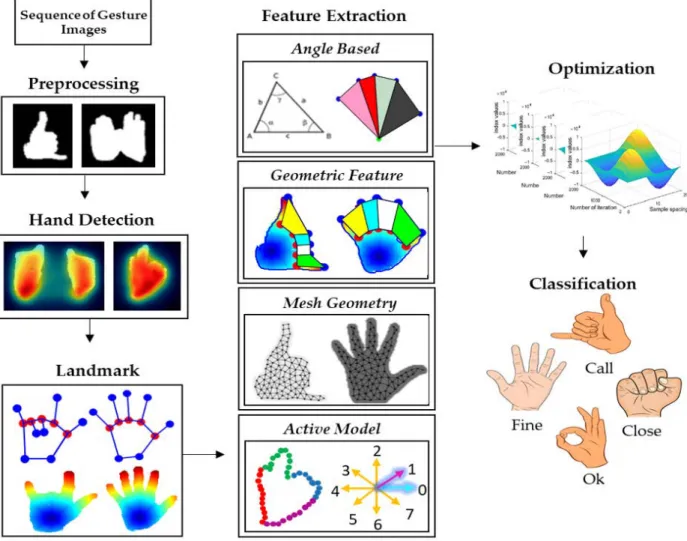
The proposed system is comprehensively discussed in this section. The system is divided into various phases. The HGR system starts with the preprocessing phase, where the hand gesture from each RGB image is segmented from the background using a morpho- logical operation. A fused method is used for hand detection. Next is the feature extraction phase, where geodesic distance, landmarks, geometric features, and spatial features are extracted from processed RGB images. Then, the optimization phase results in a represen- tation of features in the vectorized form via a gray wolf optimization algorithm. Finally, in the classification phase, each gesture is classified via a reweighted genetic algorithm. The overall architecture of the HGR system is shown in Figure1.
Figure 1.Flow chart of the proposed hand gesture recognition (HGR) system.
3.1. Preprocessing
RGB images are prone to having noise. This makes the extraction of a region of interest from the background a challenging task. We can extract the ROI by preprocessing,
in which first of all noise is removed from the image. Then, a sharpening and enhancement technique is used to increase the intensity and brightness of the image. This image is then converted into binary form for further processing in designed the HGR system. In this phase, a connected component is applied to select the largest component in the image.
Then, morphological operations, namely, dilation and erosion, are used to extract the desired region of interest [49].
X⊕Y={z|(Y∧)z∩X6=ϕ} (1)
X−Y={z|(Y)z⊆X} (2)
whereYis the structuring element andzis the location of the set of pixels. During the translation ofz,the reflection
∧
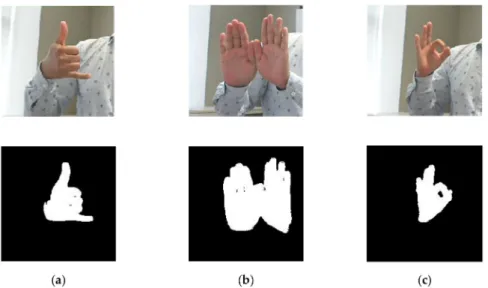
YofYjoins with the pixels of the foreground elementX. In this phase, the shape of the object is maintained, and the gesture mask is extracted. Images of all 5 datasets are passed through this phase that has enhanced the images at the pixel level for further processing. Preprocessing results are shown in Figure2.
Figure 2.Enhanced and binary images of three gestures in sign word dataset: (a) call, (b) close, and (c) correct.
3.2. Hand Detection
Region of interest (ROI) extraction is the first step in any HGR system [50]. Thus, the ROI, either single or both hand gestures in all RGB images, is first extracted from the background using 2 methods. The 2 methods implemented to segment gesture silhouettes are separately described in the following subsection.
3.2.1. The Fused Method
RGB silhouette extraction of all 5 datasets is carried out through the fused method for hand detection. This method involves 2 methods of detection. Firstly, the entire image dimension is reduced to two-dimensional space where the column size is defined by width and rows are defined by heights in an image. The RGB image is then divided into planes and converted into YCbCr space where the color of each pixel is 32 bits. For the extraction of each channel, right shift is performed on red, blue, green, and alpha by 24-bit processing to obtain the values of alpha. The alpha channel is used to check the opacity of the image;
if the pixel has 0% value, then it is fully transparent, whereas if it has 100% values, then it is a fully opaque pixel. For the red and green channel, 16 bits and 8 bits right shift is performed, respectively. The remaining pixel values are for the blue channel.
On these calculated values, bitwise logical AND operation with 0 xff is applied to extract the desired color. These operations are applied to all image pixels [51]. To obtain
accurate and more precise recognition, we converted theIRGBimage into YCbCr color space as in the equation given below:
Y Cb Cr
=
16 128 128
+ 1 265
65.738 129.057 25.06
−37.945 −74.494 112.43 112.439 −94.154 −18.28
R G B
(3) whereYis the luminance. To overcome the interference of highlights, Y(0, 80) is set.
Then, using an elliptical equation, human skin color is located via Cb and Cr values. The equation is shown below:
(i−1.6)2
26.392 + (j−2.41)2
14.032 <1 i
j
=
cos(2.53) sin(2.53)
−sin(2.53) cos(2.53)
Cb−109.38 Cr−152.02
(4)
whereiandjare the intermediate values. Each pixel value of IRGB and YCbCr is compared with the standard skin pixel, and a decision, whether each pixel is skin or not, is made on the range of predefined threshold value for each parameter.
Secondly, a contrast-based method is applied to compute a saliency map. In a saliency map, the dominant part of the gesture is based on saliency values, making the segmentation of gestures faster and more accurate. The algorithm designed for computing the saliency map has 3 aspects: (1) contrast will depend on the color and the area of the two partitions in the image; (2) the partitions will have a greater impact on each other’s saliency if the distance between them is closer; (3) the proximity of the saliency object to the center of the image [52]. Saliency map computation is performed by segmenting the input image into super pixels. Then, a sparse color histogram of the super pixels is constructed and the color number of each channel is reduced to simplify the calculations. Each histogram is converted into lab space, and the differences of color and distance between pixels are then calculated.
Dispixel pi,pj
=
k1 x=1
∑
k2 y=1
∑
f(di,x)f dj,y
Dis(di,x,dj,y) (5)
whereDis di,x, dj,y
is the distance between colorxandyin super pixelpiandpj.K1and K2represent the color number of the super pixelspiandpj.
As the partitions have a greater impact on each other’s saliency map, thus the distance betweenpiandpjis computed as
Disd pi,pj
= mi− mj
+ ni− nj
(6)
Disd pi,pj
is the distance between regions.mandnrepresent the X and Y coordinate values of regionpi, respectively.
SuperP(pi) =
∑
t6=i
n(pt)Disi(pi,pt)
δDisd(pi,pt) (7)
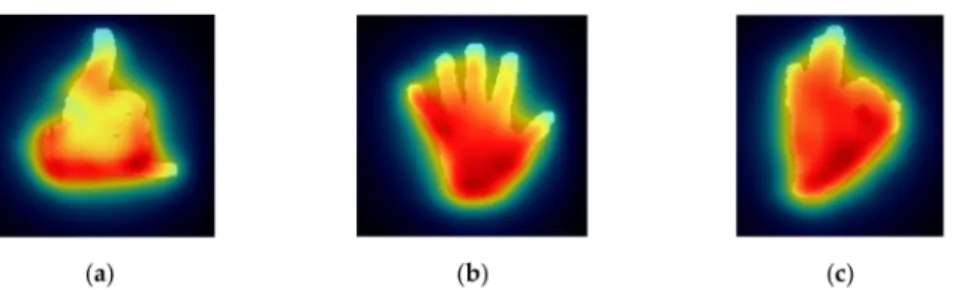
wheren(pt)is the total number of super pixelspt. The greater value will represent the greater impact on each super pixel. The original image is then segmented using graph- based segmentation to obtain a larger partition, and the contour of the salient object is generated from the saliency map [53]. Then, the gray values of the saliency map are merged in the contour. The resultant saliency map is then represented on the top of the original image, as shown in Figure3.
Figure 3.Fused methods of three gestures in sign word dataset: (a) call, (b) fine, and (c) correct.
3.2.2. Directional Images
In the second hand-detection method, the outer and inner edges of the hand region are detected viaanew approach. The ROI is obtained by specifying a threshold value T, which compares foreground and background pixel values, and as a result, a binary image is generated. For hand detection, a 3*3 gradient vector-matrixG(x,y) is computed. The gradient vector matrix is computed for every pixel of image I, and is represented as follows:
G(x,y)=
"
I(x,y)− I(x,y−1), I(x,y)− I(x,y+1) I(x,y)− I(x−1,y), I(x,y)− I(x+1,y) I(x,y)− I(x−1,y−1), I(x,y)− I(x+1,y+1) I(x,y)− I(x−1,y+1), I(x,y)− I(x+1,y−1)
#
(8) Every second pixel in the second row of the matrix will be compared with the distances adjacent to the pixel in the 3×3 window, resulting from the gradient vector matrix. The negative values of distances of every pixel, calculated after subtraction, will be converted into positive.
dl= dl ∗ (−1) (9)
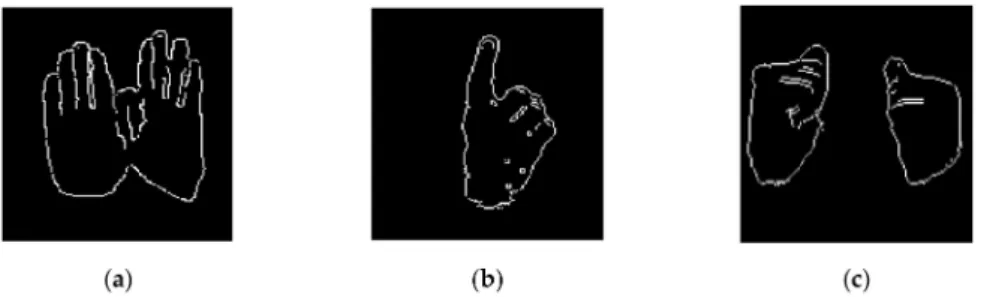
The distances that lie vertically, horizontally, and diagonally in the gradient vector are compared with a constant threshold. A distance greater than the threshold is set to the white pixel value of 1, and distances less than the threshold are set to the black pixel value 0 and, as a result, a binary image is formed of outer and internal boundaries of the hand [54]. The resulting directional image is shown in Figure4.
Figure 4.The directional image of gestures of the Sign Word dataset: (a) close, (b) single, and (c) cold.
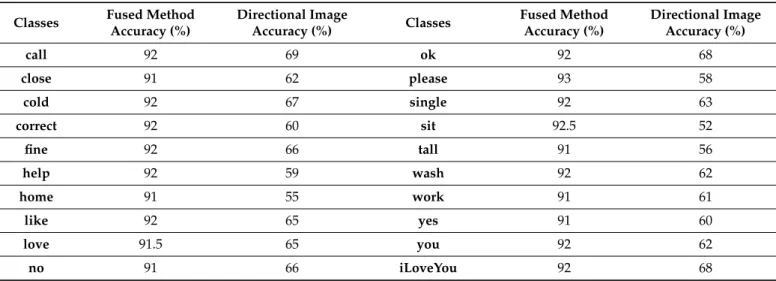
Both methods were tested on the Sign Word, Dexter1, Dexter + Object, STB, and NYU datasets. The fused method gave more promising hand detection results than the direc- tional image method. The ground truth of gestures is first computed in order to compute the accuracy of the resultant hand detection images for both fused and directional image methods. Then, the contour pixel index values distance is compared via geodesic distance on both of the methods. Table1shows comparisons of detection accuracy for the Sign Word dataset. It is clearly shown that the fused method produced more accurate results.
Thus, the fused method was selected for further processing of the system architecture.
Table 1.Comparison of detection accuracy for the Sign Word dataset.
Classes Fused Method Accuracy (%)
Directional Image
Accuracy (%) Classes Fused Method
Accuracy (%)
Directional Image Accuracy (%)
call 92 69 ok 92 68
close 91 62 please 93 58
cold 92 67 single 92 63
correct 92 60 sit 92.5 52
fine 92 66 tall 91 56
help 92 59 wash 92 62
home 91 55 work 91 61
like 92 65 yes 91 60
love 91.5 65 you 92 62
no 91 66 iLoveYou 92 68
3.3. Landmark Detection
The segmented hand is then used for landmark detection. Many approaches are proposed to localize hand landmarks, which help in feature extraction for distinguishing and determining specific gestures [54–58]. The majority of techniques are quite simple and limit the exact localization of landmarks. In our proposed method, landmark detection is performed using 2 different methods on different segmented images for the more exact localization of landmarks.
Geodesic Distance
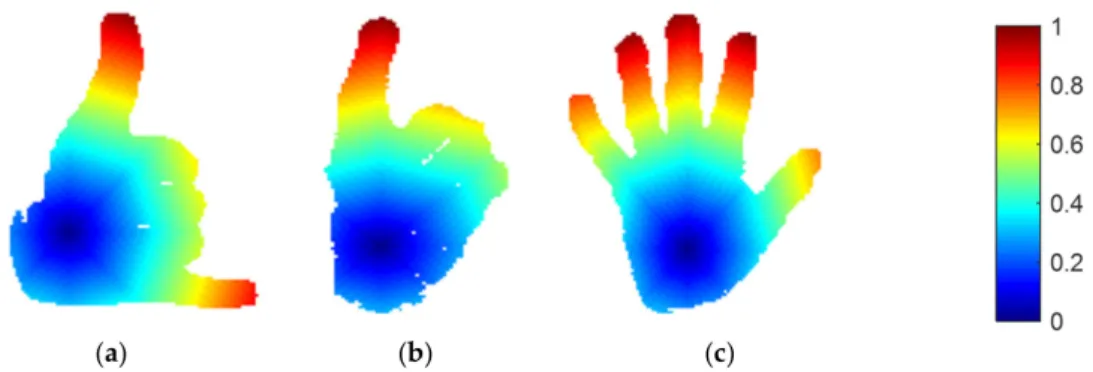
In this method, gestures performed by hands are represented via geodesic wave maps. These maps are generated by calculating geodesic distance found by a fast-marching algorithm. First of all, the center points of a human hand silhouette are located, and the distance value is given asd (h) = 0. Pointhis the starting point, which is marked as a visited point. All the other pixel pointspare unvisited and given a distance valued(p) =∞on hand silhouettes. The neighbor of each pixelpis represented asn, andppixel distance is measured fromn. Every neighboring pixel is taken in each iteration until all pixel points are marked “visited” [55–59]. The distance calculated from each iteration is compared with the distance of previous iterations. Priority is given to the shortest distance calculated. An updated distance is defined as
d=
dx+dy+√
∆ 2
min(dx,dy) +w otherwise
when ∆≥0 (10)
∆=2w2−(dx−dy)2
wheredxanddyis the distance inx- andy-coordinates, respectively, dx=min(Di+1,m,Di−1,m) anddy=min(Di,n+1,Di,n−1). Figure5demonstrates the wave propagation of geodesic dis- tance via fast-marching algorithm (FMA).
Figure 5. Wave propagation of geodesic distance via fast-marching algorithm (FMA) on the Sign Word dataset classes of (a) call, (b) single, and (c) fine.
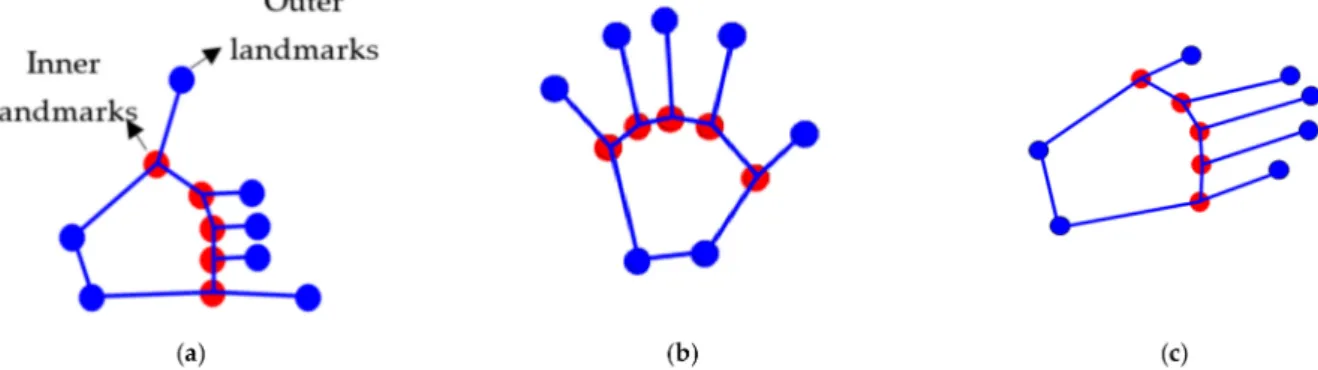
Landmark detection is performed after obtaining the wave propagation of geodesic distance via the fast-marching algorithm (FMA) on images. Color values of pixelspare computed on the outer boundarybof the hand silhouettes. Pixels having same color values care counted first and then the mean is computed; on the mean value of the pixel, the landmarklis drawn. For the inner landmark, the color value of neon green is taken, and the distance is set between points. The fingertips can be calculated as
l = c
px, py
2 (11)
where pxand pybelong to the same color in the outer boundary and c
px, py is the total number of that colored pixel located in the outer boundary. Landmarks are drawn on the hand silhouettes in Figure6given below:
Figure 6.Landmarks detection on the Sign Word dataset with (a) call, (b) fine, and (c) please hand gestures.
3.4. Feature Extraction via Point-Based Method
This section provides a detailed description of feature extraction via landmarks. The landmarks are extracted by a point-based features extraction method for hand gesture representation, training, and recognition.
3.4.1. Distance Features
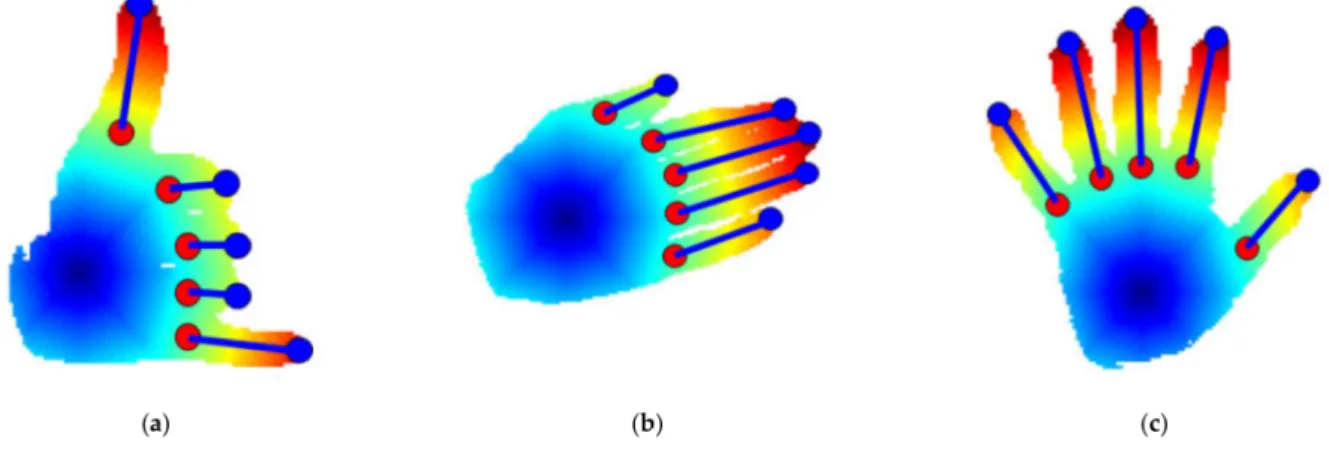
Feature extraction for hand gestures is achieved via the point-based method, which includes points on the thumb, index finger, middle finger, ring finger, and little finger (see Figure7). All the points are combined in various ways to produce a variety of features that are extracted for training and recognition purpose. These points are distance features, geometric features, and angle-based features. The distance featuredmeasures the distance
between theixyextreme landmark on the fingertip and thecxyinner landmark, using that geodesic distance of the hand, which is formulated as
k d k=
q
(xi2− xc1)2+ (yi2− yc1)2 (12) wheredrepresents the distance between two points;xi2andxc1 are thex-coordinates of the extreme landmark and inner landmark of the hand, respectively [60,61]; whileyc1 and yi2are they-coordinates of the same landmarks.
Figure 7.Distance feature computed on gestures of the Sign Word dataset classes of (a) call, (b) please, and (c) fine.
3.4.2. Angular Features
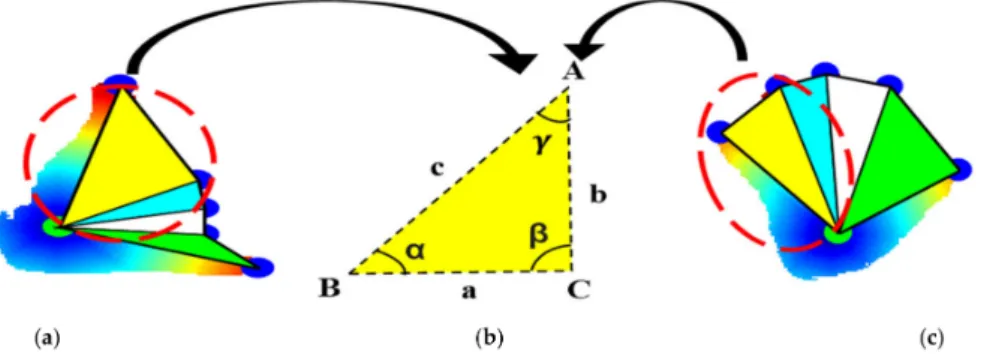
The angular features are extracted through the cosine of the angles (i.e.,α,β,γ) that is measured on the geodesic distance angle of 2 extreme points [62–64]. Three points
—adjacent, side, and centroid—form a triangle, as shown in Figure8b.
Figure 8. Angular features extraction from triangles drawn on two classes of the Sign Word dataset: (a) call, (b) angle description, and (c) fine.
Similarly, we have vertices, i.e.,A, B, andC, anda,b, andcare the sides of a particular triangle, as shown in Figure8a, havinga= BC,b=AC, andc= AB, respectively [65].
α=cos−1b2+c2−a2/2bcβ=cos−1a2+c2−b2/2acγ=cos−1a2+b2−c2/2ab (13) whereα,β,andγare the measures of the angle between two adjacent sides b<->c, a<->c, and a<->b of the triangle formed, respectively. Finally, these features are provided to the classifier for further processing towards recognition, which is discoursed successively [66].
3.4.3. Geometric Features
Hand gestures are formed using different combinations of fingers and palms, which result in forming different shapes. These shapes form a specific geometry over different gestures. Such geometric shapes are the best features for the classification and recognition
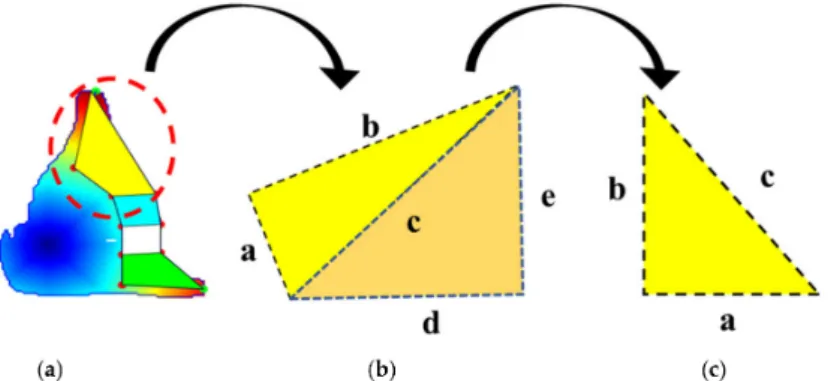
of gestures [67–70]. The geometric feature is the third point-based feature that includes different irregular shapes formed by 2 consecutive fingers. This includes different irregular shapes formed by 2 consecutive fingers of the hand in a gesture. The area is computed on the shape formed via Heron’s formula.
In this method, the irregular shape is simply divided into regular shapes such as a polygon, which is divided into 2 triangles [71]. Each side distance of the triangle is measured as the distance calculated between 2 points, and the values are computed with Heron’s formula:
G= q
t(t−m)(t−n)(t−o) where t= m+n+o
2 (14)
wherem, n,andoare the sides of the triangle, as shown in Figure9. After the area of each triangle is calculated, the areas of both triangles are added together to find the area of the irregular shape. In this way, all the shape areas of the various shapes are computed, and the features are then available for classification and recognition.
3.5. Feature Extraction via Full Hand
This section provides a detailed description of feature extraction from the full hand using the index values of points drawn using self-organizing neural gas.
3.5.1. Mesh Geometry
The aim of this stage is to estimate the morphology of the hand. This is accomplished by applying self-organizing neural gas (SONG) on the segmented binary image. SONG is an unsupervised learning model used in applications in which it is important to maintain the topology between input and output spaces. The clustering of input data is achieved so that the distance of the data item in inter-cluster variance is small, and in different classes, inter-cluster variance is large [72–74].
Figure 9.(a) Geometric feature collected from irregular shapes of the Sign Word dataset class call; (b) irregular shape divided into different sized triangles; (c) single triangle side representation.
A typical SONG training starts with the first two output neurons (n= 2). For training of the SONG, all the training datasetsIare circularly used. All accumulated errorsEw(1), Ew(2), ∀ w ε[1, n] are set to zero from the beginning of each epoch. Ew(1) shows the total quantization error that corresponds to the neuron at the end of an epoch, while the increment of the total quantization error we obtain after removal of the neuron is represented by variableEw(2).For the given input vectorIx, the starting two neurons are obtained by
Neurona1=k Ix− Wa1k ≤ k Ix− Ww k, ∀wε[1, n] (15) Neurona2=k Ix− Wa2k ≤ k Ix− Wwk, ∀wε[1, n]and w6=y1 (16)
where the initial weight vectorWw,w= 1, 2 are randomly selected by the two neurons in the input space. The values of the local variablesEa1(1)andEa1(2)change according to the following equation:
E(1)a1 = E(1)a1− k Ix− Wa1kE(2)a1 = E(2)a1 − k Ix− Wa2kCa1= Ca1+1 (17) The counter Cais assigned a zero value for these two neurons, as w = 1, 2, and if Ca1≤Cidle, then the local learning rate is defined as
ε2a1= ε1a1
ra1 (18)
whereε2a1 andε1a1 change the value according to (17), (18), and (19). Otherwise, the local values will have constant valuesε1a1 = ε1min andε2a1 =0.
ε1a1 = ε1max + ε1min − ε1min· ε1max
ε1min
Ia1
Iidle
(19)
ra1= rmax+1− rmax· 1
rmax
Ia1
Iidle
(20) The learning rateε1w is applied to the winner neuron, whileε2w is applied to the weights of the neighbor of the winning neuron. The learning rate changes values from maximum to minimum, which is defined by theIidleparameter. The initial value of rmin= 1, with the period of time the value of rawdefined byIidleparameter, reaches to maximum rmax. The weight vectors of the winning neuronNeurona1and its neighbor neuronsNeurono, one(a1) are adapted according to the following equations:
Wa1= Wa1+ ε1a1·(Ix− Wa1) (21) Wo= Wo+ ε2o·(Ix− Wo), ∀o ∈ne(a1) (22) After neuronsNeurona1andNeurona2are detected, the connection between them is created. At the end of each epoch, all the neurons are in the idle state. If the local counters are greater than the value ofCidlethen the neurons are well trained. Here, the convergence SONG network is assumed. Figure10 shows the topological features of input spaceI extracted by SONG.
Figure 10.Self-organizing neural gas (SONG) extracted on the input space.
Algorithm 1.Pseudo code for self-organizing neural gas Input:Input space,I;
Output:the map, G = (V, E);
Initialization:
First, randomly generate two nodes, N = (n1, n2) in the input space.
Second, set the neighboring neuron to zero and set the maximum number of nodes to 100.
1.Randomly generate one input signalЎto update input space I, calculate the winning node x1 and x2nearest toЎ
x1=argminn∈N k U− wnk x2=argminn∈{x1} k U− wnk 2.Adjust x1and x2
(a) Create a connecting edge if there is no connection between x1and x2. edge=edge U{(x1, x2)}
(b) Set the edge=0.
(c) Adjust the error of the winning node x1: Ex1= Ex1+ k U− wx1k
(d) To adjust the winning nodex1use the learning rate (e) Adjust all of the edges connected with nodex1:
3.Remove all edges larger than amaxand delete all nodes without connecting edges 4. Insert new nodes and divide them into two parts.
5. Insert new nodes in the following steps
i. Locate the neighboring nodenof u with the largest error, and insert new node r between them.
V=V U{r}, wr= (wu+ wv)/2
ii. Create the edges of r with u and v, and delete the edge between u and v and locate the induced subgraph
iii. Lower down the error of u and v, and set the error of node r.
iv. Regulate error of all nodes 6. If stop conditions are not satisfied, then go back to Step 1.
The outer nodes index value is taken as a feature. Each gesture depicts the different morphology of the gesture. The outer nodes are selected by inspecting the neighborhood pixel values. If the pixel has the white value, then the node is selected; otherwise, it is rejected. Figure11shows the mesh and the selected outer boundary of the hand.
Figure 11.(a) SONG on the call gesture with the outer region selected as a feature. (b) SONG on fine gesture with the outer region selected for feature.
3.5.2. Active Model
The second method used for feature extraction from the full hand uses 8 Freeman chain code algorithms. This method measures the intensity change along with the curve points on the boundary of hand gestures. First, the boundary of the hand is identified.
All the curve points along the hand contour are identified and represented using the 8 Freeman chain code algorithm [75,76]. Let us suppose all the points along the boundaryb
are represented by pointsn. Thesis the starting point on the top left side of the thumb, andswill check points untiln-1. The curve point on the boundary is represented asCb, and thus all points will beCb= {s0,s1, . . . ,sn−1}.
We start to find feature points from s0 and move in a clockwise direction along the boundary until a change in the direction is observed. Let the next point be s1 and current points s0; if the direction of both s0 and s1 is the same, then the point s1 will be excluded and the next point, s2, will be checked. If the directions of both s0 and s1 are different, then s1 will be considered as feature point f. All points on the boundary will be checked similarly and, if the current point and the next point difference is greater than 0, then it will be selected as feature point f [77]. Figure12depicts point selection.
Figure 12. (a) depicts active model feature extraction and the direction of extracted points, while (b) depicts the points extracted.
A total of 8 cases of 45◦and 4 cases of 90◦are taken to find the changes in the direction of points in order to find the points for features. Figure13represents the changes in direion of 45◦and 90◦in which the yellow line shows the direction of the current curve point while the blue arrow shows the subsequent direction of the curve point.
Figure 13.Cases of full-hand feature extraction: (a) three cases of 45◦change in direction; (b) three cases of 90◦change in direction.
3.6. Features Optimization
For feature optimization, gray wolf optimization (GWO) is applied in order to ob- tain the best feature vector for classification. GWO discriminates the different cases and provides multiple solutions. It resembles the organizational structure of wolves for group hunting, which is a very clever swarm tactic. Four types of wolves stimulate leadership hierarchy. The alpha wolf is the master for all the gestures. The beta wolf is a subordi- nate wolf, which also helps the alpha to make choices [51,78,79]. The delta wolf is only appointed when alpha, beta, and omega are not wolves. The omega is a low-rated wolf that only reports to the other wolves. The omega is also dominated by delta wolves and it
reports to both alpha and beta. The strategies of hunting that identify a wolf’s location can be seen mathematically as
Aαˆ =Y1´ ·Lα− L(t), ˆAβ=Y2´ ·Lβ− L(t), ˆAδ=Y3´ ·Lδ− L(t) (23) wheretis iterations. When the target is identified, the repletion begins (t = 1). The alpha, delta, and beta would instruct the omegas to chase and encircle the target. L is the location trajectory of the gray wolf [80].Lis defined as
L1= Lα− Z1·Aα,ˆ L2= Lβ− Z2·Aβ,L3ˆ = Lδ− Z3·Aδ,ˆ L(t) = L1+ L2+ L3
3 (24)
whereL1,L2, andL3are the location trajectories of alpha, beta, and delta wolves, respec- tively. TheL anddare the mixtures of the containing restrictionaand the haphazard quantitiesx1andx2as
L=2αx1, d=2x2 (25)
The optimization result for the Sign Word dataset is given below (Figure14):
3.7. Classifier: Reweighted Genetic Algorithm
For classification, a modified version of the state-of-the-art genetic algorithm (GA) is introduced. A genetic algorithm (GA) is an evolutionary algorithm that is robust, heuristic, and stochastic and is reliable for high-dimensional space [81]. The genetic strategy is used during complex computational problems. It is a pool-based algorithm that uses small chunks of data to find optimal solutions with random biological operations, i.e., crossover, mutation, and selection. In the genetic model, operations are performed on a basic unit known as chromosomes. Feature vectors are converted into chromosomes by mapping every single feature to respective genes [82]. Chromosomes consist of genes; each gene represents a single feature in the feature vector. Figure15shows the basic structure of genetic model units. To find the optimal solution chromosomes, filter the search space in different orders. On the other hand, the population is the pool of chromosomes. In selection process, the first chromosome is selected randomly from the pool, and after that, a fitness function is applied to all chromosomes and numbers are generated. The chromosome having greater number is the fittest and it is selected for the optimal path solution [83].
Figure 14.Gray wolf optimization best solution on the Sign Word dataset.
Figure 15.Representation of the basic units of a genetic model.
In the reweighted genetic algorithm, the classifier is divided into 2 phases: reweighted feature selection and classification. In the first phase, weights are assigned to optimized features using a support vector machine and random forest classifier. In the classification phase, the resultant output is classified into different human gestures.
Initially, GA starts with optimized features on which crossover and mutation tech- niques are applied. In the crossover function, the optimized features are represented as chromosomes in a subspace known as population. After this, mutation is applied to crossed chromosomes to increase diversity. This also provides a method that helps in escaping from the local optimum. Finally, resultant chromosomes are duplicated, and weights are assigned to them so that prominent features are assigned according to better weights.
Copt(f) =
∑
K k=1Of1,Of2. . . ,Of n, ∗Of1,Of2. . . ,Of nMopt(f) = O”f1,O”f2. . . ,O”f n1 (26) whereOf1is the optimized feature,Coptis the crossover, andMoptis the mutation function applied over gray wolf optimized features. These GA patterns are then inserted into a codebook pattern and classified by finding a maximum matching cluster from the codebook [84] (Figure16).
Figure 16.Flow chart of the reweighted genetic model for HGR.
4. System Validation and Experimentation
This section provides a brief description of the datasets used for the training and testing of the proposed system. All the experiments were performed on MATLAB R2017a.
The following parameters were used to validate the system’s performance. Firstly, the recognition rate of single and gesture performed by both hands from all five datasets is given. Secondly, the precision, recall, and F1 values via decision tree, ANN, and genetic
algorithm are given for all five datasets. Finally, a comparison of our method with other state-of-the-art methods is provided.
4.1. Dataset Description
Table2represents the name, type of input data, and description of each dataset for the training and testing of the proposed system.
Table 2.Descriptions of datasets used for evaluation and experimentation.
Name of Dataset Type of Input Data Gesture Classes
Sign word RGB images
This dataset contains 20 isolated hand gestures (11 single-hand gestures and 9 double-hand gestures), i.e., call, close, cold, correct, fine, help, home,
like, love, no, ok, please, single, sit, tall, wash, work, yes, you, iloveyou.
The images of the dataset were collected with a pixel resolution of 200 x 200. To collect dataset images, we requested three volunteers (mean age 25)
to perform the gesture of Sign Word [85].
Dexter1
RGB frames with 5 Sony DFW-V500 RGB cameras at
25 fps
Dexter1 consists of seven sequences, i.e., abduction–adduction, flexion–extension, finger count, finger wave, flexex1, pinch, random, tiger
grasp of the hand. Roughly the first 250 frames in each sequence correspond to slow motions while the remaining frames are fast motions.
All sequences are performed with an actor’s right hand [86].
Dexter + Object RGB frames with Creative Senz3D color camera
Dexter + Object is a dataset for evaluating algorithms for joint hand and object tracking. It consists of six sequences, i.e., grasp1, grasp2, pinch, rigid, rotate, and occlusion with two actors (one female) and varying interactions
with a simple object shape [87].
STB RGB and RGBD frames STB dataset contains 18,000 images with ground truth. Six people performed counting and random poses having different backgrounds [88].
NYU RGBD data with ground
truth images
NYU hand pose dataset consists of 8252 test set and 72,757 training set frames. The dataset consists of RGBD and RGB images. The training set
consists of single user while test set consist of two users with different hand poses [89].
4.2. Recognition Accuracy
To validate the system’s performance, we first gave the Sign Word dataset hand gesture to the proposed system to determine the recognition rate using a genetic classifier.
The percentage of accuracies for each class was given separately in the form of a confusion matrix. Each gesture class for all five datasets used for experimentation achieved up to the mark performance with our proposed system. Tables3–5show the confusion matrix of accuracy scores for gesture classification for the proposed approach for the Sign Word dataset, the Dexter1, and the Dexter + Object, respectively. Table6shows the mean accuracy of all five datasets used for testing the proposed system.
We used five HGR datasets for experimentation, namely, Sign Word, Dexter1, Dexter + Object, STB, and NYU datasets that produced 92.1%, 93.1%, 88.2%, 90.8%, and 85.3% mean accuracy, respectively.
4.3. Precision, Recall, and F1 Score
In this Section, precision accuracy, recall, and F1 scores are given using a decision tree, ANN, and genetic algorithms on all five datasets. Results show that the genetic algorithm produced a better performance over all three classifiers. The decision tree omitted sampling features for classification while training and the classification process was faster compared to training. ANN required a maximum number of samples for training and, as the number of training samples was less than 100 million, the accuracy rate for ANN was less compared to the other classifiers. The genetic algorithm gave better results in the proposed system.
Tables 7–11present the test results for precision, recall, and F1 scores for all the three classifiers on all five respective datasets.
Table 3.Confusion matrix of accuracy scores for gesture classification for the Sign Word dataset.
Classes C1 CL2 CO3 CR4 F5 H6 HM7 L8 LV9 N10 O11 P12 S13 ST14 T15 WA16 WO17 Y18 U19 IL20
C1 0.99 0.00 0.00 0.00 0.00 0.01 0.00 0.00 0.00 0.00 0.00 0.00 0.00 0.00 0.00 0.00 0.00 0.00 0.00 0.00
CL2 0.00 0.96 0.00 0.00 0.01 0.00 0.00 0.00 0.00 0.00 0.00 0.01 0.00 0.00 0.02 0.00 0.00 0.00 0.00 0.00
CO3 0.01 0.00 0.87 0.00 0.00 0.01 0.00 0.00 0.00 0.02 0.00 0.00 0.00 0.01 0.00 0.03 0.05 0.00 0.00 0.00
CR4 0.00 0.00 0.00 0.97 0.00 0.00 0.00 0.01 0.00 0.00 0.00 0.00 0.00 0.00 0.00 0.00 0.00 0.02 0.00 0.00
F5 0.00 0.00 0.00 0.00 0.99 0.00 0.00 0.00 0.00 0.00 0.00 0.01 0.00 0.00 0.00 0.00 0.00 0.00 0.00 0.00
H6 0.03 0.00 0.01 0.00 0.00 0.85 0.01 0.00 0.02 0.00 0.02 0.00 0.00 0.01 0.00 0.02 0.03 0.00 0.00 0.00
HM7 0.00 0.00 0.00 0.00 0.00 0.00 0.95 0.00 0.02 0.00 0.00 0.00 0.00 0.00 0.00 0.03 0.00 0.00 0.00 0.00
L8 0.00 0.00 0.00 0.01 0.00 0.00 0.00 0.96 0.00 0.00 0.00 0.00 0.01 0.00 0.00 0.00 0.00 0.00 0.00 0.02
LV9 0.00 0.00 0.01 0.00 0.00 0.03 0.00 0.00 0.94 0.00 0.00 0.00 0.00 0.00 0.00 0.00 0.01 0.01 0.00 0.00
N10 0.01 0.00 0.00 0.02 0.00 0.00 0.00 0.01 0.00 0.91 0.01 0.00 0.00 0.01 0.00 0.00 0.00 0.01 0.02 0.00
O11 0.02 0.00 0.00 0.01 0.01 0.00 0.00 0.03 0.00 0.03 0.86 0.01 0.01 0.00 0.00 0.00 0.00 0.01 0.01 0.00
P12 0.00 0.00 0.00 0.00 0.03 0.00 0.00 0.00 0.00 0.00 0.00 0.97 0.00 0.00 0.00 0.00 0.00 0.00 0.00 0.00
S13 0.00 0.00 0.00 0.00 0.00 0.00 0.00 0.00 0.00 0.00 0.03 0.00 0.96 0.00 0.00 0.00 0.00 0.00 0.00 0.01
ST14 0.00 0.00 0.03 0.00 0.00 0.02 0.00 0.01 0.00 0.00 0.00 0.00 0.00 0.85 0.00 0.07 0.02 0.00 0.00 0.00
T15 0.00 0.04 0.01 0.00 0.00 0.02 0.03 0.00 0.00 0.00 0.00 0.00 0.00 0.00 0.89 0.00 0.01 0.00 0.00 0.00
WA16 0.00 0.00 0.00 0.00 0.00 0.01 0.00 0.00 0.02 0.00 0.00 0.00 0.00 0.02 0.00 0.87 0.08 0.00 0.00 0.00
WO17 0.00 0.00 0.04 0.00 0.00 0.00 0.00 0.00 0.00 0.00 0.00 0.00 0.00 0.00 0.00 0.05 0.89 0.02 0.00 0.00
Y18 0.00 0.00 0.00 0.01 0.00 0.00 0.00 0.00 0.00 0.03 0.00 0.00 0.00 0.00 0.00 0.00 0.01 0.88 0.07 0.00
U19 0.01 0.00 0.00 0.00 0.00 0.00 0.00 0.00 0.00 0.01 0.01 0.00 0.00 0.00 0.00 0.00 0.00 0.08 0.89 0.00
IL20 0.00 0.00 0.00 0.00 0.00 0.00 0.00 0.03 0.00 0.00 0.00 0.00 0.00 0.00 0.00 0.00 0.00 0.00 0.00 0.97
1call,2close,3cold,4correct,5fine,6help,7home,8like,9love,10no,11ok,12please,13single,14sit,15tall,16wash,17work,18yes,19you,20iLoveYou.
Table 4.Confusion matrix of accuracy scores for gesture classification for the Dexter1 dataset.
Gesture Classes AD1 FC2 FW3 F4 P5 R6 TG7
AD1 0.95 0.0 0.00 0.05 0.00 0.00 0.00
FC2 0.03 0.96 0.00 0.00 0.00 0.00 0.02
FW3 0.00 0.04 0.94 0.02 0.00 0.00 0.00
F4 0.03 0.00 0.02 0.95 0.00 0.00 0.00
P5 0.01 0.01 0.00 0.00 0.92 0.00 0.06
R6 0.00 0.03 0.05 0.00 0.03 0.89 0.0
TG7 0.00 0.00 0.00 0.02 0.07 0.00 0.91
1adbadd,2fingercount,3fingerwave,4flexer1,5pinch,6random,7tigergrasp.
Table 5.Confusion matrix of accuracy scores for gesture classification for the Dexter + Object dataset.
Predicted Gesture Classes
G1 GR2 O3 P4 R5 RO6
G1 0.91 0.07 0.00 0.00 0.00 0.02
GR2 0.09 0.89 0.00 0.00 0.01 0.01
O3 0.00 0.00 0.85 0.00 0.09 0.06
P4 0.06 0.05 0.00 0.84 0.03 0.02
R5 0.00 0.01 0.06 0.00 0.92 0.01
RO6 0.00 0.00 0.00 0.05 0.07 0.88
1grasp1,2grasp2,3occlusion,4pinch,5rigid,6rotate.
Table 6.Mean accuracy for gesture classification of datasets.
Datasets Mean Accuracy %
Sign Word 92.1
Dexter1 93.1
Dexter + Object 88.2
STB 90.8
NYU 85.3
Table 7.Test results of the three classifiers using the Sign Word dataset.
Classifier Accuracy Precision Recall F1
Decision tree 0.9142 0.9012 0.8412 0.8701
ANN 0.8924 0.8214 0.8516 0.8362
Genetic algo 0.9212 0.8817 0.8833 0.8824
Table 8.Test results of the three classifiers using the Dexter1 dataset.
Classifier Accuracy Precision Recall F1
Decision tree 0.9212 0.9102 0.8702 0.8897
ANN 0.9024 0.8313 0.8714 0.8508
Genetic algo 0.9312 0.8927 0.8923 0.8924
Table 9.Test results of the three classifiers using the Dexter + Object dataset.
Classifier Accuracy Precision Recall F1
Decision tree 0.9021 0.9012 0.8412 0.8701
ANN 0.8761 0.7915 0.8315 0.8110
Genetic algo 0.8822 0.8315 0.8012 0.8160
Table 10.Test results of the three classifiers using the STB dataset.
Classifier Accuracy Precision Recall F1
Decision tree 0.8901 0.8542 0.8612 0.8576
ANN 0.8912 0.8612 0.8415 0.8512
Genetic algo 0.9081 0.8522 0.8724 0.8621
Table 11.Test results of the three classifiers using the NYU dataset.
Classifier Accuracy Precision Recall F1
Decision tree 0.8641 0.8414 0.8213 0.8312
ANN 0.8421 0.8321 0.8101 0.8214
Genetic algo 0.8532 0.8462 0.8387 0.8424
4.4. Comparison
The comparison between our proposed method and other state-of-art-methods is given in Table12. The results show that our proposed method, which is the combined feature extraction method (i.e., using both key points and full hand), produced higher recognition accuracy rates than the other state-of-the-art methods, which use a single feature extraction method (i.e., either point based or full hand). Our proposed method accurately extracted ROI from RGB images and accurately extracted feature vectors on the proposed method. The reweighted genetic algorithm used optimized features, 70% of the feature vectors for training and 30% of the feature vector for testing, to produce accurate results. The table shows that on all five datasets, namely, Sign Word, Dexter1, Dexter + Object, STB, and NYU used for training and testing, our proposed method produced higher accuracy than the other methods.
Table 12.Result comparison with the other state-of-the-art methods on all three datasets.
Dataset Feature Extraction Method Authors Recognition Accuracy (%)
Sign Word
Point-based Vaitkeviˇcius et al. [90] 86.1
Full-hand Ahlawat et al. [91] 90
Wang et al. [92] 92
Point-based + full-hand Proposed methodology on Sign
Word dataset 92.1
Dexter1
Point-based Cai [93] 88
Full-hand Imashev [94] 86
Shan et al. [95] 89
Point-based + full-hand Proposed methodology on
Dexter1 dataset 93.1
Dexter + Object
Point-based Spurr et al. [96] 85
Brahmbhatt et al. [97] 86.49
Full-hand Li et al. [98] 84
Point-based + full-hand Proposed methodology on Dexter
+ Object dataset 88.2
STB
Point-based Chen et al. [99] 75
Dai et al. [100] 77
Full-hand Zhou et al. [101] 89
Point-based + full-hand Proposed methodology on STB 90.8
NYU
Point-based Deng et al. [102] 74
Full-hand Moon et al. [103] 83.4
Point-based + full-hand Proposed methodology on NYU 85.3