ⓒ IEMEK J. Embed. Sys. Appl. 2020 Jun. 15(3) 119-127 ISSN : 1975-5066
http://dx.doi.org/10.14372/IEMEK.2020.15.3.119
Feature Selection for Abnormal Driving Behavior Recognition Based on Variance Distribution of
Power Spectral Density
Hellen Nassuna, Jaehoon Kim, Odongo Steven Eyobu, Dongik Lee*
Abstract : The detection and recognition of abnormal driving becomes crucial for achieving safety in Intelligent Transportation Systems (ITS). This paper presents a feature extraction method based on spectral data to train a neural network model for driving behavior recognition. The proposed method uses a two stage signal processing approach to derive time-saving and efficient feature vectors. For the first stage, the feature vector set is obtained by calculating variances from each frequency bin containing the power spectrum data. The feature set is further reduced in the second stage where an intersection method is used to select more significant features that are finally applied for training a neural network model. A stream of live signals are fed to the trained model which recognizes the abnormal driving behaviors. The driving behaviors considered in this study are weaving, sudden braking and normal driving. The effectiveness of the proposed method is demonstrated by comparing with existing methods, which are Particle Swarm Optimization (PSO) and Convolution Neural Network (CNN). The experiments show that the proposed approach achieves satisfactory results with less computational complexity.
Keywords : Abnormal driving, Machine learning, Spectrogram, Variance, Smartphone sensor
*Corresponding Author ([email protected]) Received: Oct. 25, 2019, Revised: Dec. 30, 2019, Accepted: Mar. 26, 2020.
H. Nassuna: Kyungpook National University (M.S.
Student)
J. Kim: Kyungpook National University (Ph.D.
Student)
D. Lee: Kyungpook National University (Prof.) O.S. Eyobu: Makerere University (Lecturer)
※ This work was supported by the National Research Foundation of Korea (NRF) grant funded by the Korea government (MSIT) (NRF-2017R1A2B4003008).
Ⅰ. Introduction
More than 1.2 million people die in road accidents each year [1]. Majority of these accidents are caused by human factors including drivers’ reckless driving behaviors.
The World Health Organization (WHO) warns
that road accidents will rank 7th by 2030 as the leading cause of death in the world unless effective action is taken. A possible way of dealing with this catastrophe is the monitoring of drivers’ behavior so as to eliminate culprits before they cause any significant damage.
Various methods based on machine learning techniques have been suggested to achieve abnormal driving recognition [2-7]. There is no doubt that machine learning techniques are known to be very powerful. However, they require an informative set of features that have to be applied for a model to perform efficiently and effectively. The applied inputs can slow down the model or cause unrealistic results if it is not optimally selected.
In this paper, we set out to use spectral features that exhibited good performance in [8-10]. These features are used as inputs to a neural network model for driving behavior recognition. The choice of a sensor is another
Instead, this work utilizes the built-in IMU sensors of a smart phone to collect the accelerometer data while driving a car. For the driving conditions, we consider weaving, sudden braking, and normal driving, which are commonly taken in existing works [14-20].
The rest of the paper is organized as follows. The related work is reviewed in Section II. In Section III, the proposed algorithm is described in detail. Section IV presents a set of experimental results compared with existing methods. Finally, the paper is concluded in Section V.
This paper is an extension of work originally presented in the 14th IEEE Conference on Industrial Electronics and Applications [18].
Ⅱ. Related Work
Features applied to a machine learning algorithm are very critical to its performance.
For this reason, various features have been investigated in regards to driving behavior recognition. For example, in [2], researchers used the approximate entropy of sliding windows from steering wheel angles as features to train a binary decision classifier.
Another researcher used synthetic sequences generated on the road maps to build a stochastic competitive learning algorithm for the detection of drunk driving [4]. The algorithm [4] achieved high detection rates under lab environment. But it is unclear that the algorithm can also achieve the same results in real driving scenarios. The researchers in [5] used templates generated from time series data as inputs to a dynamic time warping algorithm.
In this paper, unlike the aforementi oned
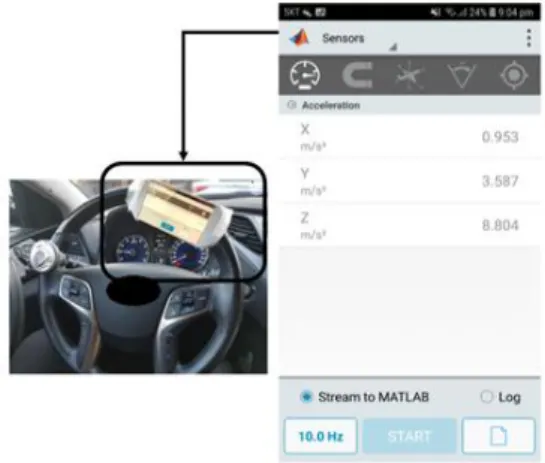
Fig. 1 Setup for data collection
approaches, we set out to determine thresholds for driving abnormality using spectral data. The use of spectral data has not been investigated in driving behavior recognition. However, in [8], it has shown remarkable results in music identification, where local descriptors of the Scale Invariant Feature Transform (SIFT) were computed from spectrogram images. The algorithm exhibited good performance in terms of robustness, accuracy and speed.
Researchers in [9] used a spectrogram based feature extraction approach to train a deep learning model for learning human activity recognition.
We noted that the scientific findings in [10]
about the use of spectral analysis to investigate brain activity were encouraging for advancing the understanding of autism disorders. Therefore, we set out to apply a similar concept to driving behavior recognition.
Ⅲ. Development of Algorithm
1. Setup for data collection
The accelerometer data readings are recorded using the built-in IMU sensor of a Samsung S5 smart phone. The phone is attached to the steering wheel of the vehicle as shown in Fig. 1. Using the MATLAB mobile phone application, we set the data transmission
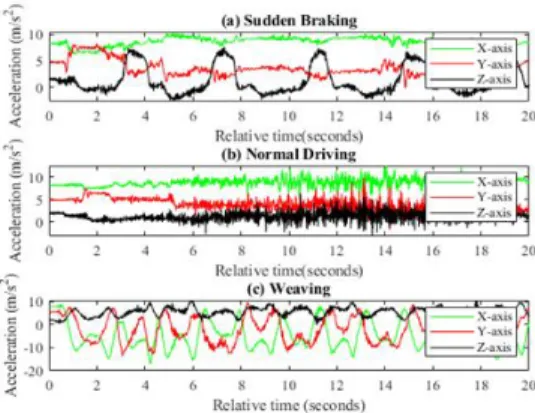
Fig. 2 A sample of 3-axial raw data recorde
to 64Hz and record the vehicle’s acceleration while executing three types of driving behaviors. That is, 59, 73 and 71 segments of data are recorded for sudden braking, weaving, and normal driving, respectively.
Fig. 2 shows a 20-second sample of the 3-axial data that is recorded using the smart phone. For this experiment, we choose to use one axis (Z-axis) data to reduce the computational burden.
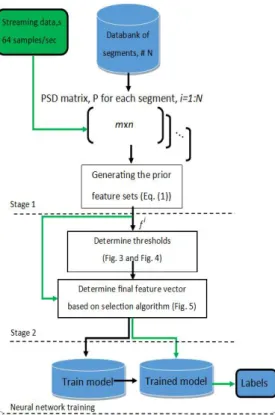
2. Feature extraction based on PSD
We create a data bank of N segments containing driving data. As mentioned before, only the Z-axis data are used in this work to reduce computation burden. For each segment, a PSD matrix of size ×, denoted by ( ), is generated using the Short Time Fourier Transform (STFT) where a hamming window of 50% overlap is considered to suppress spectral leakage. A set of variances representing the distribution of the spectral data belonging to frequency bins of , is then obtained as a feature vector whose components are calculated by:
for (1)
with
(2)
Fig. 3 Concept for obtaining intersecting data
Fig. 4 Distribution of intersecting points across the PSD bins
where is the element in the j-th row and k-th column of .
3. Feature subset generation
Upon obtaining the sets , the intersection among the feature sets is done in order to determine the commonly occurring data as illustrated in Fig. 3. The distribution of the intersecting data is analyzed for each driving behavior.
Fig. 4 shows the distribution of the intersecting data with the regions of higher variances marked out. We consider these regions to contain the significant characteristics for the driving behaviors.
Therefore, using the intersecting data, features
Fig. 5 Feature selection algorithm
Fig. 6 The overall flow of proposed lgorithm
are selected depending on the marked regions that represent the PSD bin indices. This choice also depends on the maximum value from the data per given segment. From the intersecting data, the maximum values of weaving, sudden braking, and normal driving are given by 1.2,
label
Normal
driving 2 0 70
Sudden
braking Weaving Normal driving Predicted label
0.2 and 0.03, respectively. These values are the thresholds that determine the percentage of data to select from the regions across the PSD bin index. The resulting algorithm for feature selection is illustrated in Fig. 5.
Using the algorithm depicted in Fig. 5, the final feature sets, ′, are used as input features to train a neural network model. Table 1 shows the training result using the features extracted by the proposed method. It is noted that, out of 59 segments for sudden braking, 6 were misclassified as weaving, and 2 were misclassified as normal driving. For 73 weaving segments, 5 were misclassified as sudden braking. Only one of 71 normal driving segments was misclassified.
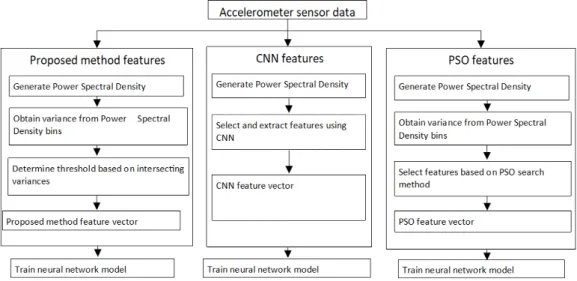
Fig. 6 summarizes the overall flow of the proposed method in this paper.
Ⅳ. Experimental results
In this section, the performance of the proposed method is demonstrated by comparing with two existing methods, PSO and CNN.
1. Feature selection using PSO search method Firstly, the proposed method is compared with the existing PSO search method which was used for feature selection in [21]. The parameters for experiment are set as shown in Table 2. PSO is an optimization tool that uses the concept of neighbourhood and individual i n t e l l i g e n c e i n a g i v e n s e a r c h s p a c e t o determine the optimum solution. The indices of
Parameter Value
Population size 20
Iterations 20
Mutation type bit-flip
Mutation probability 0.01
Inertia weight 0.33
Socail weight 0.33
Individual weight 0.34
Table 2. Parameters for PSO search method
True label
Sudden
braking 19 2 0
Weaving 34 69 2
Normal
driving 6 2 69
Sudden
braking Weaving Normal driving Predicted label Table 3. Training results with PSO features
features are considered as the search space to b e s el e ct e d. F i n al f e a tu r e s e ts ′, e a ch containing 65 attributes out of 129 initially supplied, are selected.
Table 3 shows the results with a neural network using the features selected by PSO. It can be observed that more than half of the sudden braking segments are misclassified as Weaving.
2. Feature selection using CNN
Another feature selection is carried out using a Convolution Neural Network called AlexNet. In this case, 20% of the data from each class is used for training. Finally, the entire dataset is fed to the neural network for classification and the results are summarized in Table 4.
3. Experimental results with proposed method The proposed method is implemented using MATLAB. The final feature sets are applied as inputs to a pattern recognition network with the hidden layer size set to 25 and epochs set to 52. In this experiment, 70% of the data set
True label
Sudden
braking 53 5 2
Weaving 6 68 2
Normal
driving 0 0 67
Sudden
braking Weaving Normal driving Predicted label Table 4. Training results with CNN features
Accuracy(%)
Proposed PSO CNN
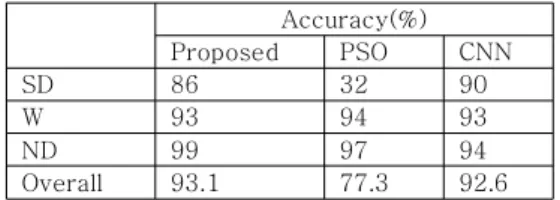
SD 86 32 90
W 93 94 93
ND 99 97 94
Overall 93.1 77.3 92.6
Table 5. Accuracy of driving behavior recognition
is used for training, 15% for testing, and 15%
for validation, as suggested in [22]. The resulting models are tested on 619 segments of streaming data. Fig. 7 illustrates the summary of results using the proposed feature selection method as well as the existing PSO and CNN methods.
In Table 5, the recognition accuracy for three driving behaviors (sudden braking(SD), weaving(W), and normal driving(ND)) are summarized.
The overall accuracy is calculated based on the confusion matrix standard formula as below:
(3)
where TP, TN and total denote true positives, true negatives, and total number of segments, respectively. True positives refer to the number of observations that are positive and are predicted to be positive. True negatives refer to the number of observations that are negative and are predicted to be negative.
As show n in Tabl e 6, the use of CN N features achi eved as hi gh accur acy as the proposed method. However, CNN takes the
Fig. 7 Summary of results with different feature selection methods
Method Number of
iterations Accuracy(%) Using CNN features 100 92.6
Using PSO features 29 77.3
Proposed method 44 93.1
Table 6. Summary of experimental results
highest number of iterations. The model trained using PSO takes the least number of iterations, while achieving a lower accuracy as compared to the rest. Therefore, the experimental results conclude that the proposed method can offer a more effective recognition performance as compared to the existing methods.
Ⅴ. Conclusion
In this paper, spectral features selected from acceleration data measured by built-in sensors of a smart phone have been used to recognize the driving behaviors: weaving, sudden braking and normal driving. The contributions from this paper can be summarized as below:
• Feature selection based on variance distribution of power spectral density and
• The use of only accelerometer data to classify driving behavior.
Future work will focus on improving the recognition accuracy as well as the real-time implementation on mobile phones under different environment and various noise levels.
References
[1] World Health Organization, "Road Traffic Injuries," World Health Organization, 7
December 2018. Available:
https://www.who.int/news-room/fact-sheets/de tail/road-traffic-injuries.
[2] Z. Li, S. E. Li, R. Li, B. Cheng, J. Shi,
"Online Detection of Driver Fatigue Using Steering Wheel Angles for Real Driving Conditions," Sensors, Vol. 17, No. 3, pp. 495, 2017.
[3] C. Ma, X. Dai, J. Zhu, N. Liu, H. Sun, M.
Liu, "DrivingSense: Dangerous Driving Behavior Identification Based on Smartphone Autocalibration," Mobile Information Systems, Vol. 2017, 2017.
[4] P. M. Lyons-Wall, A. Bouzerdoum, S. L.
Phung, A. Beghdadi, "Abnormal Behavior Detection Using a Multi-modal Stochastic
Learning Approach," International Conference on Intelligent Sensors, Sensor Networks and Information Processing, 2008.
[5] G. Singh, D. Bansal, S. Sofat, "A Smartphone Based Technique to Monitor Driving Behavior Using DTW and Crowdsensing," Pervasive and Mobile Computing, Vol. 40, pp. 56-70, 2017.
[6] M. Victoria, D. C. Inés, E. Javierm, B. Koldo,
"Driving Behavior Signals and Machine Learning: A Personalized Driver Assistance System," 2015 IEEE 18th International Conference on Intelligent Transportation Systems, pp. 2933-2940, 2015.
[7] C. Deng, C. Wu, N. Lyu, Z. Huang, "Driving Style Recognition Method Using Braking Characteristics Based on Hidden Markov Model," PloS one, Vol. 12, No. 8, pp. e0182419, 2017.
[8] X. Zhang, B. Zhu, L. Li, W. Li, X. Li, W.
Wang, P. Lu, W. Zhang, "SIFT-based Local Spectrogram Image Descriptor: a Novel Feature for Robust Music Identification,"
EURASIP Journal on Audio, Speech, and Music Processing, Vol. 2015, No. 1, pp. 6, 2015.
[9] O. Steven Eyobu, D. Han, "Feature Representation and Data Augmentation for Human Activity Classification Based on Wearable IMU Sensor Data Using a Deep LSTM Neural Network," Sensors, Vol. 18, No.
9, pp. 2892, 2018.
[10] J. Wang, J. Barstein, L. E. Ethridge, M. W.
Mosconi, Y. Takarae, J. A. Sweeney,
"Resting State EEG Abnormalities in Autism Spectrum Disorders," Journal of Neurodevelopmental Disorders, Vol. 5, No. 1, pp. 24, 2013.
[11] R. Sun, W. Y. Ochieng, S. Feng, "An Integrated Solution for Lane Level Irregular Driving Detection on Highways,"
Transportation Research Part C: Emerging Technologies, Vol. 56, pp. 61-79, 2015.
[12] I. Vasconcelos, R. O. Vasconcelos, B. Olivieri, M. Roriz, M. Endler, M. C. Junior,
"Smartphone-based Outlier Detection: a
Complex Event Processing Approach for Driving Behavior Detection," Journal of Internet Services and Applications, Vol. 8, No. 1, pp. 13, 2017.
[13] J. Stipancic, L. Miranda-Moreno, N. Saunier,
"Vehicle Manoeuvers as Surrogate Safety Measures: Extracting Data From the GPS-Enabled Smartphones of Regular Drivers," Accident Analysis & Prevention, Vol. 115, pp. 160-169, 2018.
[14] N. Kalra, D. Bansal, "Analyzing Driver Behavior Using Smartphone Sensors: a Survey," Int. J. Electron. Electr. Eng, Vol. 7, No. 7, pp. 697-702, 2014.
[15] X. Su, H. Tong, P. Ji, "Activity Recognition with Smartphone Sensors," Tsinghua Science and Technology, Vol. 19, No. 3, pp. 235-249, 2014.
[16] M. M. Bejani, M. Ghatee, "A Context Aware System for Driving Style Evaluation by an Ensemble Learning on Smartphone Sensors Data," Transportation Research Part C:
Emerging Technologies, Vol. 89, pp. 303-320, 2018.
[17] P. Dhar, S. Shinde, N. Jadav, A. Bhaduri,
"Unsafe Driving Detection System Using Smartphone as Sensor Platform,"
International Journal of Enhanced Research in Management & Computer Applications, Vol.
3, No. 3, pp. 65-70, 2014.
[18] H. Nassuna, O. S. Eyobu, J.-H. Kim, D. Lee,
"Feature Selection Based on Variance Distribution of Power Spectral Density for Driving Behavior Recognition," 2019 14th IEEE Conference on Industrial Electronics and Applications (ICIEA), X'ian, pp. 335-338, 2019.
[19] M. Zhang, C. Chen, T. Wo, T. Xie, M. Z. A.
Bhuiyan, X. Lin, "SafeDrive: Online Driving Anomaly Detection From Large-scale Vehicle Data," IEEE Transactions on Industrial Informatics, Vol. 13, No. 4, pp. 2087-2096, 2017.
[20] F. Li, H. Zhang, H. Che, X. Qiu, "Dangerous Driving Behavior Detection Using Smartphone Sensors," 2016 IEEE 19th
Data Mining Software: an Update," ACM SIGKDD explorations newsletter, Vol. 11, No.
005d6d9058e.
Hellen Nassuna
She received a B.S. in Software Engineering
from Makerere
University, Uganda in 2017 and a M.S. in Electronics Engineering
from Kyungpook
National University, Korea in 2020. Her research interests include intelligent systems and machine learning for data analysis.
Email: [email protected]
Jaehoon Kim
He received B.S. and M.S. degrees in Elect- ronics Engineering from Kyungpook National University, Korea, in 2011 and 2013 respec- tively. He is currently a Ph.D. student in Electronics Engineering from Kyungpook National University, Korea. His current research interests include control and estimation with regard to diagnostics, reliability, and safety of nonlinear systems.
Email: [email protected]
Odongo Steven Eyobu
He received his B.S in computer science from Islamic University, Uganda in 2004. He obtained a M.S. degree in Data Communication
and Software
Engineering from Makerere University, Uganda in 2007 and a Ph.D. in Electronics Engineering from Kyungpook National University, Korea in 2018. His research interests include intelligent transportation systems, communication systems and protocols and artificial intelligence. He is currently a lecturer at the School of Computing and Informatics Technology at Makerere University, Uganda.
Email: [email protected]
Dongik Lee
He received B.S. and M.S. degrees in Elect- ronics Engineering from Kyungpook National University, Korea, in 1987 and 1990 respec- tively. He worked as researcher at Agency for Defense Development from 1990 to 1997. He received Ph.D. degree in Department of Automatic Control and Systems Engineering at the University of Sheffield, England, 2002. He worked as co-founder and CTO at DRTS Ltd England from Jan. 2002 to March 2005.
He is currently a professor with School of Electronics Engineering at Kyungpook National University, Korea from 2005.
Email: [email protected]