저작자표시-비영리-변경금지 2.0 대한민국 이용자는 아래의 조건을 따르는 경우에 한하여 자유롭게
l 이 저작물을 복제, 배포, 전송, 전시, 공연 및 방송할 수 있습니다. 다음과 같은 조건을 따라야 합니다:
l 귀하는, 이 저작물의 재이용이나 배포의 경우, 이 저작물에 적용된 이용허락조건 을 명확하게 나타내어야 합니다.
l 저작권자로부터 별도의 허가를 받으면 이러한 조건들은 적용되지 않습니다.
저작권법에 따른 이용자의 권리는 위의 내용에 의하여 영향을 받지 않습니다. 이것은 이용허락규약(Legal Code)을 이해하기 쉽게 요약한 것입니다.
Disclaimer
저작자표시. 귀하는 원저작자를 표시하여야 합니다.
비영리. 귀하는 이 저작물을 영리 목적으로 이용할 수 없습니다.
변경금지. 귀하는 이 저작물을 개작, 변형 또는 가공할 수 없습니다.
Master ’ s Thesis of Yeonju Song
Fabrication of 3D multi-Porous Hydrogel Scaffold
하이드로겔을 이용한 3차원 다공성 인공지지체 제작 방법
July 2022
Graduate School of
Engineering
Seoul National University
Materials and Science Engineering Major
Song, Yeonju
Fabrication of 3D multi-Porous Hydrogel Scaffold
지도교수: Junsang Doh
Submitting a master
’
s thesis of Materials Science and EngineeringJune, 2022
Graduate School of Engineering Seoul National University
Materials Science and Engineering Major
Yeonju Song
Confirming the master
’
s thesis written byYeonju Song June, 2022
Chair Seoung-Kyun Kang (Seal)
Vice Chair Junsang Doh (Seal)
Examiner Min Sang Kwon (Seal)
1
Abstract
Engineering complex organ and complicated tissue scaffold is a widely researched area for various therapeutic purposes. However, it is still an ongoing challenge due to many limitations lies in current 3D multi-porous scaffold fabrication methods.
In designing 3D multi-porous scaffold, it is very important to mimic native structure of the tissue. Important yet challenging parameters to control in designing scaffold is porosity and multi- scaled pores. Because our complicated organs include diverse type of cells that perform various functions, the desirable scaffold should contain multi mechanical properties and the structures that are biocompatible for different types of cells. Porosity is one of the important factors determining the mechanical properties of scaffold.
Therefore, it is very important to control porosity while containing multi-sized pores for allowing diffusion and infiltration of various signaling molecules for cells as well as the cells themselves.
Current methods such as gas foaming, freeze drying, electrospinning, solvent leaching, 3D printing have many advantages.
However, one method alone cannot fulfill the level of designing complexity of a multi-scaled porous scaffold.
Herein, we developed an improved method of producing multi-
2
sized porous 3D scaffold by implementing gas foaming, mechanical fabrication, and 3D printing with gelatin-norbornene base material.
Gelatin norbornene provides a unique one-to-one, ene-thiol crosslinking system which allows multiple staged crosslinking process, which can be accurately controlled by the amount of thiol crosslinker added to the polymer solution. Employing these characteristics, we first create a gelatin foam which contains multiple micro-sized pores.
And then, fabricate the bulk GelNB foam into the granular shape in various sizes to make it compatible to 3D printing and injectable system. Result showed that the two stages of GelNB crosslinking system allow the fabricated particle inks to further generate multi- sized micropores through the particle-to-particle (inter-particle) second crosslinking process. Hence, by modifying various 3D printing parameters, % porosity of an engineered scaffold can be controlled.
Keyword: fabrication of hydrogel, Gelatin based hydrogel, 3D printing, multi-porous biomaterials, porous scaffold, synthetic scaffold, injectable system, cell delivery
Student Number: 2020-29583
3
Contents
Fabrication of 3D multi-Porous Hydrogel Scaffold ... i Abstract ... 1 Contents ... 3 List of Tables and Figures ... 5 1. Introduction ... 7 2. Experiments ... 11
2.1. Materials ... 11 2.2. Synthesis of base material: Gelatin-Norbornene (Gel-NB) ... 122.2.1. Activation of carboxylic acid functional group of norbornene-COOH using DCC-NHS coupling 12
2.2.2. Amide bond formation between activated norbornene-carboxylic acid group and free amine of gelatin type A ... 13 2.2.3. Cold Acetone quenching for separating synthesized gelatin-norbornene (Gel-NB) ... 13 2.2.4. Dissolve in distilled water (DW) and dialysis and freeze/dry ... 14 2.3. Fabrication of Gel-NB foam particle ... 15 2.3.1. Fabrication of Gel-NB using 16G, 18G, 21G, 23G needles ... 15 2.3.2. Fabrication of Gel-NB using blender ... 16 2.4. Preparation of 3D multi-scaled porous scaffold using Gel-NB foam particle-based ink ... 16
2.4.1. 3D multi-scaled porous scaffold using extrusion-based 3D printing ... 16 2.4.2. 3D multi-scaled porous scaffold using PDMS mold-based soft lithography ... 17 2.4.3. 3D multi-scaled porous scaffold using stereolithography (STL) 3D printing ... 18 2.5. Rheological Studies ... 18 2.6. Confocal microscope imaging and % porosity and pore size distribution analysis ... 19
3. Results and Discussion ... 21
3.1. Synthesis of Gelatin-Norbornene ... 21 3.2. Analysis of micro-sized pore within the GelNB foam particle ... 25 3.3. Ink Particle Size and Shape Analysis ... 26 3.3.1. Size Analysis of Ink Particles ... 26 3.3.2. Shape Analysis of Ink Particles ... 28 3.4. Rheology Analysis of Jammed Particle ... 32 3.5. Extrusion Printing Using Jammed Particle ... 34 3.6. Confocal Image: Porosity Comparison with Jamming Density ... 34Deleted: 17
4
3.7. %Porosity Analysis with Jamming Density ... 35 3.8. Confocal Image: %Porosity Comparison with Samples Printed with SLA 3D printer differ in layer thickness ... 38
4. Conclusion ... 44 Bibliography ... 1 국문 Abstract ... 3
5
List of Tables and Figures
Schematics 1: Preparation of Confocal Image Samples (Created with Biorender.com)
Figure 1. Experimental overview of GelNB Foam Particle-Based 3D Scaffold Fabrication. (Created with Biorender.com)
Figure 2. Gelatin-Norbornene Synthesis Process
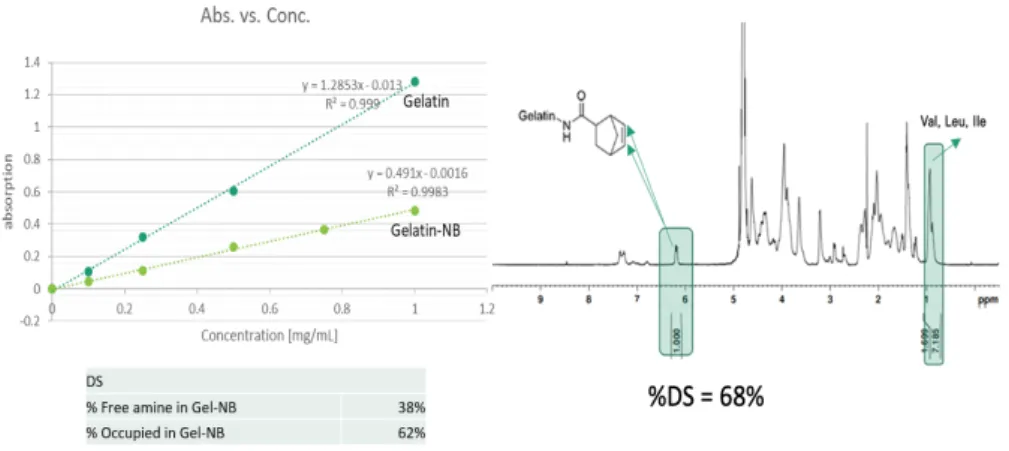
Figure 3. Confirmation and calculation of %DS of GelNB using TNBSA assay and 1H-NMR
Figure 4: Graph Describing How %DS is Affected by Reaction Time vs.
Reactant Ratio
Figure 5. Confocal Microscope Image of 21G Fabricated Particle: Each particle contains micro-sized intra pores formed by foam.
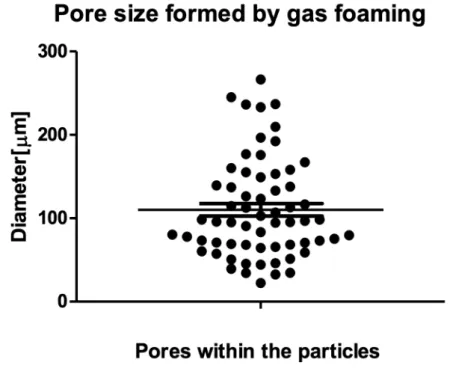
Figure 6. Size Distribution of micro-sized intra particle pores formed by gas foaming.
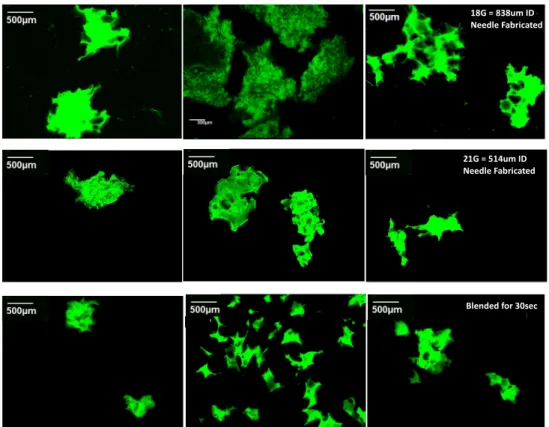
Figure 7. Confocal Microscopy Images of Representative Particles Fabricated with 18G needle, 21G needle, and blender for 30 seconds.
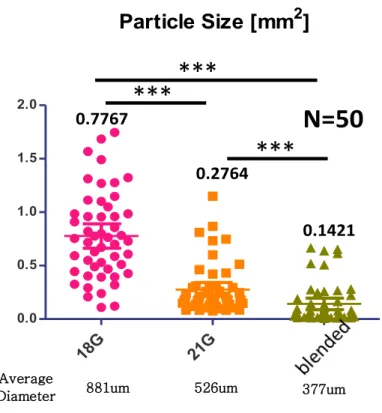
Figure 8. Size Analysis of the Particles Fabricated with 18G needle, 21G needle, and blender for 30 seconds.
Figure 9. Particle Shape Analysis: Solidity Trends of Fabricated Particles Vary in Size.
Figure 10. Particle Shape Analysis: Circularity Trends of Fabricated Particles Vary in Size.
Figure 11. Shear Yielding of Jammed Particles
Figure 12. Rheology Data showing Self-Healing of Jammed Particles.
Figure 13. Extrusion 3D Printing: Print Samples Implementing Fabricated Particle Ink.
Figure 14. Confocal Microscopy Image on How Jamming Density Affects the Porosity of the Resulting 3D Structures.
Figure 15. %Porosity Comparison with different Jamming Density
6
Figure 16. Pore Size Distribution Analysis with the different Jamming Density Samples
Figure 17. Schematics on how layer thickness and particle ink size affect printing resolution and porosity
Figure 18. Confocal Image – Porosity Comparison with Layer Thickness when the particle average diameter is fixed.
Figure 19. Confocal Microscopy Image and Images of Printed Samples of 18G Fabricated Particles Differing Layer Thickness of STL 3D Printer.
Figure 20. Calculated % Porosity of Cross Section of STL 3D Printed Structures.
Figure 21. Pore size distribution and average pore size analysis on 18G ink printed samples with STL 3D printer varying in layer thickness.
7
1. Introduction
One of the major goals of tissue engineering is to create a functional construct which can restore, maintain, and improve or replace damaged tissues or whole organs (1). In order to develop a functional construct, controlling scaffold porosity is a crucial task to achieve since it is necessary for maintaining tissue formation, functionality, and homeostasis. In the natural organ, cells lie in extracellular matrix (ECM) which contains fibrous hydrogel and collagen fibers. This fibrous structure creates various sizes of pores which allows diffusion of gas, nutrients, cytokines that are crucial for survival of the cells. Moreover, within a same organ, many different types of cells exist which require a method development for scaffold which demonstrate mechanical and biological diversity (2). Two of the major parameters that influence mechanical and biological properties of the tissue scaffold are multi-scaled pores and porosity. These two parameters are the keys to optimize important properties of tissue such as stiffness, strength, and permeability (3).
Previously many methods were studied to modify porosity of a scaffold and to generate multi-sized pores from synthetic scaffold. These methods vary in the types of material they selected to engineer the scaffold. Methods including addictive manufacturing such as 3D printing (both extrusion and stereolithography), solvent casting and particle leaching, electrospinning, and freeze-drying.
For 3D printing, although it allows designing the porous materials from
8
numerous types of materials while independently control the pore shapes, porosity, and interconnection sizes, one of the major drawback is the lack of control over the nano up to the macro scale of the final scaffold which means it is difficult to have a multiscale cell interaction (4, 5). Solvent casting and particle leaching, on the other hand, has an advantage of producing a structure which is an accurate reproduction of the initial template and that the pore size and shape are fixed; however, it has a disadvantage of remaining possible solvent or salt particle residues and mechanical integrity is insufficient and that it is difficult to fabricate thick scaffold (6,7,8). Electrospinning is a quick and easy manufacturing way to control 2D porous structure; however, it is difficult to control 3D porosity and it is not suitable for creating submicron sized pore (6,9). Freeze-drying is also a simple way to control of porosity, but it has irregular pore size and unknown quality of pore inter-connection, and compared to other methods, it is slow, expensive, and high energy consumption (6, 10, 11). Therefore, it is still challenging to develop a fast, simple, and controllable method to produce multi-sized porous 3D scaffold with a complex shape.
In order to combine the advantages of the current methods while improving the drawbacks on the existing method to control porosity and pore sizes of the synthetic multi-porous scaffold, in this experiment, we combined existing 3D printing and gas foaming methods while fabricate further on the base material.
In many previous studies, jammed hydrogel has considered as a tissue scaffold material due to its excellent biocompatibility. Some of the recent
9
studies have introduced granular hydrogels for increasing its injectability (self-healing and shear thinning) and with this property, apply the granular hydrogel as a print bath for extrusion 3D printing to increase the resulting structure’s porosity (14). Inspired by these studies and in attempt to further develop a fabrication method to effectively increase the 3D printing structure’
s porosity, foamed and crosslinked (1st crosslinked) hydrogel, gelatin- norbornene, was used as a base material for creating porous and granular hydrogel in this experiment.
Gelatin is one of the widely used materials in biology due to its excellent biocompatibility, biodegradability, and availability. However, due to its lack of mechanical properties, researchers have been modified different functional groups onto the gelatin backbone to increase mechanical property by inducing crosslinking. Norbornene modified gelatin, GelNB, was selected in this experiment due to two major reasons. Because crosslinking mechanism of GelNB includes photocrosslinking, it can be used in stereolithography 3D printing. Moreover, the crosslinking mechanism is one-to-one reaction between norbornene group with thiol linker group, crosslinking density can be easily calculated and controlled by simply adjusting the dithiol crosslinker molecules. These properties of GelNB provide special characteristics of partial crosslinking or sequential crosslinking ability. This means that we can target about 40-50% of the norbornene group to be cross-linked first, and fabricate this to have different granular shapes. And then, by simply adding more thiol crosslinker molecules, the unreacted remaining norbornene groups inside the granular particles can be crosslinked again to create the inter-
10 particle connection.
Employing this special characteristic of granular GelNB, we suggest to first create a GelNB foam which contains multiple micro-sized pores and 1st crosslinking (partial crosslinking) it to maintain the porous structure. Then, fabricate the bulk foam into the granular shape for allowing it to have shear thinning and self-healing which can be implemented to the 3D extrusion printing or injection-based methods. Then, by modifying printing parameters such as jamming density or layer thickness or printing ink types (particle size of the ink), evaluate how % porosity and pore size distribution are affected by these parameters.
11
2. Experiments
2.1. Materials
For synthesis of Gelatin-Norbornene, N,N-Dimethylformamide anhydrous (Sigma-Aldrich; 227056-250 mL), Dimethyl sulfoxide anhydrous (Sigma-Aldrich, 276855-1L), exo-5-Norbornenecarboxylic acid (Sigma-Aldrich, 718149-5G), Gelatin type A (porcine skin) (Sigma- Aldrich), N,N’-Dicyclohexylcarbodiimide (DCC) ( Sigma-Aldrich, D80002-100G), N-hydroxysuccinimide (Sigma-Aldrich, 13067-25G) were purchased from Sigma-Aldrich. 4-Arm PEG, hydrochloric acid (HCl), Dialysis bag was purchased from Sigma-Aldrich. For fabrication and particle ink formulation, Lithium phenyl-2,4,6- trimethylbenzoylphosphinate (LAP) (Sigma-Aldrich, 900889), 400,000 mw fluorescein isothiocyanate (FITC), 1,4-dithiothreitol (DTT) (Sigma- Aldrich), 36W LED 501B UV Flashlight Blacklight (Amazon), Disposable Syringe Needle 16G, 18G, 21G, 23G (BD PrecisionGlideTM Needle), Vegetable Chopper (KitchenArt), Blender 800W were used.
For confocal microscopy image, confocal microscope (Olympus) with laser 405, 473, 635nm and 4x, 10x was used. For analysis, ImageJ (NIH) and GraphPad Prism version 5.01 software were used. For Extrusion 3D printing, 3D Bio printer (T&R biofab) was used.
12
2.2. Synthesis of base material: Gelatin- Norbornene (Gel-NB)
Synthesis of gelatin-norbornene can be done by substitution of norbornene functional group onto the free amine of the gelatin backbone. The synthesis process was referenced from with some
modification of reactants (15). This process can be summarized into four major steps: (1) DCC-NHS coupling for activation of carboxylic acid functional group, (2) Amide bond formation between activated
norbornene-carboxylic acid group and free anime of gelatin type A, (3) Cold Acetone quenching for separating synthesized gelatin-norbornene (Gel-NB), (4) Dissolve in distilled water (DW) and dialysis, and after then, obtain 7.4 pH and freeze/dry. Lastly, synthesized Gel-NB was confirmed its structure and % degree of saturation (%DS) using 1H-NMR and TNBSA assay.
2.2.1. Activation of carboxylic acid functional group of norbornene-COOH using DCC-NHS coupling
At room temperature, obtain 167.86 mg of norbornene-COOH and 208.9 mg of DCC (as a limited reagent) and dissolve in 50 mL of DMF via cannulation under N2. After completely dissolve the norbornene- COOH and DCC, measure 174.765 mg NHS and dissolve it in 20mL of DMF under N2. Mix norbornene-COOH and DCC with completely dissolved NHS via cannulation. Do the reaction at room temperature for at least 25 hours for allowing complete reaction of DCC since the
13
unreacted DCC may result in gelatin crosslinking during the next reaction step. Degassing three times. The resulting intermediate is norbornene-succinimidyl ester.
2.2.2. Amide bond formation between activated norbornene-carboxylic acid group and free amine of gelatin type A
Obtain 5 g of gelatin type A and dissolve it in 150 mL of anhydrous DMSO at 50°C via cannulation under N2. When the gelatin is completely dissolved, add norbornene-succinimidyl ester solution from the previous procedure (2.2.1) via cannulation with N2. Constantly mixing the two solutions for 8-24 hours with constant stirring in order to obtaining a desired % degree of saturation (DS) of norbornene on gelatin.
2.2.3. Cold Acetone quenching for separating synthesized gelatin-norbornene (Gel-NB)
To separate gelatin-norbornene and remaining other unreacted/excess materials, cold acetone quenching was proceeded.
For 200 mL of reactants, 2 L of cold acetone was prepared for quenching. Carefully pour the reactants from the procedure 2.2.2.
into the cold acetone and stir it well to obtain the opaque white solidified gelatin norbornene. Vacuum filtrate the solution to separate the opaque white solidified gelatin-norbornene.
14
2.2.4. Dissolve in distilled water (DW) and dialysis and freeze/dry
Obtain 200 mL of Distilled water and dissolve the solidified gelatin-norbornene attained from the previous procedure with constant stirring and heating at 50°C. After confirming complete dissolving of the solidified gelatin-norbornene, pour into the dialysis bag (Spectra/por 4: MWCO 12-14kDa). Perform dialysis for 48-72 hours and every 6-8 hours at 50°C against DW. After dialysis, pH was adjusted to 7.4 using NaOH followed by freezing (-80°C overnight) and drying under vacuum. The resulting white powder was confirmed its structure and determined its %DS via 1H-NMR and TNBSA (2,4,6-trinitrobenzene sulfonic acid) assay which can detect free amino groups in the polymer solution with plate reader measured at 335nm. 1H-NMR (Gelatin-NB, 𝛿, ppm) analysis was done using the equation shown below as used in the previous studies on gelatin-norbornene (15).
𝑫𝑺 (%) =
(𝑰𝟔.𝟑𝟑𝒑𝒑𝒎+ 𝑰𝟔.𝟐𝟖&𝟔.𝟐𝟔𝒑𝒑𝒎+ 𝑰𝟔.𝟎𝟎𝒑𝒑𝒎 𝟐 ∗ 𝟎. 𝟎𝟑𝟖𝟓 𝒎𝒐𝒍
𝟏𝟎𝟎𝒈
7 𝑰𝟏.𝟎𝟏𝒑𝒑𝒎
𝟎. 𝟑𝟖𝟑𝟔 𝒎𝒐𝒍 𝟏𝟎𝟎𝒈
∗ 𝟏𝟎𝟎
=9𝑰𝟔.𝟑𝟑𝒑𝒑𝒎+ 𝑰𝟔.𝟐𝟖&𝟔.𝟐𝟔𝒑𝒑𝒎+ 𝑰𝟔.𝟎𝟎𝒑𝒑𝒎:
𝟐 ∗ 𝑰𝟏.𝟎𝟏𝒑𝒑𝒎 ∗ 𝟗. 𝟗𝟔 ∗ 𝟏𝟎𝟎
15
2.3. Fabrication of Gel-NB foam particle
Prepare 5 % (weight per volume (w/v)) gelatin-norbornene (GelNB) solution and add 40 % norbornene-functional group targeting DTT. Add 1 % (w/v) LAP solution by volume to the polymer solution to make up the final solution concentration of 0.1 % (w/v) LAP. Add 1 mg of 400kDa FITC per 10 mL of polymer solution. Mix well at 37°C and using the milk foam stirring rod to operate for 30 seconds to create the gelatin-norbornene foam, GelFoam. GelFoam was then exposed to UV for 60 seconds to permanently maintain its foam structure by photo crosslinking (1st crosslinking).
2.3.1. Fabrication of Gel-NB using 16G, 18G, 21G, 23G needles
After the 1st crosslinking of the GelFoam, fully swell the GelFoam in DW overnight. Then, pre-cut the fully swelled whole GelNB foam with vegetable chopper to reduce the initial size of the whole gel.
Load the chopped GelNB foam into the 10mL syringe with 16G needle.
Extrude, reload the polymer, and repeat this for 50 times to create the 16G particle. For smaller particle preparation, continue extruding with the smaller needle size. For example, in preparing 21G GelNB foam particles, start from 16G GelNB foam particles, and extrude with 18G needle and then extrude again with 21G needle.
16
2.3.2. Fabrication of Gel-NB using blender
Blender fabricated particles were prepared by blending the whole GelNB foam for 30seconds to maintain the average particle size of 200-300 um in diameter.
2.4. Preparation of 3D multi-scaled porous scaffold using Gel-NB foam particle-based ink
Particles prepared in the procedure 2.3. are further prepared to use as a particle-based ink. Different jamming density is required for different type of 3D printing.
2.4.1. 3D multi-scaled porous scaffold using extrusion- based 3D printing
Extrusion-based 3D printing requires printing ink to exhibit shear thinning and self-healing characteristics. In order to maintain these two characteristics, proper jamming is necessary.
Maximum jamming can be done first by centrifugation at 2500 RPM for 20 minutes for three time and then further vacuum filtration if necessary. After jamming the ink, incubate with 10 mL of 1% LAP solution (excess) for 15minutes, and redo the jamming process by centrifugation. Add excess amount (3x) of 4-arm- PEG thiol (MW 5000Da, JenKem), and incubate for 5 minutes
17 before printing.
Porous scaffold structure can be printed directly onto the glass cover using z-code or onto the clear acrylic box filled with a sacrificial bath consists of 30% (w/v) Pluronic F127. Once the 3D structures are printed, structures were exposed to an ample amount of UV (3 - 5 minutes).
2.4.2. 3D multi-scaled porous scaffold using PDMS mold-based soft lithography
Constructing 3D multi-scaled porous scaffold can be done using PDMS mold based soft lithography. This can be done by first jamming the particle ink to achieve injectability. Once the maximum jamming is achieved, divide inks into three different groups to prepare least (3 mL of 1% LAP solution into the 10 mL of jammed polymer), medium (1.5 mL of 1% LAP solution into the 10 mL of jammed polymer), most (0 mL of 1% LAP solution into the 10mL of jammed polymer) dense ink particles. All inks were fabricated with the same needle gauge (e.g., 18G fabricated ink particles for all three groups).
PDMS mold containing four cylinders with 2cm in diameter and 1cm in depth was prepared. Three groups with different jamming density were each loaded to three different 5 mL volume syringes with 16G needle and injected into the cylindrical shape in the PDMS mold. Exposed these injected structures to the UV light for 5 minutes to achieve 2nd photocrosslinking of GelNB foam.
18
2.4.3. 3D multi-scaled porous scaffold using stereolithography (STL) 3D printing
Unlike the ink used in extrusion printer, stereolithography (STL)-based 3D printing ink should not exhibit self-healing and shear thinning. However, particle should be jammed enough to maintain a close distance to ensure enough contact area for 2nd crosslinking. Because stereolithography printing utilizes a layer-by- layer photomask printing process, if the ink is too sparse, it simply does not print. Therefore, trial and error attempts for finding an appropriate printing jamming density were done, and for 30mL of 18G fabricated ink particles (maximum jammed), adding 10mL of excess LAP solution and excess 4-arm-PEG dithiol 5K to loosen the jamming of the ink particles and preparing for STL-based 3D printing.
2.5. Rheological Studies
To measure rheological properties of the fabricated and jammed GelNB foam particle ink, Rheometer (Discovery HR-1, TA Instrument) was used. All measurements were carried out at room temperature using a 20 mm parallel plate and Peltier plate steel. Storage and loss moduli were measured with increasing strain (0.05 – 100 %) at 1Hz or repeated 0.5% and 500% strains at 1Hz.
19
2.6. Confocal microscope imaging and % porosity and pore size distribution analysis
Schematics 1: Preparation of Confocal Image Samples (Created using Biorender.com)
Once fabricated 3D scaffold structures were obtained from extrusion printing, PDMS mold-based soft lithography by injection and stereolithography printing, each scaffold was casted into 5 % (w/v) low melting alginate solution and cooled at 4°C. Once the gel solidified, scaffold-containing gel was loaded into the tissue slicer and sliced at a thickness of 50 um. These sliced scaffolds are then loaded into cover glass for taking confocal microscopic image.
Confocal images were taken with FITC-wavelength laser setting in the Olympus software, and z-stack with 20 nm slice in thickness.
Each image was obtained for each sample groups for further analysis in its porosity and pore size distribution using ImageJ software. Analysis method for calculating % porosity was to convert the sliced image into 8-bit and adjust the threshold to the same amount for all images in each
20
comparison group. And then simply calculate the porous (non-gel) area over the whole area. Pore size distribution analysis was done as
following: after the threshold adjustment, measure the diameter of each individual pores and collect all the data to analyze the pore sizes in each layer of the 3D scaffold.
After analyzing the images using ImageJ, GraphPad Prism version 5.01 software was used to graph and to perform statistical analysis.
21
3. Results and Discussion
3.1. Synthesis of Gelatin-Norbornene
Gelatin norbornene is a desirable material for fabricating multi- porous 3D scaffold using both extrusion and stereolithography 3D printer, as well as injection and PDMS mold. Not only due to its excellent biocompatibility and biodegradability, but also its one-to-one ene-thiol reaction which results in the crosslinking of the gel. By controlling either the % DS of norbornene functional groups in the base material or the amount of thiol linker added to the polymer solution, we can adjust final scaffold’s mechanical property. More importantly, 1st and 2nd crosslinking terminology can be used in this type of finely controllable one-to-one photo-crosslinkable gel. For the 1st crosslinking process, we simply aim to target crosslinking about 40-50% of the norbornene group by adding calculated amount of thiol linker aims for that crosslinking density. Then, after fabricating this 1st crosslinked particles, by simply adding additional thiol linkers and excess amount of photo initiators and UV exposures, 2nd crosslinking can be obtained to finalize the porous 3D structure of the scaffold.
22
For this reason, gelatin-norbornene is a crucial base material for this experiment. Figure 1. Shown in below is a schematic summarizing this experiment.
Figure 1: Experimental Overview of GelNB Foam Particle-Based 3D Scaffold Fabrication. (Created with Biorender.com)
The very first step in this experiment is to synthesize 55-65 %DS GelNB as a base material for the entire experiments. Figure 2 below shows the overall synthesis process for GelNB. DCC/NHS coupling was used for activating carboxylic acid functional group next to the norbornene. The synthesized GelNB was further analyzed with 1H-NMR and TNBSA to calculate %DS of norbornene group in the Gelatin backbone.
Because TNBSA assay measures the % free amine group and exhibit its result in light absorption at 355nm, in order to accurately calculate the %DS of GelNB, comparison with the gelatin backbone standard curve is necessary. Figure 3 below shows a representative TNBSA assay result and the same sample’s 1H-NMR result and calculated %DS using each of
23
the methods. TNBSA assay showed 62 %DS GelNB while 1H-NMR result showed 68 %DS GelNB. Although the calculated results were not exactly the same value, within 6% error range, two values for %DS calculated by two very different experiments came out to be fairly comparable.
Figure 2: Gelatin-Norbornene Synthesis Process.
Figure 3. Confirmation and calculation of % DS of GelNB using TNBSA assay and 1H-NMR.
In this synthesis process, DCC was used as a limiting reagent. In developing recipe for synthesizing 55 to 65 %DS GelNB, Hoorick et al.
previously studied that the reaction time and the ratio between DCC to norbornene-COOH are two major factors affecting %DS in GelNB synthesis (15). As DCC to norbornene-COOH increases, %DS of GelNB increases; moreover, as reaction time increases from 8 hour to 24 hours, %DS of GelNB increases. For example, as low as 20% DS Gelatin Norbornene was determined where DCC-to-NB ratio being 0.75 to 0.9
24
with an 8 hour reaction time, and as high as 82% where DCC-to-NB ratio was 1.5 to 1.6 with the 24 hour reaction time. For obtaining the desired % DS of norbornene group onto the free amine of the gelatin type A, DCC- to-NB ratio of 0.75 to 1.6- and 24-hour reaction time were required as shown in Figure 4 below. By implementing these data, we were able to set up a recipe that effectively and accurately targets for ~60% DS GelNB.
Figure 4: Graph Describing How %DS is Affected by Reaction Time vs.
Reactant Ratio
25
3.2. Analysis of micro-sized pore within the GelNB foam particle
Using foamed and crosslinked hydrogel prior to further granulize/fabricate the hydrogel provide two different types of pores to form: (1) fixed sized pores within the GelNB foam particle—micro-sized intra particle pores, (2) dynamic pores which can be controlled by different printing method (parameter include Layer Thickness in SLA printer) or ink types (such parameters including ink particle size, ink jamming density)—inter-particle pores.
In Figure 5, a representative image of 21G fabricated particles is shown. As shown in the figure, many micro-sized pores exist in each particle and the graph shown in the Figure 6 shows the size distribution of each pore and its average size in diameter [𝜇m]. The data shows that the intra-GelNB foam particle has pores ranging from 30 to 250 𝜇m in diameter and on average, about 120 𝜇m in diameter.
Figure 5. Confocal Microscope Image of 21G Fabricated Particle:
Each particle contains micro-sized intra pores formed by foam.
26
Figure 6. Size Distribution of micro-sized intra particle pores formed by gas foaming.
3.3. Ink Particle Size and Shape Analysis
3.3.1. Size Analysis of Ink Particles
Ink particles were produced from 1st crosslinked GelNB foam by multiple extrusion (50 times repeated) with various sizes (16G, 18G, 21G, 23G) of syringe needles and blender. Figure 7 shows representative confocal microscopy images of 18G fabricated, 21G fabricated, and blended particles. Considering the inner diameter of 18G needle is 838 𝜇m, 21G needle is 514 𝜇m, particle size shown in the confocal microscopy images confirm the each of the needle-fabricated particle size are corresponds with the inner diameter of the needle gauge used for fabrication. In Figure 8, each of the particle size (diameter of the particle)
27
were measured and graphed by fabrication group. 18G fabricated group particles showed an average particle size of 881 𝜇m in diameter and 21G needle fabricated group showed 526 𝜇m in diameter while blended particles showed 377 𝜇m in diameter. Although 18G fabricated particle showed wide distribution of sizes, majority of the particles showed the diameter range within the average or one standard deviation apart from it. 21G fabricated particles and blended particles showed more precise particle distribution compare with those of 18G fabricated particles.
Figure 7. Confocal Microscopy Images of Representative Particles Fabricated with 18G needle, 21G needle, and blender for 30 seconds.
18G = 838um ID Needle Fabricated
21G = 514um ID Needle Fabricated
Blended for 30sec
28
Figure 8. Size Analysis of the Particles Fabricated with 18G needle, 21G needle, and blender for 30 seconds.
3.3.2. Shape Analysis of Ink Particles
Because of the micro-sized pores within the particles, each of the fabricated particles does not have a perfectly circular shape. When these irregular surfaced particles are used as a print ink for 3D printer or soft lithography, size of the inter-particle pores may be affected by the surface shape of the ink particles. Therefore, in this experiment, particle shape analysis was done for each fabricated particle group.
Figure 9 shows the solidity of each particle groups and Figure 10 shows the circularity trend of each particle groups. Solidity is a measurement of how particle has smooth, and linked surfaces. For example, shape that has solidity value 1 is either a perfect circle or perfect convex area. As opposed
Particle Size [mm2]
18G
21G
Mixer
0.0 0.5 1.0 1.5
2.0 0.7767
0.2764
0.1421
N=50
881um Average
Diameter 526um 377um
Particle Size [mm
2]
18 G
21 G
M ixe r
0.0 0.5 1.0 1.5
2.0
0.7767
0.2764
0.1421
N=50
***
***
***
29
to the bony structured particles where the surface shape is not linked and consisted with many spiked shapes have low solidity value close to 0.
According to the solidity analysis, when particle size decreases solidity also increases, whereas 18G and 21G particle did not show any significant difference in shape analysis.
Figure 10 displays the circularity trends of each particle group.
Circularity shows how shape is closer to the perfect circle. For example, the perfect circle has a circularity value of 1 and regardless of the surface roughness, if the particle’s overall diameter and shapes are more circular, it has higher circularity. According to the circularity analysis, blended particle group, the smallest in size, has the highest circularity value. Although the average circularity of 18G particles is slightly smaller than those of 21G particles, statistical analysis showed that 18G and 21G group particles exhibited no significant differences in circularity trends. However, both statistical analysis between 18G group and blended group and 21G group and blended group showed a significant increase in circularity trends, as well as solidity trends. Therefore, as a particle size decreases, circularity and solidity tend to both increases.
30
Figure 9. Particle Shape Analysis: Solidity Trends of Fabricated Particles Vary in Size.
31
Figure 10. Particle Shape Analysis: Circularity Trends of Fabricated Particles Vary in Size.
32
3.4. Rheology Analysis of Jammed Particle
To examine the extrusion printability of the jammed and fabricated ink particles, rheology analysis was performed. Figure 11 shows the jammed particle’s shear yielding analysis where the oscillation strain increases from 0.05% to 100% and measuring the storage modulus (G’) and loss modulus (G’’) of each particle group. After gradually increasing the oscillation strain to 50%, G’ of each groups decreases sharply which indicates that it is losing its solid-like properties where G’’ of each groups increases sharply and cross over G’ at oscillation strain of about 65% and this G’ and G’’ cross indicates that the solid-like properties of initially jammed particles changed into liquid-like properties when 65% or more oscillation strain was given to the jammed particle. Therefore, this data successfully shows the shear thinning properties of jammed particle at all types tested in this graph (21G, 23G, blended).
Figure 11. Shear Yielding of Jammed Particles
1st CL Gel Shear Yielding
0.01 0.1 1 10 100
100 1000
21G G' 23G G' Mixer G' 21G G'' 23G G'' Mixer G''
Oscillation Strain [%]
Storage Modulus G' [Pa] Loss Modulus G'' [Pa]
33
Another important property showing the extrusion printability and injectability is self-healing. This property can be examined by apply high strain (500% strain) and shift to the very low strain (0.5% strain) while measuring storage modulus and loss modulus of each sample, as shown in the Figure 12 below. When storage modulus is below the loss modulus during the high strained period, the data indicates the samples exhibits the shear thinning at high strained region. However, when the applied high strain is removed, if the sample immediately recover its G’, storage modulus value as high as the prior low strained region, it successfully shows the self-healing properties of the jammed materials.
As observed from the Figure 11 and Figure 12, rheology data successfully indicate that all jammed samples evaluated in these figures (21G, 23G, blended) exhibit shear thinning and self-healing properties which also indicate particle inks’ syringe injectability and 3D extrusion printability.
Figure 12. Rheology Data showing Self-Healing of Jammed Particles.
34
3.5. Extrusion Printing Using Jammed Particle
After successfully determine each particle ink’s rheological properties and confirming the extrusion printability, extrusion printing of a star shape and square-shaped stair printing were shown in a Figure 13. Figure 13 shows the successful extrusion-printed sample in a flat surface and more complex and over-hanging structure printing in a 30% (w/v) Pluronic F-127 printing bath.
Figure 13. Extrusion 3D Printing: Print Samples Implementing Fabricated Particle Ink.
3.6. Confocal Image: Porosity Comparison with Jamming Density
At all density tested above, prepared inks were successfully injectable to the prepared PDMS mold. Injected inks were exposed to UV light for 60 seconds, and soft lithography techniques was done to obtain the resulted structure.
Confocal Microsoft images shown in the Figure 14 shows that the most densely jammed ink resulted in the least % porosity. The least densely
35 jammed ink showed the highest % porosity.
Figure 14. Confocal Microscopy Image on How Jamming Density Affects the Porosity of the Resulting 3D Structures.
3.7. %Porosity Analysis with Jamming Density
Jamming density can be an important parameter when making molded and soft lithography-based 3D structure with injectable needle. Extrusion printing may also alter the jamming density of the particles if all jammed conditions exhibit an adequate self-healing and shear thinning properties. If this parameter, jamming density, can control % porosity of the structure, it will be very useful technique for tissue engineering the more complex organ.
As Figure 15 is shown, % Porosity increases as jamming density
decreases and the number of pores increases as jamming density increases as shown in Figure 16. However, size of the pores showed no significant tendency with the jamming density.
36
Figure 15. %Porosity Comparison with different Jamming Density
37
Figure 16. Pore Size Distribution Analysis with the different Jamming Density Samples
Number of pores: 31 36 60
38
3.8. Confocal Image: %Porosity Comparison with Samples Printed with SLA 3D printer differ in layer thickness
In this section of experiment, stereolithography-based 3D printer was used to print more complex 3D structure while maintaining multi-porous structures. Layer thickness is an important parameter that can be adjusted for stereolithography-based 3D printing, and this is a printing layer height in z-axis direction. Because the printing inks were fabricated to have different sized particle, layer thickness may be a key parameter that determines inter particle porosity and printing precision/resolution. As shown in the Figure 17, if the layer thickness is much less than the particle diameter, the printing resolution may be fine but it may result no inter particle pores or very small in size and seldom number of inter particle pores.
39
Figure 17. Schematics on how layer thickness and particle ink size affect printing resolution and porosity
For example, this association between particle diameter and layer thickness are shown in the confocal image of the printed sample using blended particle ink varying layer thickness. In the previous section, we determined the average diameter of blended particle as about 300 𝜇m. In this printed sample comparison shown in the Figure 18, layer thickness of 0.2 mm and 0.5 mm were used and compared for % porosity. At 0.5 mm Layer Thickness, where the layer thickness was slightly larger than the average blended sample’s particle size (in diameter), we observed multiple inter-particle-like pores with a size larger than 50 𝜇m. While at 0.2 mm Layer Thickness sample, only 50 𝜇m or smaller pores were observed, and it seems like the majority of the pores observed in this structure are intra-particle pores which may have made by the very first gas-foam step of the fabrication procedure.
40
Figure 18. Confocal Image – Porosity Comparison with Layer Thickness
when the particle average diameter is fixed.
Now, further analysis on % porosity and pore size distribution comparison on three different layer thickness (0.2 mm, 0.5 mm, 0.8 mm) were performed. For this data, particle size was fixed at 18G fabricated samples (~800 𝜇m in diameter). Figure 19 shows 8-bit converted confocal image of the sliced samples printed with 18G fabricated particles varying in layer thickness using STL 3D printer. White region showing in this figure represents the empty pore and black represents the gelatin area. Just from an observation, the proportion of black area increases as layer thickness decreases and vice versa. Corresponding printed structures are displayed right below the confocal images. When layer thickness is larger than the average particle size, printed structure is too porous and mechanically too weak to maintain its full structure, therefore printing of the whole structure was failed as shown in the Figure 19. While 0.5 mm layer thickness condition
41
showed porous and structurally stable printed structure which successfully maintaining its intended 3D structure. For 0.2 mm layer thickness sample, more precise overall 3D structure was printed but much less porous inner structure was observed.
Figure 19. Confocal Microscopy Image and Images of Printed Samples of 18G Fabricated Particles Differing Layer Thickness of STL 3D Printer.
0.8mm 0.5mm 0.2mm
42
Figure 20. Calculated % Porosity of Cross Section of STL 3D Printed Structures.
Now, further analysis on % porosity was done on the Figure 20.
Figure 20 exhibits the calculated % porosity of each structural cross section.
Result shows that the % porosity increase as layer thickness increases when the particle size remained the same.
Now, further analysis on the individual pore size and overall pore size distribution within each structural samples was performed. Figure 21 shows the % frequency of different size groups of pores and it is shown that 0.2 mm layer thickness samples mostly have pore sizes less than 300 𝜇m.
On the other hand, 0.5 mm and 0.8 mm layer thickness samples have larger size pores (300 𝜇m or greater in diameter) and much less number of smaller pores. Average pore size also increased from 0.2 mm to 0.5 mm samples.
Although further analysis is needed, result showed that the both pore size and % porosity of the structure increases as the layer thickness increases.
43
Figure 21. Pore size distribution and average pore size analysis on 18G ink printed samples with STL 3D printer varying in layer thickness.
Pore size Distribution
100um or less
100-300um
300-500um
500um or more 0
20 40 60
80 0.2mm
0.5mm 0.8mm
Pore size groups
% Frequency
Pore size Distribution
100um or less
100-300um 300-500um
500um or more 0
20 40 60
80 0.2mm
0.5mm 0.8mm
Pore size groups
% Frequency
Pore Size of the structure
0.2mm
0.5mm
0.8mm 0
500 1000 1500 2000
Diameter[µm]
Pore size Distribution
100um or less 100-300um
300-500um 500um or m
ore 0
20 40 60
80 0.2mm
0.5mm 0.8mm
Pore size groups
% Frequency
NS
***
44
4. Conclusion
To develop a simpler and more effective way to fabricate 3D multi-scaled porous scaffold was my research goal in this project. There were four separate fabrication strategy were introduced to create multi-sized pores.
First parameter was the partially crosslinked gelatin norbornene foam structures. By implementing gelatin norbornene as a base material, it was possible to first create the partially crosslinked GelNB Foam (1st crosslinked:
40% of norbornene functional groups existing in the synthesized GelNB) which contains micro-sized pores varies in diameter from 30 𝜇m to 300 𝜇m.
Then, second parameter was the size of the fabrication GelNB foam particles by implementing multi-extrusion strategy with different sizes of syringe needles. Using this method, it was possible to create a particle which has a diameter as small as 300 𝜇m to a particle which has a diameter as large as 1000 𝜇m (16G needle fabricated sample, data not shown).
Third parameter was to control the jamming density of these particle ink when construct a scaffold using PDMS-mold based soft lithography or extrusion-based 3D printer. Because jammed particles exhibit an excellent shear thinning and self-healing characteristics, it was possible to control three different jamming density (most dense, medium dense, and least dense) print ink and still be injectable using 16G Syringe needle. Although extrusion printing samples were not analyzed for jamming density, the simpler version of 3D scaffolds created with PDMS-mold injected soft lithography was evaluated with different jamming density and the cross-sectional confocal
45
microscopy imaging analysis showed that the % porosity increases when the jamming density decreases. However, particle size distribution did not show any clear trends, except for the number of pores increases as the jamming density decreases and vice versa.
Lastly, the fourth parameter was to modify one of the important parameter in STL-based 3D printer: layer thickness. When we evaluate %porosity and different layer thickness values, it is also important to consider the size of the individual particle used in the print ink. This is because if the particle size is much smaller than the layer thickness, particle to particle connection may get lost and fail to form inter-particle crosslinking which means it is not possible to print the structure. The result in this experiment also showed this for 18G fabricated ink printed scaffold using STL-3D printer with 0.8 mm in layer thickness. Considering 18G particles’ average size was about 0.8 mm in diameter, and there was wide distribution of the particle in this fabricated particle group which were even smaller than 0.8 mm in diameter, it was not surprising to see the failed printing result (or partially printed structures) as shown in Figure 19. Therefore, the layer thickness is an important parameter which is not only closely related to the particle size but also determines % porosity and pore size distribution, as well as printing resolution for stereolithography-based 3D printer.
In conclusion, through this experiment, we were able to show a simpler and easier method of printing 3D multi-porous scaffold which has a complicated 3D design as a proof-of-concept.
When we consider all four parameters and clearly evaluate how they
46
impact the % porosity and pore size distributions, in the future, it may be possible to print more complicated organ-like structure (such as heart, lung, or skin) by carefully designing a complicated 3D structure that requires different % porosity and pore size distributions for many different sections within the structure.
1
Bibliography
1. “Tissue engineering and regenerative Medicine.” National Institute of Biomedical Imaging and Bioengineering, U.S. Department of Health and Human Services, https://www.nibib.nih.gov/science- education/science-topics/tissue-engineering-and-regenerative- medicine.
2. Hollister, S. Porous scaffold design for tissue engineering.Nature Mater4,518–524 (2005). https://doi.org/10.1038/nmat1421 3. DJ, Yoo et al., “An Advanced Mutli-Morphology Porous Scaffold
Design Method using Volumetric Distance Field and Beta Growth Function”. International Journal of Precision Engineering and
Manufacturing Vol. 16, No. 9, pp. 2021-2032. 10.1007/s12541-015- 0263-2.
4. Ovsianikov A., Yoo J., Mironov V. 3D Printing and Biofabrication. Springer; Berlin/Heidelberg, Germany: 2018.
5. Mosadegh B., Xiong G., Dunham S., Min J.K. Current progress in 3D printing for cardiovascular tissue engineering. Biomed.
Mater. 2015;10:34002. doi: 10.1088/1748-6041/10/3/034002.
6. Collins, M. N., Ren, G., Young, K., Pina, S., Reis, R. L., Oliveira, J.
M., Scaffold Fabrication Technologies and Structure/Function Properties in Bone Tissue Engineering. Adv. Funct. Mater. 2021, 31, 2010609.https://doi.org/10.1002/adfm.202010609
7. A. Haider, S. Haider, M. R. Kummara, T. Kamal, A.-A. A.
Alghyamah, F. J. Iftikhar, B. Bano, N. Khan, M. A. Afridi, S. S. Han, J.
Saudi Chem. Soc. 2020, 24, 186;
8. M. S. Khoramgah,J. Ranjbari,H. A. Abbaszadeh,F. S. T.
Mirakabad, S. Hatami, S. Hosseinzadeh, H.
Ghanbarian, Bioimpacts 2020, 10, 73.
9. A. Wubneh, E. K. Tsekoura, C. Ayranci, H. Uludağ, Acta Biomater. 2018, 80, 1;
10. P. N. Christy, S. K. Basha, V. S. Kumari, A. Bashir, M. Maaza, K.
Kaviyarasu, M. V. Arasu, N. A. Al-Dhabi, S. Ignacimuthu, J. Drug Delivery Sci. Technol. 2020, 55, 101452.
2
11. A. Haider, S. Haider, M. R. Kummara, T. Kamal, A.-A. A.
Alghyamah, F. J. Iftikhar, B. Bano, N. Khan, M. A. Afridi, S. S. Han, J.
Saudi Chem. Soc. 2020,24,186;
12. J. Melke,S. Midha,S. Ghosh,K. Ito,S. Hofmann,Acta Biomater. 2016, 31, 1;
13. King, Martin et al. "Structural Design, Fabrication and Evaluation of Resorbable Fiber-Based Tissue Engineering Scaffolds".
Biotechnology and Bioengineering, edited by Eduardo -Lopes, Leila Zepka, IntechOpen, 2019. 10.5772/intechopen.84643.
14. Qazi, T. H., Wu, J., Muir, V. G., Weintraub, S., Gullbrand, S. E., Lee, D.,Issadore, D.,Burdick, J. A.,Anisotropic Rod-Shaped Particles Influence Injectable Granular Hydrogel Properties and Cell Invasion.Adv. Mater.2022,32,
2109194. https://doi.org/10.1002/adma.202109194
15. Van Hoorick, J., Gruber, P., Markovic, M., Rollot, M., Graulus, G.- J.,Vagenende, M.,Tromayer, M.,Van Erps, J.,Thienpont,
H., Martins, J. C., Baudis, S., Ovsianikov, A., Dubruel, P., Van Vlierberghe, S., Macromol. Rapid Commun. 2018, 39,
1800181. https://doi.org/10.1002/marc.201800181
3
국문 Abstract
조직 공학은 인공장기 개발 분야에서 굉장히 중요시 되는 연구분야 중 하나인데, 이 이유는 인공 조직이 많은 치료제 전달 물질로 쓰이기도 하고 implantation 물질로 상처 있는 조직이나 구조적 회복을 빠르게 도 와주는 물질로 쓰이기 때문이다. 이러한 효과적인 인공 조직을 개발하기 위해서는 실제 체내에 있는 native 조직의 복잡한 구조를 구현하는 것과 동시에 다양한 물리적 성질을 모사하는 것이 중요하다. 물리적 성질과 복잡한 내부 구조는 porosity와 크게 연관이 있는데, 이는 porosity가 높을수록 물리적으로 조직이 약해지고 그 반대의 경우 강해지기 때문이 다. 또한 다양한 체내 조직의 기능을 구현하기 위해서는 porosity를 비 롯하여 세포의 기능을 돕는 다양한 사이즈의 pore를 3차원적인 복잡한 구조에서 컨트롤 해 주는 것이 필요하다. 하지만 현재까지 개발된 전기 방사, 동결건조, solvent leaching, 3D 프린팅 등의 기술 각 각으로는 이 를 효과적으로 구현하기 힘들다.
현재의 방법들을 보완하고 더 발전시켜 다양한 사이즈의 pore를 3차 원적인 구조에서 구현하고, porosity를 조절할 수 있는 스캐폴드 공정 방법 개발을 위해서 이 실험에서 multi-stage crosslinking이 가능한 젤 라틴 노보닌을 베이스 재료로 사용하였다.
먼저 젤라틴 노보닌을 폼 형태로 만들어 마이크로 포어를 형성하여 준 후, 1차 적으로 crosslinking을 시켜 마이크로 포어를 포함한 폼 형태 가 유지되도록 만들어 준다. 그런 다음에는 다양한 사이즈의 주사바늘과 믹서기를 이용하여 폼을 파티클 형태로 잘게 잘라준 후, 이 잘게 자른 파티클을 3D 프린팅 또는 soft lithography 의 잉크 혹은 주 재료로 사 용하여 2차로 추가적으로 경화를 시켜주어 복잡한 3D 모양을 구현하면 서 multi-sized pore를 가지며 프린팅 parameter를 변화시켜 전체 3D 구조의 porosity를 조절 할 수 있는 방법을 발전시키고자 하였다.