• 검색 결과가 없습니다.

A Close Relationship between Non-Alcoholic Fatty Liver Disease Marker and New-Onset Hypertension in Healthy Korean Adults

N/A
N/A
Protected

Academic year: 2022

Share "A Close Relationship between Non-Alcoholic Fatty Liver Disease Marker and New-Onset Hypertension in Healthy Korean Adults"

Copied!
11
0
0

로드 중.... (전체 텍스트 보기)

전체 글

(1)

ABSTRACT

Background and Objectives: Nonalcoholic fatty liver disease (NAFLD) is an excessive accumulation of fat into the liver as a result of increased inflammation and insulin resistance.

Although there can be common pathogenic mechanisms for NAFLD and hypertension associated with the development of cardiovascular diseases, little data are showing the association between NAFLD and hypertension in a large-scale cohort study. Thus, we evaluated the ability of the fatty liver index (FLI), a surrogate marker of NAFLD, to predict the development of hypertension in healthy individuals.

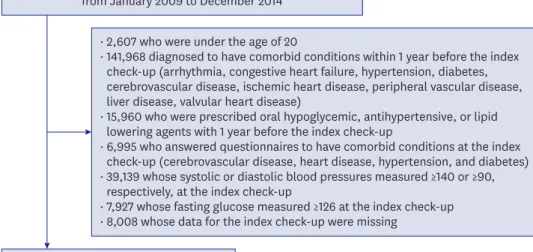
Methods: We included 334,280 healthy individuals without known comorbidities who underwent the National Health check-ups in South Korea from 2009 to 2014. The association between the FLI and hypertension was analyzed using multivariate Cox proportional-hazards models.

Results: During a median of 5.2 years' follow-up, 24,678 subjects (7.4%) had new-onset hypertension. We categorized total subjects into quartile groups according to FLI (range: Q1, 0–4.9; Q2, 5.0–12.5; Q3, 12.6–31.0; and Q4, >31.0). The incidence of hypertension was higher in subjects with the highest FLI than in those with the lowest FLI (Q4, 9,968 [11.9%] vs. Q1, 2,277 [2.7%]; p<0.001). There was a significant correlation between the highest FLI and an increased risk of new-onset hypertension (adjusted hazard ratio between Q4 and Q1, 2.330;

95% confidence interval, 2.218–2.448; p<0.001). FLI was significantly associated with an increased risk of new-onset hypertension regardless of baseline characteristics.

Conclusions: Higher FLI was independently associated with increased risk of hypertension in a healthy Korean population.

Keywords: Fatty liver, nonalcoholic; Hypertension; Healthy people programs

Original Article

Received: Nov 19, 2019 Revised: Feb 10, 2020 Accepted: Mar 10, 2020 Correspondence to Jae-Hyeong Park, MD, PhD

Department of Cardiology in Internal Medicine, Chungnam National University Hospital, Chungnam National University School of Medicine, 282, Munhwa-ro, Jung-gu, Daejeon 35015, Korea.

E-mail: [email protected]

Copyright © 2020. The Korean Society of Cardiology

This is an Open Access article distributed under the terms of the Creative Commons Attribution Non-Commercial License (https://

creativecommons.org/licenses/by-nc/4.0) which permits unrestricted noncommercial use, distribution, and reproduction in any medium, provided the original work is properly cited.

ORCID iDs Jae-Hyung Roh

https://orcid.org/0000-0003-3675-3541 Jae-Hyeong Park

https://orcid.org/0000-0001-7035-286X Hanbyul Lee

https://orcid.org/0000-0002-1479-8995 Yong-Hoon Yoon

https://orcid.org/0000-0002-5598-003X Minsu Kim

https://orcid.org/0000-0001-9230-3137 Yong-Giun Kim

https://orcid.org/0000-0002-0816-9025 Gyung-Min Park

https://orcid.org/0000-0001-5846-0606

Jae-Hyung Roh , MD, PhD

1

, Jae-Hyeong Park , MD, PhD

1

, Hanbyul Lee , MS

2

, Yong-Hoon Yoon , MD

1

, Minsu Kim , MD, PhD

1

, Yong-Giun Kim , MD, PhD

3

, Gyung-Min Park , MD, PhD

3

, Jae-Hwan Lee , MD, PhD

1

, and

In-Whan Seong , MD, PhD

1

1

Department of Cardiology in Internal Medicine, Chungnam National University Hospital, Chungnam National University School of Medicine, Daejeon, Korea

2

Department of Statistics, Kyungpook National University, Daegu, Korea

3

Department of Cardiology, Ulsan University Hospital, University of Ulsan College of Medicine, Ulsan, Korea

A Close Relationship between Non- Alcoholic Fatty Liver Disease Marker and New-Onset Hypertension in

Healthy Korean Adults

(2)

Jae-Hwan Lee

https://orcid.org/0000-0002-6561-7760 In-Whan Seong

https://orcid.org/0000-0003-4628-0258 Funding

This work was supported by Biomedical Research Institute grant, Kyungpook National University Hospital (2017).

Conflict of Interest

The authors have no financial conflicts of interest.

Author Contributions

Conceptualization: Park JH; Data curation:

Roh JH, Lee H, Yoon YH, Kim M, Kim YG, Park GM, Lee JH, Seong IW; Formal analysis:

Roh JH, Lee H; Funding acquisition: Roh JH;

Writing - original draft: Park JH; Writing - review & editing: Roh JH, Park JH, Lee JH, Seong IW.

INTRODUCTION

Non-alcoholic fatty liver disease (NAFLD) is the most common chronic liver disease. Its estimated prevalence is about 15–30% in the general population. However, the prevalence of NAFLD is higher in patients with obesity, insulin resistance and non-insulin dependent diabetes mellitus, and metabolic syndrome.

1)

About 60–70% of patients have NAFLD in obese or diabetic persons.

2)

NAFLD is one of a multisystem disease with increased morbidity and mortality.

3)

There are many pieces of evidence between NAFLD and established

cardiovascular risk factors including abdominal obesity, dyslipidemia, insulin resistance, and high blood pressure.

4)

These cardiovascular risk factors also contribute to metabolic syndrome. Besides extrahepatic malignancies and liver-related complications are common causes of death in patients with NAFLD, cardiovascular disease is the most common cause of death.

5)

Estimation of cardiovascular disease risk in persons with NAFLD can allow having proper medical management and improving their long-term clinical outcomes.

Hypertension is the most common cardiovascular risk factor. In Korea, the age-standardized prevalence of hypertension is about 30% among adults more than 30 years old with the definition of hypertension as systolic blood pressure (SBP) ≥140mmHg or diastolic blood pressure (DBP) ≥90mmHg.

6)

With new definition suggested by the American College of Cardiology/American Heart Association/American Society of Hypertension, SBP ≥130mmHg or DBP ≥ 80mmHg,

7)

the age-adjusted prevalence of hypertension was about 46.0% among US adults over 20 years of age in 2013 to 2016.

8)

Because hypertension is a major component of the metabolic syndrome which strongly linked to NAFLD, the coexistence of NAFLD and hypertension can be common.

9)

Although several studies showing the co-existence of NAFLD and hypertension, they showed a simple association in several cross-sectional studies.

Moreover, the longitudinal studies showing the development of hypertension in patients with NAFLD have limitations of modest sample sizes and relatively short follow-up duration. Thus, we analyzed a large cohort consisting of a healthy Korean adult population without known traditional cardiovascular risk factors and co-morbidities to identify the direct association of fatty liver index (FLI), as a good marker of NAFLD, and new-onset hypertension.

METHODS

Data sources

We analyzed data set from the National Health Insurance Service-National Sample Cohort 2.0 (NHIS-NSC 2.0) which is the population-based cohort data of Korea. The NHIS-NSC 2.0 included about 2% of the total Korean population in 2006 with retrospective and prospective follow-up data from 2002 to 2015.

10)

Korean government stratified total population

(n=48,222,537) into 2,142 classes according to their age, sex, area, eligibility status, and income level. Then, the Korean government randomly selected 2.1% of them from each stratum (n=1,021,208). Because the National Health Insurance covers about 97% of the total population of Korea, the NHIS-NSC 2.0 cohort can represent the entire Korean population.

The cohort includes 4 databases: the dataset of the sociodemographic information of the

population; dataset of medical claims including information on the diagnosis based on the

10th revision of the International Classification of Disease (ICD-10) codes, admission, and

treatment; dataset of the National Health Screening of the cohort members; and dataset of

the medical institutions. Korean government recommends the entire Korean adults to receive

the National Health check-up biennially, which are composed of questionnaires on medical

(3)

history, chest X-ray, physical examinations and blood tests. Health-related behaviors were collected by using standardized self-reporting questionnaires such as smoking status and alcohol consumption. A total of 72.1% of eligible population received National Health check- ups according to the 2013 National Health Insurance Service (NHIS) statistics.

10)

The cohort also includes mortality data from the death registration database of Statistics Korea, a central government organization for statistics.

The NHIS-NSC 2.0 is open to any researchers if the NHIS review committee approves the protocol. The Institutional Review Board (IRB) of the Chungnam National University Hospital approved this study (IRB No. 2019-10-083) and waived the requirement for informed consent.

Study population

This study included adults (≥20 years old) with National Health check-ups more than one time from 2009 to 2014. We set the first check-up as the index check-up and the year of the index check-up as the index year. We excluded all subjects who had the pre-specified exclusion criteria; 1) those who diagnosed with hypertension before the index year, 2) those who with rheumatic or non-rheumatic valvular heart diseases, 3) those who diagnosed with arrhythmia, heart failure, diabetes, cerebrovascular disease, ischemic heart disease, liver disease, or peripheral artery disease, 4) those who with increased baseline SBP ≥140mmHg or DBP ≥90mmHg, and fasting blood glucose ≥126mg/dL at the index check-up, 5) those who with missing data in the index check-up. We assessed each diagnosis based on the 1-year claim data before the index year. When we used the claims data, we defined each diagnosis as the first occurrence during at least two different days of hospital visits (outpatient) or on the first admission, as a likely diagnosis of hypertension. We used the ICD-10 codes to define each diagnosis.

Definition of data

We calculated body mass index (BMI) from body weight (kg) and height (m). The definition of obesity was done with a BMI of ≥25 kg/m

2

by following the World Health Organization guideline for the Asian population.

13)

The survey evaluated alcohol consumption using standardized self-reporting questionnaires. They categorized smoking status into 3 categories: non-smoker, ex-smoker, and current smoker.

The primary outcome of this study was finding the incidence of hypertension. We defined the hypertension incidence as the first occurrence during at least 2 different days of hospital visits, admission for hypertension, or death with a diagnosis of hypertension. Data were censored at the time of hypertension occurrence, disqualification of the NHIS (death or immigration), or the end of the study (December 31th, 2015).

Calculation of fatty liver index

We used FLI, a well-validated surrogate marker of NAFLD,

11)

which was calculated with 4 variables (triglycerides [TG], BMI, gamma-glutamyl transferase [GGT], and waist circumference [WC]) with the following equation:

FLI = (e

0.953×loge[TG] + 0.139×BMI + 0.718×loge[GGT] + 0.053×WC − 15.745

)/

(1 + e

0.953×loge[TG] + 0.139×BMI + 0.718×loge[GGT] + 0.053×WC − 15.745

)×100

The original study showed that the FLI more than 60 as the cutoff for the diagnosis of fatty

liver disease with a positive likelihood ratio of 4.3. Although the FLI is simple to obtain and

(4)

screen fatty liver disease, there has been insufficient evidence regarding the diagnosis of fatty liver disease in Asians with the FLI because of lower BMI and WC than other ethnic populations.

12)

We categorized our study population into quartile groups according to their FLI value.

Statistical analysis

We presented continuous variables as mean±standard deviation and categorical parameters as a number with a percentage. All statistical analyses were performed with R software version 3.3.3 (R Foundation for Statistical Computing, Vienna, Austria; www.r-project.org).

We used chi-square test and one-way analysis of variance tests to check statistical differences among the FLI quartiles. The comparison of cumulative event rates according to the FLI quartiles was done with the Kaplan-Meier method and log-rank test. Adjusted hazard ratios (HRs) and 95% confidence interval (CI) for hypertension incidence were estimated with Cox proportional hazard regression analysis. In the multivariate analysis, we adjusted age and sex in the model 1, and clinical characteristics associated with new-onset hypertension of borderline statistical significance (p<0.100) along with age and sex in the model 2. The p values of <0.05 were considered statistically significant.

RESULTS

Baseline characteristics of the participants

Out of the total population of the NHIS-NSC 2.0 cohort, we analyzed 334,280 subjects after the exclusion of the subjects who met with the pre-specified exclusion criteria. Figure 1 depicted the number of subjects matching each exclusion criterion. We divided our study population into 4 groups according to the FLI quartile values; Q1, 0–4.9; Q2, 5.0–12.5; Q3, 12.6–31.0; and Q4, >31.0. Table 1 compared baseline clinical characteristics according to the FLI quartiles. The subjects with higher FLI had a trend to higher age and higher incidence of males. BMI, WC, blood pressures, the amount of alcohol consumption and the proportion of current smokers tended to increase from Q1 to Q4. Fasting glucose, total cholesterol,

556,884 patients who underwent the National Health check-ups from January 2009 to December 2014

· 2,607 who were under the age of 20

· 141,968 diagnosed to have comorbid conditions within 1 year before the index check-up (arrhythmia, congestive heart failure, hypertension, diabetes, cerebrovascular disease, ischemic heart disease, peripheral vascular disease, liver disease, valvular heart disease)

· 15,960 who were prescribed oral hypoglycemic, antihypertensive, or lipid lowering agents with 1 year before the index check-up

· 6,995 who answered questionnaires to have comorbid conditions at the index check-up (cerebrovascular disease, heart disease, hypertension, and diabetes)

· 39,139 whose systolic or diastolic blood pressures measured ≥140 or ≥90, respectively, at the index check-up

· 7,927 whose fasting glucose measured ≥126 at the index check-up

· 8,008 whose data for the index check-up were missing 334,280 patients included into analysis

Figure 1. Overview of the study population.

(5)

triglyceride, and low-density lipoprotein (LDL) cholesterol were increasing along with the increase of FLI quartiles.

Association between fatty liver index and the incidence of hypertension During the total follow-up duration of a median of 5.2 years (interquartile range, 3.5–6.3), 24,678 subjects (7.4%) had new-onset hypertension. Table 2 shows the result of the univariate analysis of new-onset hypertension. The incidence of new-onset hypertension was higher in the group with male gender, older age, higher BMI, higher atherogenic cholesterol profiles.

Figure 2 demonstrates the cumulative incidences of new-onset hypertension according to the FLI quartiles. The incidence of hypertension was significantly higher in subjects with higher FLIs, compared to those with lower FLIs (Q1, 2,277 [2.7%]; Q2, 4,858 [5.8%]; Q3, 7,575 [9.1%]; and Q4, 9,968 [11.9%]). In multivariate models that were adjusted for age and sex in model 1 and clinical characteristics with borderline statistical significance in model 2, the association between FLI quartile and hypertension incidence remained statistically significant (Table 3). Instead of FLI quartiles, the continuous value of FLI was also statistically significant in the multivariate analysis model 1 and 2. When we used various cutoff-points were tried to categorize the study population, which were suggested by the previous studies (0≤FLI<30, 30≤FLI<60, and FLI≥60, by Bedogni et al.

11)

; 0≤FLI<25, 25≤FLI<35, and FLI≥35 for male, 0≤FLI<10, 10≤FLI<20, and FLI≥20 for female, by Yang et al.

13)

). Regardless of the cutoff-points used, groups with the highest FLI were observed to be at the highest risk for new-onset hypertension (Supplementary Table 1).

Table 1. Baseline characteristics and laboratory findings according to FLI quartiles

FLI quartile p value p for trend p value

between groups

Q1 Q2 Q3 Q4

Baseline characteristics

Age (years) 37.0±11.6 42.3±12.5 44.4±12.6 43.4±11.5 <0.001 <0.001 *

,†,‡,§,∥,

Male (sex) 12,831 (15.4) 32,489 (38.9) 49,372 (59.1) 66,646 (79.7) <0.001 <0.001 *

,†,‡,§,∥,

Height (cm) 161.3±7.1 163.2±8.9 165.3±9.4 168.5±8.5 <0.001 <0.001 *

,†,‡,§,∥,

Weight (kg) 52.1±6.1 58.9±7.3 65.2±8.3 74.8±10.4 <0.001 <0.001 *

,†,‡,§,∥,

BMI (kg/m

2

) 20.0±1.8 22.1±1.8 23.8±2.1 26.3±2.8 <0.001 <0.001 *

,†,‡,§,∥,

Waist circumference (cm) 67.9±4.9 74.9±4.8 80.5±5.1 87.6±6.5 <0.001 <0.001 *

,†,‡,§,∥,

SBP (mmHg) 110.9±11.1 115.4±11.1 118.6±10.6 121.8±10.0 <0.001 <0.001 *

,†,‡,§,∥,

DBP (mmHg) 69.4±7.9 71.9±8.0 73.9±7.6 76.3±7.1 <0.001 <0.001 *

,†,‡,§,∥,

Smoking <0.001 <0.001 *

,†,‡,§,∥,

Non-smoker 70,753 (84.7) 58,768 (70.3) 47,115 (56.4) 31,578 (37.8)

Ex-smoker 3,928 (4.7) 7,261 (8.7) 11,548 (13.8) 15,162 (18.1)

Current smoker 8,877 (10.6) 17,547 (21.0) 24,908 (29.8) 36,835 (44.1) Alcohol consumption

Amount (g/wk) 31.1±76.6 48.3±101.0 71.6±127.9 120.0±173.0 <0.001 <0.001 *

,†,‡,§,∥,

Activity (met-min/wk) 346.2±351.5 379.2±383.3 388.0±389.0 373.8±374.9 <0.001 <0.001 *

,†,‡,§,∥,

Laboratory findings

Hemoglobin (g/dL) 13.0±1.4 13.5±1.6 14.1±1.6 14.8±1.4 <0.001 <0.001 *

,†,‡,§,∥,

Fasting glucose (mg/dL) 87.9±9.5 90.3±10.2 92.2±10.8 94.8±11.4 <0.001 <0.001 *

,†,‡,§,∥,

Total cholesterol (mg/dL) 177.0±34.0 187.3±35.8 196.5±39.1 207.0±40.3 <0.001 <0.001 *

,†,‡,§,∥,

Triglyceride (mg/dL) 62.7±22.6 88.2±34.0 119.9±53.5 196.7±130.7 <0.001 <0.001 *

,†,‡,§,∥,

HDL cholesterol (mg/dL) 64.1±24.4 59.3±20.0 55.6±26.1 51.7±32.0 <0.001 <0.001 *

,†,‡,§,∥,

LDL cholesterol (mg/dL) 109.0±247.6 113.7±141.8 121.2±129.3 122.5±124.7 <0.001 <0.001 *

,†,‡,§,

Creatinine (mg/dL) 0.9±1.0 1.0±1.1 1.0±1.2 1.1±1.2 <0.001 <0.001 *

,†,‡,§,∥,

GFR (mL/min/1.73m

2

) 90.1±28.1 90.0±28.3 92.2±28.9 99.3±30.6 <0.001 <0.001

†,‡,§,∥,

GGT (U/L) 14.2±5.6 19.1±9.9 27.9±20.3 59.7±61.8 <0.001 <0.001 *

,†,‡,§,∥,

Data are shown as mean±standard deviation or number (%).

BMI = body mass index; DBP = diastolic blood pressure; FLI = fatty liver index; GFR = glomerular filtration rate; GGT = gamma-glutamyl transferase; HDL = high- density lipoprotein; LDL = low-density lipoprotein; SBP = systolic blood pressure.

* p value less than <0.05 between Q1 and Q2;

p value less than <0.05 between Q1 and Q3;

p value less than <0.05 between Q1 and Q4;

§

p value less than <0.05

between Q2 and Q3;

p value less than <0.05 between Q2 and Q4;

p value less than <0.05 between Q3 and Q4.

(6)

Table 2. Univariate analysis of new-onset hypertension

Characteristics Value Number HT (%) HR Lower 95% CI Upper p value

Total Total 334,280 24,678 (7.4)

Sex Female 172,942 12,078 (7.0) Reference

Male 161,338 12,600 (7.8) 1.078 1.052 1.105 <0.001

Age (years) 20–34 105,025 1,484 (1.4) Reference

35–49 140,416 8,249 (5.9) 4.055 3.837 4.286 <0.001

50–64 73,402 10,463 (14.3) 9.974 9.434 10.531 <0.001

65–74 12,424 3,453 (27.8) 20.550 19.337 21.839 <0.001

≥75 3,013 1,029 (34.2) 30.195 27.886 32.694 <0.001

Continuous 1.069 1.068 1.070 <0.001

BMI (kg/m

2

) <18.5 18,105 578 (3.2) 0.619 0.568 0.674 <0.001

18.5–19.9 35,876 1,276 (3.6) 0.679 0.639 0.722 <0.001

20–22.4 96,932 5,166 (5.3) Reference

22.5–24.9 98,562 8,052 (8.2) 1.526 1.474 1.580 <0.001

≥25 84,805 9,606 (11.3) 2.186 2.113 2.261 <0.001

Continuous 1.109 1.105 1.112 <0.001

Smoking Non-smoker 208,214 14,968 (7.2) Reference

Ex-smoker 37,899 3,516 (9.3) 1.250 1.205 1.296 <0.001

Current-smoker 88,167 6,194 (7.0) 0.970 0.942 1.000 0.046

Alcohol consumption 0 165,260 13,879 (8.4) Reference

≤140 118,075 6,629 (5.6) 0.668 0.649 0.688 <0.001

>140 50,945 4,170 (8.2) 0.972 0.939 1.006 0.110

Continuous 1.000 1.000 1.000 <0.001

SBP (mmHg) <120 179,358 7,052 (3.9) Reference

120–139 154,922 17,626 (11.4) 2.965 2.884 3.048 <0.001

Continuous 1.061 1.060 1.062 <0.001

DBP (mmHg) <80 228,640 11,739 (5.1) Reference

80–89 105,640 12,939 (12.2) 2.420 2.361 2.482 <0.001

Continuous 1.071 1.070 1.073 <0.001

FBS (mg/dL) <100 266,830 17,552 (6.6) Reference

100–125 67,450 7,126 (10.6) 1.638 1.593 1.683 <0.001

Continuous 1.025 1.024 1.026 <0.001

Activity (met-min/wk) <500 239,770 17,756 (7.4) Reference

500–999 70,461 4,820 (6.8) 0.920 0.891 0.950 <0.001

≥1,000 24,049 2,102 (8.7) 1.177 1.125 1.231 <0.001

Continuous 1.000 1.000 1.000 0.743

Waist circumference (cm) 1.049 1.048 1.051 <0.001

Total cholesterol (mg/dL) 4.784 4.529 5.056 <0.001

Triglyceride (mg/dL) 1.747 1.711 1.783 <0.001

HDL-cholesterol (mg/dL) 0.536 0.511 0.562 <0.001

LDL-cholesterol (mg/dL) 1.663 1.618 1.710 <0.001

GGT (U/L) 1.497 1.473 1.521 <0.001

BMI = body mass index; CI = confidence interval; DBP = diastolic blood pressure; FBS = fasting blood glucose; GGT = gamma-glutamyl transferase; HDL = high- density lipoprotein; HR = hazard ratio; HT = hypertension; LDL = low-density lipoprotein; SBP = systolic blood pressure.

Table 3. Association between FLI and new-onset HT

FLI Number New-onset HT (%) Univariate Model 1 * Model 2

HR 95% CI p value HR 95% CI p value HR 95% CI p value

Continuous 334,280 24,678 (7.4) 1.016 1.016–1.017 <0.001 1.018 1.018–1.019 <0.001 1.013 1.012–1.014 <0.001 FLI quartile

Q1 (0–4.9) 83,558 2,277 (2.7) Reference Reference Reference

Q2 (5.0–12.5) 83,576 4,858 (5.8) 2.086 1.985–2.193 <0.001 1.515 1.441–1.593 <0.001 1.319 1.255–1.388 <0.001 Q3 (12.6–31.0) 83,571 7,575 (9.1) 3.249 3.100–3.405 <0.001 2.166 2.065–2.273 <0.001 1.695 1.615–1.779 <0.001 Q4 (>31.0) 83,575 9,968 (11.9) 4.352 4.159–4.555 <0.001 3.377 3.219–3.543 <0.001 2.330 2.218–2.448 <0.001 CI = confidential interval; FLI = fatty liver index; HR hazard ratio; HT = hypertension.

* Cox proportional hazard models including age, and sex as covariates;

Cox proportional hazard models including age, sex, smoking, drinking, activity, systolic

and diastolic blood pressure, fasting blood glucose, and cholesterol.

(7)

According to the change of FLI after 2 years, more than 20% increase of FLI than the baseline had increased risk of new-onset hypertension in Q1 and Q2 (Q1: HR, 1.175; 95% CI, 1.052–1.312;

p=0.004 and Q2: HR, 1.113; 95% CI, 1.033–1.200; p=0.005; Table 4). In Q3 and Q4, the decrease of FLI more than 20% had decreased risk of new-onset hypertension (Q3: HR, 0.874;

95% CI, 0.819–0.933; p<0.001 and Q4: HR, 0.871; 95% CI, 0.871–0.977; p=0.006; Table 4). The increase of FLI was associated with increased risk of new-onset hypertension in all quartiles.

1.0

0.8 0.9

0.7 0 500 1,000 1,500 2,000 2,500

Days from the index day to hypertension

Ev ent -fr ee survival

1st quartile 2nd quartile 3rd quartile 4th quartile

p<0.0001

1st quartile 2nd quartile 3rd quartile 4th quartile

83,558 83,576 83,571 83,575

78,798 79,081 78,686 77,785

68,733 70,070 69,815 68,435

55,531 57,604 57,488 56,007

34,633 37,127 37,997 36,759

329 592 723 581 No. at risk

Figure 2. Cumulative incidence of new-onset hypertension according to their quartiles. Statistical significance was determined using the log-rank test.

Table 4. Association between the change of fatty liver index after 2 years and new-onset hypertension

Variable Univariate Model 1 * Model 2

HR 95% CI p value HR 95% CI p value HR 95% CI p value

Q1

Stable Reference Reference Reference

≥20% increase 1.410 1.264–1.573 <0.001 1.310 1.175–1.462 <0.001 1.175 1.052–1.312 0.004

Continuous 1.041 1.034–1.048 <0.001 1.038 1.029–1.047 <0.001 1.024 1.014–1.033 <0.001

Q2

Stable Reference Reference Reference

≥20% increase 1.226 1.139–1.319 <0.001 1.324 1.230–1.424 <0.001 1.113 1.033–1.200 0.005

Continuous 1.014 1.010–1.018 <0.001 1.022 1.018–1.026 <0.001 1.010 1.006–1.014 <0.001

Q3

Stable Reference Reference Reference

≥20% decrease 0.859 0.806–0.916 <0.001 0.758 0.711–0.808 <0.001 0.874 0.819–0.933 <0.001

Continuous 1.006 1.004–1.008 <0.001 1.015 1.013–1.017 <0.001 1.007 1.004–1.009 <0.001

Q4

Stable Reference Reference Reference

≥20% decrease 0.904 0.855–0.955 <0.001 0.775 0.733–0.819 <0.001 0.923 0.871–0.977 0.006

Continuous 1.004 1.003–1.006 <0.001 1.012 1.011–1.013 <0.001 1.006 1.004–1.007 <0.001

CI = confidential interval; HR = hazard ratio.

* Cox proportional hazard models including age, and sex as covariates;

Cox proportional hazard models including age, sex, drinking, activity, systolic and

diastolic blood pressure, fasting blood glucose, and cholesterol.

(8)

Subgroup analysis

Adjusted HRs summarized in Figure 3. FLI was a significant determinant of new-onset hypertension in all subgroups (Figure 3). FLI was associated with an increased risk of new- onset hypertension regardless of alcohol consumption and activity that can influence FLI.

DISCUSSION

In this study, higher FLI, not the presence of fatty liver disease, was associated independently with an increased risk for new-onset hypertension. Moreover, the increase of FLI after 2 years was associated with an increased risk of new-onset hypertension.

Several studies proved the association between NAFLD and hypertension. Donati et al.

14)

reported the higher prevalence of NAFLD in 55 non-obese, non-diabetic, non-alcohol drinking hypertensive patients compared with healthy subjects. In their study, hypertensive patients had significantly higher insulin resistance and higher BMI along with increased prevalence of NAFLD by ultrasonography. Aneni et al.

15)

showed the statistically significant association of BP with the presence and severity of NAFLD by ultrasonography in 5,362 healthy middle-aged Brazilian cohorts. Wang et al.

16)

presented that the increased prevalence of NAFLD by transient elastography in 836 Chinese who underwent health check-ups.

However, these cross-sectional studies show no causal relationship between hypertension and NAFLD, but only simple association.

Subgroup No. Events HR 95% CI p

Age

<65 years old 318,843 20,196 1.56 1.53–1.58 <0.001

≥65 years old 15,437 4,482 1.16 1.12–1.20 <0.001

Sex

Male 161,338 12,600 1.46 1.42–1.49 <0.001

Female 172,942 12,078 1.35 1.32–1.38 <0.001

Smoking status

Non-smoker 208,214 14,968 1.36 1.34–1.39 <0.001

Ex-smoker 37,899 3,516 1.41 1.35–1.47 <0.001

Current smoker 88,167 6,194 1.47 1.42–1.51 <0.001

Alcohol consumption (g/week)

0 165,260 13,879 1.33 1.31–1.36 <0.001

1–139 109,006 5,962 1.44 1.40–1.49 <0.001

≥140 60,014 4,837 1.50 1.44–1.56 <0.001

Activity (met-min/week)

<500 239,770 17,756 1.38 1.36–1.40 <0.001

500–999 70,461 4,820 1.42 1.37–1.47 <0.001

≥1,000 24,049 2,102 1.31 1.24–1.38 <0.001

SBP (mmHg)

<120 179,358 7,052 1.44 1.41–1.48 <0.001

≥120 154,922 17,626 1.37 1.35–1.39 <0.001

DBP (mmHg)

<80 228,640 11,739 1.41 1.38–1.44 <0.001

≥80 105,640 12,939 1.35 1.32–1.38 <0.001

Blood glucose (mg/dL)

<100 266,830 17,552 1.36 1.34–1.39 <0.001

≥100 67,450 7,126 1.43 1.38–1.47 <0.001

1

0.5 2

Figure 3. Forest plots of HRs for new-onset hypertension stratified by various clinical characteristics.

CI = confidence interval; DBP = diastolic blood pressure; HR = hazard ratio; SBP = systolic blood pressure.

(9)

There have been a few longitudinal studies which evaluated the association between NAFLD and new-onset hypertension.

9)

Sung et al.

17)

reported that developing incident fatty liver was associated with incident hypertension during 5 years in the multivariate analysis (adjusted odds ratio [OR], 1.60; 95% CI, 1.10–1.67; p<0.001) in a retrospective cohort including 11,448 patients. They also showed the resolution of the fatty liver at the follow-up, the risk of incident hypertension was similar to the reference group (adjusted OR, 1.21; 95% CI, 0.90–1.63; p=0.21). NAFLD assessed by ultrasonography was prospectively associated with new-onset hypertension in a large cohort of 22,090 Korean men.

9)

In their study, mild NAFLD (HR, 1.07; 95% CI, 1.00–1.15) and moderate to severe NAFLD (HR, 1.14; 95% CI, 1.00–1.30) had a significantly higher incidence of hypertension during 5 years of the follow-up. Another study by Huh et al.

18)

revealed increased FLI was significantly associated with higher incidence of hypertension (HRs in FLI <30 vs. 30–59 vs. ≥60 = 1 vs. 1.83 [95% CI, 1.16–2.88] vs. 2.09 [95% CI, 1.08–4.06], respectively) in a prospective cohort including 1,521 adults with an average of 2.6 years of follow-up. If we used similar criteria of FLI, our result was like the study (HRs in FLI <30 vs. 30–59 vs. ≥60 = 1 vs. 1.458 [95% CI, 1.414–1.503] vs. 1.980 [95% CI, 1.902–2.060], respectively, Supplementary Table 1). In this study, we showed increase of FLI at the follow-up visit, along with increased FLI at the baseline, was associated with increased risk of new-onset hypertension.

Several proposed mechanisms could explain the link between NAFLD and hypertension.

The first mechanism is insulin resistance. Although the role of insulin resistance in the development of hypertension has not been fully evaluated, there is clinical evidence suggesting a strong association between 2 comorbidities.

19)

In our study, higher fasting glucose concentration was a statistically significant determinant of new-onset hypertension in the univariate analysis. Insulin resistance may contribute to the development of

hypertension through increased activation of the sympathetic nervous system and renal sodium retention.

20)

Increased sympathetic nervous system can also increase hepatic fibrosis through the fibrogenic effects of sympathetic nervous system neurotransmitters on hepatic stellate cells.

21)

The second mechanism is activated renin-angiotensin-aldosterone system (RAAS). RASS

and increased angiotensin II are important mechanisms of hypertension. Also, angiotensin

II can be expressed by activated human hepatic stellate cells.

22)

There are pieces of evidences

increased local RAAS in chronic liver diseases, and activated local RAAS promote liver injury

and fibrosis through angiotensin II-mediated stimulation of fibroblast proliferation and

release of inflammatory cytokines.

23)

In fatty liver animal models, use of RAAS inhibitors led

to attenuation of the fatty liver progression.

24)

The third one is endothelial dysfunction which

is considered to increase arterial stiffness through increased vascular tone, sympathetic

overactivity, vascular remodeling and sodium retention.

25)

Several hepatokines, liver-

derived proteins, can affect the progression of atherosclerosis by inducing endothelial

dysfunction,

26)

and increased arterial stiffening may lead to increased pulse pressure and

arterial hypertension in NAFLD patients.

27)

Other proposed mechanisms include increased

inflammatory markers in NAFLD.

28)

Impaired fatty acid oxidation, increased oxidative stress,

and local inflammation can be associated with excessive accumulation of triglyceride in

hepatocytes. Also, they can promote a transition from simple steatosis to steatohepatitis.

29)

Our study has several limitations. First, we used administrative data to identify patients with

new-onset hypertension. Because these data relied on ICD-10 codes, there can be a certain

number of subjects with misdiagnosis and misclassification of hypertension. Second, we

(10)

did use variables in the check-up and did not adjust for other variables that need additional costs or examinations. Third, we cannot establish a causal relationship between NAFLD and increased incidence of hypertension because this study is an observational study. Finally, our study population included only Koreans. Thus, this result may have limitations in the generalization to other ethnic populations.

In conclusions, our findings demonstrated that increased FLI was independently associated with increased risk for hypertension in a healthy Korean population. Because management of hypertension along with control of metabolic syndrome remains a major step in the reduction of cardiovascular morbidity and mortality, the identification of increased hypertension risk may have important public health implications. Further studies are needed to document the effect of management of NAFLD not only on the risk of new-onset hypertension but also on the reduction of cardiovascular morbidity and mortality.

SUPPLEMENTARY MATERIAL

Supplementary Table 1

Association between FLI and new onset HT Click here to view

REFERENCES

1. McPherson S, Hardy T, Henderson E, Burt AD, Day CP, Anstee QM. Evidence of NAFLD progression from steatosis to fibrosing-steatohepatitis using paired biopsies: implications for prognosis and clinical management. J Hepatol 2015;62:1148-55.

PUBMED | CROSSREF

2. Targher G, Day CP, Bonora E. Risk of cardiovascular disease in patients with nonalcoholic fatty liver disease. N Engl J Med 2010;363:1341-50.

PUBMED | CROSSREF

3. Adams LA, Anstee QM, Tilg H, Targher G. Non-alcoholic fatty liver disease and its relationship with cardiovascular disease and other extrahepatic diseases. Gut 2017;66:1138-53.

PUBMED | CROSSREF

4. Angulo P. Nonalcoholic fatty liver disease. N Engl J Med 2002;346:1221-31.

PUBMED | CROSSREF

5. Angulo P, Kleiner DE, Dam-Larsen S, et al. Liver fibrosis, but no other histologic features, is associated with long-term outcomes of patients with nonalcoholic fatty liver disease. Gastroenterology 2015;149:389-397.e10.

PUBMED | CROSSREF

6. Kim HC, Ihm SH, Kim GH, et al. 2018 Korean Society of Hypertension guidelines for the management of hypertension: part I-epidemiology of hypertension. Clin Hypertens 2019;25:16.

PUBMED | CROSSREF

7. Whelton PK, Carey RM, Aronow WS, et al. 2017 ACC/AHA/AAPA/ABC/ACPM/AGS/APhA/ASH/ASPC/

NMA/PCNA guideline for the prevention, detection, evaluation, and management of high blood pressure in adults: a report of the American College of Cardiology/American Heart Association task force on clinical practice guidelines. Circulation 2018;138:e484-594.

PUBMED

8. Benjamin EJ, Muntner P, Alonso A, et al. Heart disease and stroke statistics-2019 update: a report from the American Heart Association. Circulation 2019;139:e56-528.

PUBMED | CROSSREF

9. Ryoo JH, Suh YJ, Shin HC, Cho YK, Choi JM, Park SK. Clinical association between non-alcoholic fatty liver disease and the development of hypertension. J Gastroenterol Hepatol 2014;29:1926-31.

PUBMED | CROSSREF

(11)

10. Lee J, Lee JS, Park SH, Shin SA, Kim K. Cohort profile: the National Health Insurance Service-National Sample Cohort (NHIS-NSC), South Korea. Int J Epidemiol 2017;46:e15.

PUBMED

11. Bedogni G, Bellentani S, Miglioli L, et al. The fatty liver index: a simple and accurate predictor of hepatic steatosis in the general population. BMC Gastroenterol 2006;6:33.

PUBMED | CROSSREF

12. Grundy SM, Cleeman JI, Daniels SR, et al. Diagnosis and management of the metabolic syndrome: an American Heart Association/National Heart, Lung, and Blood Institute scientific statement. Circulation 2005;112:2735-52.

PUBMED | CROSSREF

13. Yang BL, Wu WC, Fang KC, et al. External validation of fatty liver index for identifying ultrasonographic fatty liver in a large-scale cross-sectional study in Taiwan. PLoS One 2015;10:e0120443.

PUBMED | CROSSREF

14. Donati G, Stagni B, Piscaglia F, et al. Increased prevalence of fatty liver in arterial hypertensive patients with normal liver enzymes: role of insulin resistance. Gut 2004;53:1020-3.

PUBMED | CROSSREF

15. Aneni EC, Oni ET, Martin SS, et al. Blood pressure is associated with the presence and severity of nonalcoholic fatty liver disease across the spectrum of cardiometabolic risk. J Hypertens 2015;33:1207-14.

PUBMED | CROSSREF

16. Wang Y, Zeng Y, Lin C, Chen Z. Hypertension and non-alcoholic fatty liver disease proven by transient elastography. Hepatol Res 2016;46:1304-10.

PUBMED | CROSSREF

17. Sung KC, Wild SH, Byrne CD. Development of new fatty liver, or resolution of existing fatty liver, over five years of follow-up, and risk of incident hypertension. J Hepatol 2014;60:1040-5.

PUBMED | CROSSREF

18. Huh JH, Ahn SV, Koh SB, et al. A prospective study of fatty liver index and incident hypertension: the KoGES-ARIRANG study. PLoS One 2015;10:e0143560.

PUBMED | CROSSREF

19. Saad MF, Rewers M, Selby J, et al. Insulin resistance and hypertension: the insulin resistance atherosclerosis study. Hypertension 2004;43:1324-31.

PUBMED | CROSSREF

20. Reaven GM, Hoffman BB. A role for insulin in the aetiology and course of hypertension? Lancet 1987;2:435-7.

PUBMED | CROSSREF

21. Sigala B, McKee C, Soeda J, et al. Sympathetic nervous system catecholamines and neuropeptide Y neurotransmitters are upregulated in human NAFLD and modulate the fibrogenic function of hepatic stellate cells. PLoS One 2013;8:e72928.

PUBMED | CROSSREF

22. Bataller R, Sancho-Bru P, Ginès P, et al. Activated human hepatic stellate cells express the renin- angiotensin system and synthesize angiotensin II. Gastroenterology 2003;125:117-25.

PUBMED | CROSSREF

23. Warner FJ, Lubel JS, McCaughan GW, Angus PW. Liver fibrosis: a balance of ACEs? Clin Sci (Lond) 2007;113:109-18.

PUBMED | CROSSREF

24. Hirose A, Ono M, Saibara T, et al. Angiotensin II type 1 receptor blocker inhibits fibrosis in rat nonalcoholic steatohepatitis. Hepatology 2007;45:1375-81.

PUBMED | CROSSREF

25. Brandes RP. Endothelial dysfunction and hypertension. Hypertension 2014;64:924-8.

PUBMED | CROSSREF

26. Yoo HJ, Choi KM. Hepatokines as a link between obesity and cardiovascular diseases. Diabetes Metab J 2015;39:10-5.

PUBMED | CROSSREF

27. VanWagner LB, Wilcox JE, Colangelo LA, et al. Association of nonalcoholic fatty liver disease with subclinical myocardial remodeling and dysfunction: a population-based study. Hepatology 2015;62:773-83.

PUBMED | CROSSREF

28. Ndumele CE, Nasir K, Conceiçao RD, Carvalho JA, Blumenthal RS, Santos RD. Hepatic steatosis, obesity, and the metabolic syndrome are independently and additively associated with increased systemic inflammation. Arterioscler Thromb Vasc Biol 2011;31:1927-32.

PUBMED | CROSSREF

29. Browning JD, Horton JD. Molecular mediators of hepatic steatosis and liver injury. J Clin Invest 2004;114:147-52.

PUBMED | CROSSREF

수치

Figure 1. Overview of the study population.
Figure 2 demonstrates the cumulative incidences of new-onset hypertension according to  the FLI quartiles
Table 2. Univariate analysis of new-onset hypertension
Table 4. Association between the change of fatty liver index after 2 years and new-onset hypertension
+2

참조

관련 문서