The effects of Internet addiction on the lifestyle and dietary behavior of Korean adolescents
Yeonsoo Kim
1*, Jin Young Park
2*, Sung Byuk Kim
3, In-Kyung Jung
4, Yun Sook Lim
5and Jung-Hyun Kim
4§1
School of Human Ecology, Nutrition and Dietetics Program, Louisiana Tech University, LA 71272 USA
2
Graduate school of Education, Chung-Ang University, Seoul 156-756, Korea
3
Ministry for Health, Welfare and Family Affairs, Seoul 110-793, Korea
4
Department of Home Economics Education, Chung-Ang University, Heukseok-dong, Dongjak-gu, Seoul 156-756, Korea
5
Department of Food and Nutrition, Kyung Hee University, Seoul 130-701, Korea
Abstract
We performed this study to examine lifestyle patterns and dietary behavior based on the level of Internet addiction of Korean adolescents. Data were collected from 853 Korean junior high school students. The level of Internet addiction was determined based on the Korean Internet addiction self-scale short form for youth, and students were classified as high-risk Internet users, potential-risk Internet users, and no risk Internet users. The associations between the students’ levels of Internet addiction and lifestyle patterns and dietary behavior were analyzed using a chi-square test.
Irregular bedtimes and the use of alcohol and tobacco were higher in high-risk Internet users than no risk Internet users. Moreover, in high-risk Internet users, irregular dietary behavior due to the loss of appetite, a high frequency of skipping meals, and snacking might cause imbalances in nutritional intake. Diet quality in high-risk Internet users was also worse than in potential-risk Internet users and no risk Internet users. We demonstrated in this study that high-risk Internet users have inappropriate dietary behavior and poor diet quality, which could result in stunted growth and development. Therefore, nutrition education targeting high-risk Internet users should be conducted to ensure proper growth and development.
Key Words: Internet addiction, dietary behavior, diet quality, adolescents
Introduction
8)The Internet has become an important tool for social interaction, information, and entertainment [1]. However, as the Internet has moved into homes, schools, Internet cafes, and businesses, the prevalence of Internet addiction has been increasing rapidly. Internet addiction is characterized as poorly controlled Internet use, and can lead to impulse-control disorders [2]. Recently, Internet addiction, especially among adolescents, has been recognized as an important social issue in various countries because of the high prevalence of depression, aggressive behavior, psychiatric symptoms, and interpersonal problems associated with this addiction [3,4]. The incidence of Internet addiction in adolescents was estimated to be approximately 11%
in China [2], 8% in Greece [5], and 18.4% in Korea [1].
Adolescents are more vulnerable to Internet addiction than adults, and the social performance, psychology, and lifestyle habits of Internet addicts can be affected by this addiction [6].
Numerous cross-sectional studies have shown that Internet addiction has an adverse effect on several lifestyle-related factors
in adolescents; it can result in irregular dietary habits, extended periods of time spent on the Internet [7], physical inactivity, short duration of sleep [2], and increased use of alcohol and tobacco [2,8,9]. Some studies have reported that the change in lifestyle- related factors caused by heavy Internet use could have an adverse impact on the growth and development of Internet addicts [2,7].
Nutritional status also plays a crucial role in growth and development during adolescence. Several studies have shown that malnutrition or unbalanced nutritional intake can reduce weight gain and decrease leg length in adolescents [9,10]. Optimal nutrition is therefore important for adolescents to grow and develop properly. Moreover, once dietary habits are formed during childhood, they tend to be carried on throughout adulthood, thus teaching adolescents to develop healthy eating habits is of critical importance [11].
Numerous studies have showed associations between Internet addiction and mental health problems, such as depression and psychiatric symptoms, among adolescents. However, information on the effects of Internet addiction on the dietary behavior of
* Yeonsoo Kim and Jin Young Park are Co-first authors.
§Corresponding Author: Jung-Hyun Kim, Tel. 82-2-820-5278, Fax. 82-2-817-7304, Email. [email protected]
Received: November 17, 2009, Revised: February 16, 2010, Accepted: February 16, 2010
ⓒ2010 The Korean Nutrition Society and the Korean Society of Community Nutrition
This is an Open Access article distributed under the terms of the Creative Commons Attribution Non-Commercial License (http://creativecommons.org/licenses/by-nc/3.0/)
which permits unrestricted non-commercial use, distribution, and reproduction in any medium, provided the original work is properly cited.
adolescents is limited. Therefore, in this study, we examined the dietary behavior of Korean adolescents according to their level of Internet addiction.
Subjects and Methods
Subjects
This cross-sectional study included 1,000 adolescents from grades 7 through 9 living in Seoul, Korea. Of 1,000 participants, 800 students were recruited from eight junior high schools. The remaining 200 subjects were recruited from the Korean Youth Counseling Institute (KYCI), where they had been diagnosed and were being treated as Internet addicts. The study was conducted from October 2008 to November 2008. The Institutional Review Board of Chung-Ang University (Seoul, Korea) deemed this study exempt from the requirement for informed consent. Of the 1,000 surveys administered and collected, 147 were excluded due to incomplete responses and difficulty in assessing the level of Internet addiction, thus a total of 853 samples were analyzed in this study.
Korean Internet addiction test (KS scale)
Internet addiction was evaluated using the Korean version of the Internet addiction self-scale short form (KS scale) for youth, which was developed by the Korea Agency for Digital Opportunity and Promotion [12]. In brief, the KS scale for adolescents is a 20-item self-report questionnaire, consisting of six core components: disturbance of daily routines, self-esteem, withdrawal, virtual interpersonal relationship, deviant behavior, and tolerance. Response to each question is on 4-point Likert scale where 1 corresponds to “not at all”, 2 corresponds to
“sometimes”, 3 corresponds to “frequently”, and 4 corresponds to “always”. The level of Internet addiction was categorized as either high-risk, potential-risk, or no risk based on the total score and the score for the three components of disturbance of daily routines, withdrawal, and tolerance. Subjects were classified as high-risk Internet users if their total score was the same or greater than 52, and/or if the score for disturbance of daily routine, withdrawal, and tolerance was greater than 16, 10, and 12, respectively. Subjects were classified as potential-risk Internet users if their total score was greater than or equal to 48 and less than 52 and/or if their score for disturbance of daily routine, withdrawal, and tolerance was greater than 14, 9, and 11, respectively. Subjects were classified as no risk Internet users if their total score was less than 48.
Subject characteristics and lifestyle patterns
The following socio-demographic characteristics of subjects were used in this analysis: age at the time of recruitment, family
income per month, and the education level of the parents. A lifestyle habit questionnaire assessed the regularity of bedtime, sleep disturbance, and the use of alcohol and tobacco.
Dietary behaviors and diet quality
The dietary behavior questionnaire assessed recent changes in meal size, appetite, eating speed, frequency and reasons for skipping meals, and the frequency, type, and reasons for snacking. Diet quality was assessed by a 10-item mini-dietary assessment index. The mini-dietary assessment index was used to assess overall dietary quality based on the 2005 Dietary Guidelines and Food Tower for Koreans [13]. This index includes four food groups that should be consumed, four food groups that limited amounts of should be consumed, and two items regarding varied and regular diet. Responses to food items of which sufficient amounts should be consumed were reported using a 5-point Likert scale where 1=seldom, 3=sometimes, and 5=always.
Responses to food items of which limited quantities should be consumed were also reported using a 5-point Likert scale where 1=always, 3=sometimes, and 5=seldom. The maximum possible score for diet quality is 50. In this study, diet quality was defined as “good” if the total score was greater than or equal to 30 [14].
Statistical analyses
All analyses were performed with a significance level of α
=0.05 using the SPSS software package version 12.0 (SPSS Inc, Chicago, IL, USA). Relationships between levels of Internet addiction and socio-demographic characteristics, lifestyle patterns, and dietary behavior were analyzed using the chi-square test. The relationship between dietary quality and level of Internet addiction based on the self-scale rating system were analyzed using one-way ANOVA followed by Duncan’s multiple range test for multiple comparisons.
Results
General characteristics of subjects
The general characteristics of the participants and the relationships between the level of Internet addiction and general characteristics are provided in Table 1. Subjects were between the ages of 13 and 15 years with a mean age of 14.0 years. More boys were high-risk Internet users than girls (31.4% vs.14.0%), and more girls were no risk Internet users than boys (74.7% vs. 58.9%).
Younger adolescents were significantly more likely to be high-
risk Internet users than older adolescents (P < 0.001). Household
monthly income was significantly related to the level of Internet
addiction; adolescents from households with a low monthly
income (< 1,000 K won and 1,000 K-1,999 K won) were more
likely to be high-risk Internet users (57.5% and 31.7%, respectively)
Table 1. Subject characteristics based on level of Internet addiction
High risk (n=186) Potential risk (n=90) No risk (n=577) Total (n=853) P-value Gender
Boys 120 (31.4)1) 37 (9.7) 225 (58.9) 382 (100.0) < 0.001
Girls 66 (14.0) 53 (11.3) 352 (74.7) 471 (100.0)
Age (years)
13 72 (33.8) 15 (7.0) 126 (59.2) 213 (100.0) < 0.001
14 58 (18.3) 46 (14.5) 213 (67.2) 317 (100.0)
15 56 (17.3) 29 (9.0) 238 (73.7) 323 (100.0)
Monthly income (Korean Won)2)
< 1,000K 23 (57.5) 3 (7.5) 14 (35.0) 40 (100.0) < 0.001
1,000K-1,999K 38 (31.7) 15 (12.5) 67 (55.8) 120 (100.0)
2,000K-2,999K 35 (22.2) 25 (15.8) 98 (62.0) 158 (100.0)
3,000K-3,999K 29 (15.9) 14 (7.7) 139 (76.4) 182 (100.0)
≥4,000K 43 (15.6) 28 (10.1) 205 (74.3) 276 (100.0)
Father’s education
High school graduate & under 79 (27.2) 28 (9.7) 183 (63.1) 290 (100.0) < 0.001
College graduate 61 (17.3) 37 (10.5) 254 (72.2) 352 (100.0)
Graduate school graduate 17 (15.2) 17 (15.2) 78 (69.6) 112 (100.0)
Others 12 (57.1) 1 (4.8) 8 (30.1) 21 (100.0)
Mother’s education
High school graduate & under 92 (22.4) 41 (10.4) 261 (66.2) 394 (100.0) 0.008
College graduate 55 (18.0) 31 (10.1) 220 (71.9) 306 (100.0)
Graduate school graduate 7 (13.5) 9 (17.3) 36 (69.2) 52 (100.0)
Others 11 (47.8) 3 (13.1) 9 (39.1) 23 (100.0)
1)N (%)
2)1,250 Korean won = 1US dollar
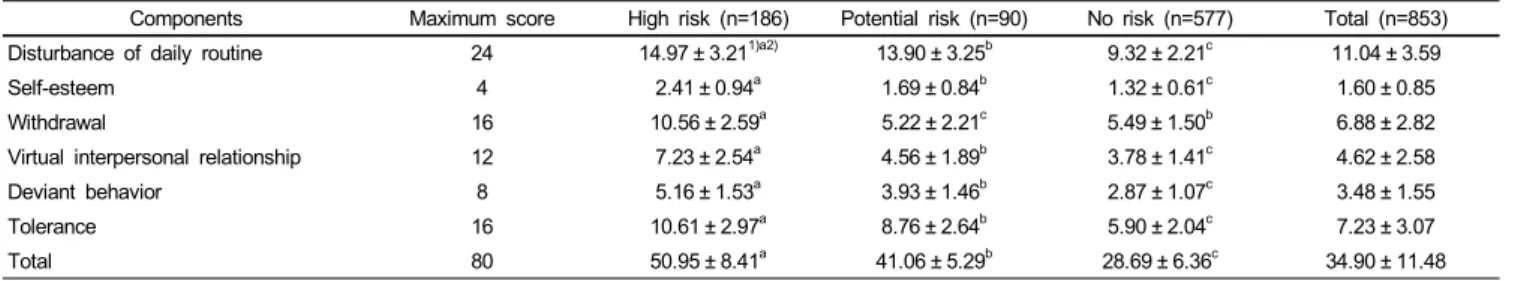
Table 2. KS-scale scores based on the level of Internet addiction
Components Maximum score High risk (n=186) Potential risk (n=90) No risk (n=577) Total (n=853)
Disturbance of daily routine 24 14.97 ± 3.211)a2) 13.90 ± 3.25b 9.32 ± 2.21c 11.04 ± 3.59
Self-esteem 4 2.41 ± 0.94a 1.69 ± 0.84b 1.32 ± 0.61c 1.60 ± 0.85
Withdrawal 16 10.56 ± 2.59a 5.22 ± 2.21c 5.49 ± 1.50b 6.88 ± 2.82
Virtual interpersonal relationship 12 7.23 ± 2.54a 4.56 ± 1.89b 3.78 ± 1.41c 4.62 ± 2.58
Deviant behavior 8 5.16 ± 1.53a 3.93 ± 1.46b 2.87 ± 1.07c 3.48 ± 1.55
Tolerance 16 10.61 ± 2.97a 8.76 ± 2.64b 5.90 ± 2.04c 7.23 ± 3.07
Total 80 50.95 ± 8.41a 41.06 ± 5.29b 28.69 ± 6.36c 34.90 ± 11.48
1)Mean ± S.D
2)Values with different superscript letters within a row are significantly different after Duncan’s multiple range test (P< 0.05).
than adolescents from households with a higher monthly income.
Adolescents from households with high monthly incomes (3,000K-3,999K won and ≥4,000K won) were more likely to be no risk Internet users (76.4% and 74.3%, respectively).
Parents’ educational status also affected the level of Internet addiction. High-risk Internet users had parents whose highest level of education was high school graduation or less (27.2%
in father and 22.4% in mother, respectively). In contrast, a high proportion of no risk Internet users had parents who were college graduates (72.2% in father and 71.9% in mother, respectively).
KS-scale score
The total KS-scale score and the scores of the six components of the KS-scale are presented in Table 2. High-risk Internet users
had significantly higher total KS-scale scores and scores for the six main components than potential-risk Internet users and no risk Internet users (P < 0.05).
Lifestyle patterns
Lifestyle patterns, including bedtime, sleep disturbance, alcohol use, and tobacco use according to the level of Internet addiction are shown in Table 3. No risk Internet users had regular bedtime patterns (10.4% always had a regular bedtime and 41.8%
often had a regular bedtime) while high-risk Internet users complained of irregular bedtime patterns (13.6% reported often irregular bedtimes and 11.4% reported always irregular bedtimes).
Both high- and potential-risk Internet users suffered from sleep
disturbances (81.1% and 76.7%, respectively). Similarly, 66% of
Table 3. Lifestyle patterns based on the level of Internet addiction High risk
(n=186)
Potential risk (n=90)
No risk (n=577)
Total
(n=853) P-value Bedtime
Always regular 20 (10.9)1) 15 (16.7) 60 (10.4) 95 (11.2) < 0.001 Often regular 49 (26.6) 25 (27.8) 241 (41.8) 315 (37.0) Neither regular or
irregular
69 (37.5) 30 (33.3) 229 (39.7) 328 (38.5)
Often irregular 25 (13.6) 14 (15.6) 32 (5.5) 71 (8.3) Always irregular 21 (11.4) 6 (6.7) 15 (2.6) 42 (4.9) Sleep disturbance
Yes 150 (81.1) 69 (76.7) 278 (48.3) 497 (58.4) < 0.001 No 35 (18.9) 21 (23.3) 298 (51.7) 354 (41.6) Alcohol use
Yes 123 (66.5) 58 (64.4) 252 (43.7) 433 (50.8) < 0.001 No 62 (33.5) 32 (35.6) 325 (56.3) 419 (49.2) Tobacco use
Yes 97 (52.4) 28 (31.1) 90 (15.6) 215 (25.2) < 0.001 No 88 (47.6) 62 (68.9) 897 (84.4) 637 (74.8)
1)N (%)
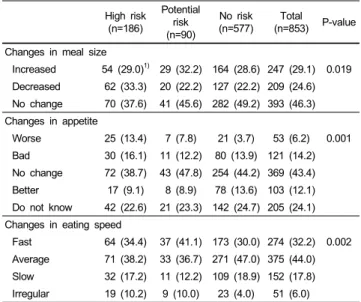
Table 4. Recent changes in dietary habits based on the level of Internet addiction
High risk (n=186)
Potential risk (n=90)
No risk (n=577) Total
(n=853) P-value Changes in meal size
Increased 54 (29.0)1) 29 (32.2) 164 (28.6) 247 (29.1) 0.019 Decreased 62 (33.3) 20 (22.2) 127 (22.2) 209 (24.6) No change 70 (37.6) 41 (45.6) 282 (49.2) 393 (46.3) Changes in appetite
Worse 25 (13.4) 7 (7.8) 21 (3.7) 53 (6.2) 0.001 Bad 30 (16.1) 11 (12.2) 80 (13.9) 121 (14.2) No change 72 (38.7) 43 (47.8) 254 (44.2) 369 (43.4) Better 17 (9.1) 8 (8.9) 78 (13.6) 103 (12.1) Do not know 42 (22.6) 21 (23.3) 142 (24.7) 205 (24.1) Changes in eating speed
Fast 64 (34.4) 37 (41.1) 173 (30.0) 274 (32.2) 0.002 Average 71 (38.2) 33 (36.7) 271 (47.0) 375 (44.0) Slow 32 (17.2) 11 (12.2) 109 (18.9) 152 (17.8) Irregular 19 (10.2) 9 (10.0) 23 (4.0) 51 (6.0)
1)N (%)
Table 5. Snacking patterns based on the level of Internet addiction High risk
(n=186)
Potential risk (n=90)
No risk (n=577) Total
(n=853) P-value
Skipping breakfast 0.683
Yes 88 (47.3)1) 43 (48.3) 228 (40.1) 359 (42.6) No 98 (52.7) 46 (51.7) 340 (59.9) 484 (57.4)
Skipping Lunch 0.177
Yes 16 (8.6) 6 (6.8) 34 (6.0) 56 (6.7)
No 170 (91.4) 82 (93.2) 531 (94.0) 783 (93.3)
Skipping Dinner 0.049
Yes 38 (20.4) 15 (17.1) 80 (14.1) 133 (17.0) No 148 (79.6) 73 (82.9) 486 (85.9) 707 (82.8) Reasons for meal skipping
Oversleep 49 (28.3) 22 (26.2) 112 (21.3) 183 (23.4) 0.026 No appetite 34 (19.7) 20 (23.8) 122 (23.2) 176 (22.5) Indigestion 6 (3.5) 6 (7.1) 29 (5.5) 41 (5.2) Snacking before
a meal
8 (4.6) 5 (6.0) 21 (4.0) 34 (4.3)
Weight loss 10 (5.6) 8 (9.5) 38 (7.2) 56 (7.2) Saving money 2 (2.9) 0 (0.0) 2 (0.4) 7 (0.9) Lack of time 25 (14.5) 10 (11.9) 118 (22.4) 153 (19.5) Habit 18 (10.4) 6 (7.1) 40 (7.6) 64 (8.2) Others 18 (10.4) 7 (8.3) 44 (8.4) 69 (8.8) Frequency of snacking
≥3 times/day 29 (15.8) 13 (14.4) 55 (9.7) 97 (11.5) 0.004 1-2/day 104 (56.5) 65 (72.2) 396 (69.8) 565 (67.2) None 51 (27.7) 12 (13.3) 116 (20.5) 179 (21.3) Snack items
Confectionery 86 (55.5) 50 (60.2) 239 (47.2) 375 (50.4) 0.245
Soda 4 (2.6) 4 (4.8) 38 (7.5) 46 (6.2)
Ttokbokki, rameon, fried foods
21 (13.5) 8 (9.6) 73 (14.4) 102 (13.7)
Fast foods 12 (7.7) 3 (3.6) 26 (5.1) 41 (5.5) Fruits 14 (9.0) 9 (10.8) 61 (12.1) 84 (11.3) Milk 15 (9.7) 8 (9.6) 55 (10.9) 78 (10.5) Others 3 (1.9) 1 (1.2) 14 (2.8) 18 (2.4) Reasons for snacking
Hunger 86 (46.7) 46 (51.1) 319 (55.6) 451 (53.2) 0.057 Lack of time for
a meal
10 (5.4) 1 (1.1) 30 (5.2) 41 (4.8)
Habit 28 (15.2) 22 (24.4) 79 (13.8) 129 (15.2) Boredom 33 (17.9) 14 (15.6) 98 (17.1) 145 (17.1) Social event 17 (9.2) 5 (5.6) 34 (5.9) 56 (6.6) Others 10 (5.4) 2 (2.2) 14 (2.4) 26 (3.1)
1)N (%)
high-risk Internet users and 64% of potential-risk Internet users had used alcohol. Fifty-two percent of high-risk Internet users had used tobacco while only 15.6% of no risk Internet users had used tobacco.
Dietary behavior and diet quality
Recent changes in eating habits among adolescents are provided in Table 4. More of high-risk Internet users answered that their dietary habits had been changed to have small meal sizes, a poor appetite, and irregular eating speeds than no risk Internet users (P=0.019, 0.001, and 0.002, respectively). High-risk Internet
users had a high prevalence of skipping dinner (Table 5).
High-risk Internet users snacked frequently, often snacking more than three times per day (15.8% vs. 9.7 % for no risk Internet users). Favorite snacks and reasons for snacking were not signi- ficantly different among adolescents based on levels of Internet addiction.
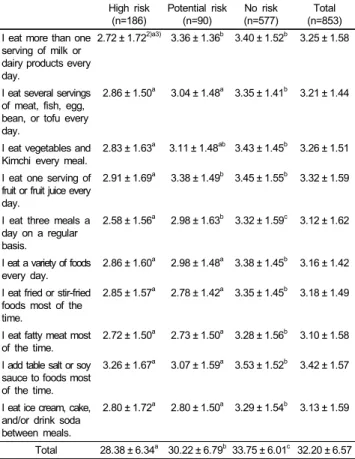
Diet quality based on levels of Internet addiction is shown
Table 6. Diet quality1) based on the level of Internet addiction High risk
(n=186)
Potential risk (n=90)
No risk (n=577)
Total (n=853) I eat more than one
serving of milk or dairy products every day.
2.72 ± 1.722)a3) 3.36 ± 1.36b 3.40 ± 1.52b 3.25 ± 1.58
I eat several servings of meat, fish, egg, bean, or tofu every day.
2.86 ± 1.50a 3.04 ± 1.48a 3.35 ± 1.41b 3.21 ± 1.44
I eat vegetables and Kimchi every meal.
2.83 ± 1.63a 3.11 ± 1.48ab 3.43 ± 1.45b 3.26 ± 1.51 I eat one serving of
fruit or fruit juice every day.
2.91 ± 1.69a 3.38 ± 1.49b 3.45 ± 1.55b 3.32 ± 1.59
I eat three meals a day on a regular basis.
2.58 ± 1.56a 2.98 ± 1.63b 3.32 ± 1.59c 3.12 ± 1.62
I eat a variety of foods every day.
2.86 ± 1.60a 2.98 ± 1.48a 3.38 ± 1.45b 3.16 ± 1.42 I eat fried or stir-fried
foods most of the time.
2.85 ± 1.57a 2.78 ± 1.42a 3.35 ± 1.45b 3.18 ± 1.49
I eat fatty meat most of the time.
2.72 ± 1.50a 2.73 ± 1.50a 3.28 ± 1.56b 3.10 ± 1.58 I add table salt or soy
sauce to foods most of the time.
3.26 ± 1.67a 3.07 ± 1.59a 3.53 ± 1.52b 3.42 ± 1.57
I eat ice cream, cake, and/or drink soda between meals.
2.80 ± 1.72a 2.80 ± 1.50a 3.29 ± 1.54b 3.13 ± 1.59
Total 28.38 ± 6.34a 30.22 ± 6.79b33.75 ± 6.01c 32.20 ± 6.57
1)Diet quality was assessed by using 10-item mini-dietary assessment index developed by Kim [14].
2)Mean ± SD
3)Values with different superscript letters within a row are significantly different (P < 0.05) after Duncan’s multiple range test.